|
Today, the Reserve Bank released the results of 104th round of its quarterly Industrial Outlook Survey (IOS). The survey encapsulates qualitative assessment of the business climate by Indian manufacturing companies for Q3:2023-24 and their expectations for Q4:2023-24[1] as well as outlook on select parameters for subsequent two quarters. In all, 1,040 companies responded in this round of the survey, which was conducted during Q3:2023-24.
Highlights:
1. Assessment for Q3:2023-24
- Manufacturing companies reported positive demand conditions during Q3:2023-24 as reflected in their assessment of production, capacity utilisation, pending orders, employment and overall business situation; they were, however, less sanguine when compared to the previous survey round (Table A).
- Pressures from cost of raw material, financing cost and salary outgo are assessed to have marginally eased.
- Selling prices and profit margins are gauged to have gone up during the quarter, though the sentiments were somewhat tempered when compared to the assessment in the previous quarter.
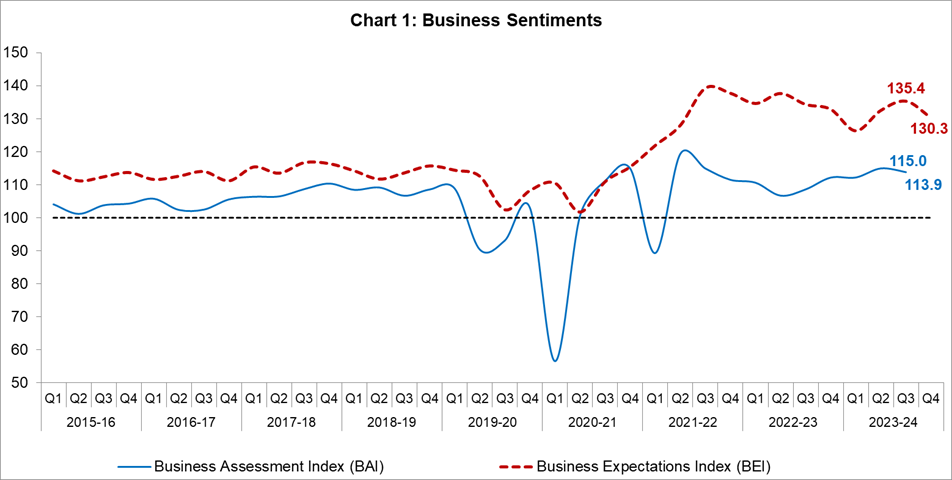
- The business assessment index (BAI)[2] in the manufacturing sector moderated to 113.9 in Q3:2023-24 from 115.0 in the previous quarter (Chart 1).
2. Expectations for Q4:2023-24
- Manufacturers remained optimistic on demand situation during Q4:2023-24, though the confidence was relatively lower when compared to the previous survey round (Table A).
- Input costs are likely to increase, though the pressures are likely to be lower.
- In synchrony with the positive demand prospects, selling prices and profit margin are expected to rise.
- The business expectations index (BEI) remained elevated at 130.3 in Q4:2023-24, though it moderated from 135.4 in the previous quarter (Chart 1).
3. Expectations for Q1:2024-25 and Q2:2024-25
- Manufacturing companies remain highly optimistic on production, capacity utilisation, order books, employment conditions and overall business situation (Table B).
- Input cost pressures are likely to persist during H1:2024-25 and selling prices are expected to move in tandem.
Table A: Summary of Net responses[3] on Survey Parameters
(per cent)
|
Parameters
|
Assessment period
|
Expectation period
|
|
Q2:2023-24
|
Q3:2023-24
|
Q3:2023-24
|
Q4:2023-24
|
|
Production
|
34.0
|
29.0
|
65.1
|
58.1
|
|
Order Books
|
30.7
|
26.3
|
62.3
|
55.8
|
|
Pending Orders
|
3.1
|
3.3
|
-1.1
|
1.1
|
|
Capacity Utilisation
|
29.5
|
19.6
|
57.5
|
46.7
|
|
Inventory of Raw Materials
|
-6.1
|
-8.9
|
-27.3
|
-25.7
|
|
Inventory of Finished Goods
|
-7.2
|
-9.5
|
-28.2
|
-25.3
|
|
Exports
|
17.7
|
11.6
|
53.1
|
43.6
|
|
Imports
|
17.2
|
14.5
|
51.0
|
41.0
|
|
Employment
|
18.0
|
18.2
|
38.8
|
39.5
|
|
Financial Situation (Overall)
|
30.9
|
25.6
|
63.5
|
54.2
|
|
Availability of Finance (from internal accruals)
|
30.8
|
23.7
|
59.1
|
47.4
|
|
Availability of Finance (from banks & other sources)
|
29.1
|
23.2
|
55.8
|
44.5
|
|
Availability of Finance (from overseas, if applicable)
|
18.6
|
14.2
|
53.5
|
43.9
|
|
Cost of Finance
|
-26.4
|
-22.5
|
-54.9
|
-45.9
|
|
Cost of Raw Material
|
-43.8
|
-33.4
|
-65.0
|
-54.2
|
|
Salary/ Other Remuneration
|
-28.8
|
-26.2
|
-45.6
|
-42.0
|
|
Selling Price
|
11.7
|
10.2
|
40.1
|
34.8
|
|
Profit Margin
|
4.5
|
1.4
|
35.8
|
30.8
|
|
Overall Business Situation
|
34.3
|
28.6
|
67.9
|
58.3
|
Table B: Business Expectations on Select Parameters for extended period – Net response
(per cent)
|
Parameters
|
Round 103
|
Round 104
|
|
Q3:2023-24
|
Q4:2023-24
|
Q1:2024:25
|
Q2:2024:25
|
|
Overall Business Situation
|
67.9
|
58.3
|
58.6
|
62.9
|
|
Production
|
65.1
|
58.1
|
57.0
|
59.7
|
|
Order Books
|
62.3
|
55.8
|
58.7
|
61.5
|
|
Capacity Utilisation
|
57.5
|
46.7
|
53.6
|
56.3
|
|
Employment
|
38.8
|
39.5
|
44.8
|
43.0
|
|
Cost of Raw Materials
|
-65.0
|
-54.2
|
-53.2
|
-54.0
|
|
Selling Prices
|
40.1
|
34.8
|
41.5
|
42.1
|
Note: Please see the excel file for time series data
|
Table 1: Assessment and Expectations for Production
(Percentage responses)
|
|
Quarter
|
Total response
|
Assessment
|
Expectations
|
|
Increase
|
Decrease
|
No change
|
Net response
|
Increase
|
Decrease
|
No change
|
Net response
|
|
Q3:2022-23
|
1,356
|
40.5
|
15.4
|
44.1
|
25.1
|
60.8
|
4.6
|
34.5
|
56.2
|
|
Q4:2022-23
|
1,066
|
46.3
|
13.3
|
40.4
|
33.0
|
61.2
|
3.8
|
34.9
|
57.4
|
|
Q1:2023-24
|
1,247
|
39.6
|
14.3
|
46.0
|
25.3
|
60.6
|
5.8
|
33.6
|
54.8
|
|
Q2:2023-24
|
1,223
|
45.2
|
11.2
|
43.6
|
34.0
|
63.0
|
5.0
|
31.9
|
58.0
|
|
Q3:2023-24
|
1,040
|
41.2
|
12.2
|
46.7
|
29.0
|
70.9
|
5.7
|
23.4
|
65.1
|
|
Q4:2023-24
|
|
|
|
|
|
62.3
|
4.2
|
33.6
|
58.1
|
|
‘Increase’ in production is optimistic.
Note: The sum of components may not add up to total due to rounding off (This is applicable for all tables).
|
|
Table 2: Assessment and Expectations for Order Books
(Percentage responses)
|
|
Quarter
|
Total response
|
Assessment
|
Expectations
|
|
Increase
|
Decrease
|
No change
|
Net response
|
Increase
|
Decrease
|
No change
|
Net response
|
|
Q3:2022-23
|
1,356
|
33.1
|
12.1
|
54.8
|
21.0
|
67.1
|
4.7
|
28.3
|
62.4
|
|
Q4:2022-23
|
1,066
|
37.2
|
11.8
|
51.0
|
25.4
|
63.3
|
3.9
|
32.8
|
59.4
|
|
Q1:2023-24
|
1,247
|
33.0
|
11.1
|
55.9
|
21.9
|
54.6
|
6.8
|
38.6
|
47.8
|
|
Q2:2023-24
|
1,223
|
41.1
|
10.4
|
48.5
|
30.7
|
63.0
|
4.8
|
32.2
|
58.1
|
|
Q3:2023-24
|
1,040
|
38.3
|
12.0
|
49.7
|
26.3
|
68.5
|
6.1
|
25.4
|
62.3
|
|
Q4:2023-24
|
|
|
|
|
|
61.8
|
6.0
|
32.1
|
55.8
|
|
‘Increase’ in order books is optimistic.
|
|
Table 3: Assessment and Expectations for Pending Orders
(Percentage responses)
|
|
Quarter
|
Total response
|
Assessment
|
Expectations
|
|
Above Normal
|
Below Normal
|
Normal
|
Net response
|
Above Normal
|
Below Normal
|
Normal
|
Net
response
|
|
Q3:2022-23
|
1,356
|
8.4
|
14.6
|
76.9
|
6.2
|
10.8
|
10.1
|
79.2
|
-0.7
|
|
Q4:2022-23
|
1,066
|
4.2
|
13.1
|
82.7
|
8.9
|
8.9
|
10.1
|
81.0
|
1.2
|
|
Q1:2023-24
|
1,247
|
9.2
|
14.1
|
76.6
|
4.9
|
4.5
|
8.0
|
87.5
|
3.4
|
|
Q2:2023-24
|
1,223
|
8.6
|
11.6
|
79.8
|
3.1
|
10.9
|
9.2
|
79.9
|
-1.7
|
|
Q3:2023-24
|
1,040
|
8.6
|
11.9
|
79.4
|
3.3
|
9.7
|
8.5
|
81.8
|
-1.1
|
|
Q4:2023-24
|
|
|
|
|
|
8.2
|
9.3
|
82.5
|
1.1
|
|
Pending orders ‘Below Normal’ is optimistic.
|
|
Table 4: Assessment and Expectations for Capacity Utilisation (Main Product)
(Percentage responses)
|
|
Quarter
|
Total response
|
Assessment
|
Expectations
|
|
Increase
|
Decrease
|
No change
|
Net response
|
Increase
|
Decrease
|
No change
|
Net
response
|
|
Q3:2022-23
|
1,356
|
29.8
|
15.0
|
55.2
|
14.9
|
51.5
|
4.9
|
43.6
|
46.6
|
|
Q4:2022-23
|
1,066
|
34.3
|
11.5
|
54.1
|
22.8
|
51.3
|
4.1
|
44.6
|
47.2
|
|
Q1:2023-24
|
1,247
|
28.5
|
13.0
|
58.5
|
15.5
|
46.7
|
5.5
|
47.8
|
41.2
|
|
Q2:2023-24
|
1,223
|
38.2
|
8.7
|
53.0
|
29.5
|
51.8
|
5.2
|
42.9
|
46.6
|
|
Q3:2023-24
|
1,040
|
30.1
|
10.6
|
59.3
|
19.6
|
62.1
|
4.6
|
33.3
|
57.5
|
|
Q4:2023-24
|
|
|
|
|
|
51.2
|
4.6
|
44.2
|
46.7
|
|
‘Increase’ in capacity utilisation is optimistic.
|
|
Table 5: Assessment and Expectations for Level of CU
(compared to the average in last 4 quarters)
(Percentage responses)
|
|
Quarter
|
Total response
|
Assessment
|
Expectations
|
|
Above Normal
|
Below Normal
|
Normal
|
Net response
|
Above Normal
|
Below Normal
|
Normal
|
Net response
|
|
Q3:2022-23
|
1,356
|
28.7
|
13.2
|
58.1
|
15.5
|
37.0
|
6.1
|
56.9
|
30.9
|
|
Q4:2022-23
|
1,066
|
19.8
|
10.5
|
69.7
|
9.3
|
34.7
|
8.1
|
57.2
|
26.7
|
|
Q1:2023-24
|
1,247
|
31.4
|
10.4
|
58.2
|
21.0
|
23.7
|
6.2
|
70.2
|
17.5
|
|
Q2:2023-24
|
1,223
|
30.5
|
9.0
|
60.6
|
21.5
|
39.0
|
6.0
|
55.1
|
33.0
|
|
Q3:2023-24
|
1,040
|
26.2
|
9.4
|
64.4
|
16.7
|
36.1
|
6.1
|
57.8
|
30.1
|
|
Q4:2023-24
|
|
|
|
|
|
33.3
|
5.7
|
61.1
|
27.6
|
|
‘Above Normal’ in Level of capacity utilisation is optimistic.
|
|
Table 6: Assessment and Expectations for Production Capacity
(with regard to expected demand in next 6 months)
(Percentage responses)
|
|
Quarter
|
Total response
|
Assessment
|
Expectations
|
|
More than adequate
|
Less than adequate
|
Adequate
|
Net response
|
More than adequate
|
Less than adequate
|
Adequate
|
Net response
|
|
Q3:2022-23
|
1,356
|
28.9
|
4.4
|
66.7
|
24.6
|
42.9
|
4.5
|
52.7
|
38.4
|
|
Q4:2022-23
|
1,066
|
17.3
|
5.7
|
77.0
|
11.6
|
42.7
|
3.3
|
53.9
|
39.4
|
|
Q1:2023-24
|
1,247
|
25.8
|
5.7
|
68.4
|
20.1
|
25.3
|
3.8
|
70.9
|
21.5
|
|
Q2:2023-24
|
1,223
|
23.3
|
4.0
|
72.7
|
19.3
|
43.4
|
3.9
|
52.7
|
39.5
|
|
Q3:2023-24
|
1,040
|
25.1
|
4.7
|
70.2
|
20.4
|
42.7
|
3.2
|
54.1
|
39.5
|
|
Q4:2023-24
|
|
|
|
|
|
38.5
|
3.6
|
57.9
|
34.9
|
|
‘More than adequate’ in Assessment of Production Capacity is optimistic.
|
|
Table 7: Assessment and Expectations for Exports
(Percentage responses)
|
|
Quarter
|
Total response
|
Assessment
|
Expectations
|
|
Increase
|
Decrease
|
No change
|
Net response
|
Increase
|
Decrease
|
No change
|
Net response
|
|
Q3:2022-23
|
1,356
|
25.6
|
17.1
|
57.3
|
8.5
|
61.2
|
5.2
|
33.6
|
56.0
|
|
Q4:2022-23
|
1,066
|
25.4
|
13.3
|
61.3
|
12.2
|
55.5
|
3.9
|
40.6
|
51.5
|
|
Q1:2023-24
|
1,247
|
30.1
|
12.5
|
57.4
|
17.6
|
43.0
|
6.8
|
50.2
|
36.2
|
|
Q2:2023-24
|
1,223
|
27.7
|
10.0
|
62.3
|
17.7
|
57.9
|
4.4
|
37.7
|
53.5
|
|
Q3:2023-24
|
1,040
|
25.1
|
13.5
|
61.3
|
11.6
|
58.1
|
5.0
|
36.9
|
53.1
|
|
Q4:2023-24
|
|
|
|
|
|
50.3
|
6.7
|
43.0
|
43.6
|
|
‘Increase’ in exports is optimistic.
|
|
Table 8: Assessment and Expectations for Imports
(Percentage responses)
|
|
Quarter
|
Total response
|
Assessment
|
Expectations
|
|
Increase
|
Decrease
|
No change
|
Net response
|
Increase
|
Decrease
|
No change
|
Net response
|
|
Q3:2022-23
|
1,356
|
23.8
|
12.2
|
64.0
|
11.6
|
60.8
|
3.2
|
36.0
|
57.6
|
|
Q4:2022-23
|
1,066
|
22.6
|
7.3
|
70.1
|
15.3
|
54.3
|
2.8
|
42.9
|
51.5
|
|
Q1:2023-24
|
1,247
|
28.9
|
8.6
|
62.5
|
20.4
|
37.4
|
4.2
|
58.4
|
33.2
|
|
Q2:2023-24
|
1,223
|
25.5
|
8.2
|
66.3
|
17.2
|
55.8
|
3.2
|
41.0
|
52.6
|
|
Q3:2023-24
|
1,040
|
23.2
|
8.7
|
68.0
|
14.5
|
54.8
|
3.9
|
41.3
|
51.0
|
|
Q4:2023-24
|
|
|
|
|
|
45.2
|
4.2
|
50.6
|
41.0
|
|
‘Increase’ in imports is optimistic.
|
|
Table 9: Assessment and Expectations for level of Raw Materials Inventory
(Percentage responses)
|
|
Quarter
|
Total response
|
Assessment
|
Expectations
|
|
Above average
|
Below average
|
Average
|
Net response
|
Above average
|
Below average
|
Average
|
Net response
|
|
Q3:2022-23
|
1,356
|
18.1
|
7.3
|
74.6
|
-10.8
|
32.8
|
7.1
|
60.1
|
-25.7
|
|
Q4:2022-23
|
1,066
|
13.1
|
4.7
|
82.2
|
-8.3
|
32.4
|
5.6
|
62.0
|
-26.8
|
|
Q1:2023-24
|
1,247
|
13.4
|
7.1
|
79.5
|
-6.3
|
20.5
|
2.5
|
76.9
|
-18.0
|
|
Q2:2023-24
|
1,223
|
11.5
|
5.3
|
83.2
|
-6.1
|
33.0
|
4.0
|
63.1
|
-29.0
|
|
Q3:2023-24
|
1,040
|
12.9
|
4.1
|
83.0
|
-8.9
|
30.9
|
3.6
|
65.6
|
-27.3
|
|
Q4:2023-24
|
|
|
|
|
|
27.4
|
1.7
|
70.9
|
-25.7
|
|
‘Below average’ Inventory of raw materials is optimistic.
|
|
Table 10: Assessment and Expectations for level of Finished Goods Inventory
(Percentage responses)
|
|
Quarter
|
Total response
|
Assessment
|
Expectations
|
|
Above average
|
Below average
|
Average
|
Net response
|
Above average
|
Below average
|
Average
|
Net response
|
|
Q3:2022-23
|
1,356
|
17.1
|
7.7
|
75.2
|
-9.5
|
33.4
|
6.9
|
59.7
|
-26.5
|
|
Q4:2022-23
|
1,066
|
13.3
|
5.1
|
81.5
|
-8.2
|
31.9
|
5.8
|
62.3
|
-26.1
|
|
Q1:2023-24
|
1,247
|
14.0
|
6.8
|
79.2
|
-7.2
|
19.9
|
2.8
|
77.3
|
-17.2
|
|
Q2:2023-24
|
1,223
|
11.7
|
4.5
|
83.7
|
-7.2
|
33.2
|
4.4
|
62.4
|
-28.8
|
|
Q3:2023-24
|
1,040
|
14.0
|
4.5
|
81.5
|
-9.5
|
31.4
|
3.3
|
65.3
|
-28.2
|
|
Q4:2023-24
|
|
|
|
|
|
27.3
|
2.0
|
70.7
|
-25.3
|
|
‘Below average’ Inventory of finished goods is optimistic.
|
|
Table 11: Assessment and Expectations for Employment
(Percentage responses)
|
|
Quarter
|
Total response
|
Assessment
|
Expectations
|
|
Increase
|
Decrease
|
No change
|
Net response
|
Increase
|
Decrease
|
No change
|
Net response
|
|
Q3:2022-23
|
1,356
|
23.0
|
9.4
|
67.7
|
13.6
|
45.0
|
1.2
|
53.9
|
43.8
|
|
Q4:2022-23
|
1,066
|
19.3
|
7.0
|
73.7
|
12.4
|
39.0
|
2.5
|
58.5
|
36.4
|
|
Q1:2023-24
|
1,247
|
25.9
|
9.9
|
64.2
|
16.1
|
29.8
|
3.1
|
67.1
|
26.7
|
|
Q2:2023-24
|
1,223
|
25.1
|
7.1
|
67.7
|
18.0
|
43.5
|
3.0
|
53.5
|
40.5
|
|
Q3:2023-24
|
1,040
|
25.1
|
6.9
|
67.9
|
18.2
|
42.5
|
3.7
|
53.8
|
38.8
|
|
Q4:2023-24
|
|
|
|
|
|
41.7
|
2.2
|
56.1
|
39.5
|
|
‘Increase’ in employment is optimistic.
|
|
Table 12: Assessment and Expectations for Overall Financial Situation
(Percentage responses)
|
|
Quarter
|
Total response
|
Assessment
|
Expectations
|
|
Better
|
Worsen
|
No change
|
Net response
|
Better
|
Worsen
|
No change
|
Net response
|
|
Q3:2022-23
|
1,356
|
35.6
|
15.5
|
49.0
|
20.1
|
61.4
|
3.8
|
34.8
|
57.7
|
|
Q4:2022-23
|
1,066
|
40.2
|
9.6
|
50.2
|
30.6
|
63.9
|
3.3
|
32.8
|
60.6
|
|
Q1:2023-24
|
1,247
|
36.6
|
12.6
|
50.7
|
24.0
|
56.3
|
3.4
|
40.3
|
52.9
|
|
Q2:2023-24
|
1,223
|
41.6
|
10.7
|
47.7
|
30.9
|
60.2
|
3.9
|
35.9
|
56.3
|
|
Q3:2023-24
|
1,040
|
36.8
|
11.2
|
52.0
|
25.6
|
68.7
|
5.1
|
26.2
|
63.5
|
|
Q4:2023-24
|
|
|
|
|
|
58.2
|
4.0
|
37.8
|
54.2
|
|
‘Better’ overall financial situation is optimistic.
|
|
Table 13: Assessment and Expectations for Working Capital Finance Requirement
(Percentage responses)
|
|
Quarter
|
Total response
|
Assessment
|
Expectations
|
|
Increase
|
Decrease
|
No change
|
Net response
|
Increase
|
Decrease
|
No change
|
Net response
|
|
Q3:2022-23
|
1,356
|
35.2
|
7.3
|
57.5
|
27.9
|
51.2
|
1.6
|
47.3
|
49.6
|
|
Q4:2022-23
|
1,066
|
36.4
|
4.3
|
59.3
|
32.1
|
52.3
|
1.1
|
46.5
|
51.2
|
|
Q1:2023-24
|
1,247
|
34.8
|
5.8
|
59.4
|
29.1
|
48.0
|
1.9
|
50.0
|
46.1
|
|
Q2:2023-24
|
1,223
|
38.4
|
5.1
|
56.6
|
33.3
|
53.3
|
2.2
|
44.4
|
51.1
|
|
Q3:2023-24
|
1,040
|
32.8
|
6.9
|
60.3
|
26.0
|
60.2
|
2.6
|
37.3
|
57.6
|
|
Q4:2023-24
|
|
|
|
|
|
49.6
|
2.9
|
47.6
|
46.7
|
|
‘Increase’ in working capital finance is optimistic.
|
|
Table 14: Assessment and Expectations for Availability of Finance (from Internal Accruals)
(Percentage responses)
|
|
Quarter
|
Total response
|
Assessment
|
Expectations
|
|
Improve
|
Worsen
|
No change
|
Net response
|
Improve
|
Worsen
|
No change
|
Net response
|
|
Q3:2022-23
|
1,356
|
31.1
|
9.1
|
59.8
|
21.9
|
51.3
|
2.0
|
46.7
|
49.3
|
|
Q4:2022-23
|
1,066
|
33.3
|
4.5
|
62.2
|
28.8
|
55.2
|
1.7
|
43.1
|
53.5
|
|
Q1:2023-24
|
1,247
|
33.2
|
7.4
|
59.4
|
25.8
|
48.7
|
2.0
|
49.3
|
46.6
|
|
Q2:2023-24
|
1,223
|
37.1
|
6.3
|
56.6
|
30.8
|
54.4
|
2.1
|
43.5
|
52.3
|
|
Q3:2023-24
|
1,040
|
30.6
|
6.9
|
62.5
|
23.7
|
61.6
|
2.5
|
35.9
|
59.1
|
|
Q4:2023-24
|
|
|
|
|
|
49.3
|
2.0
|
48.7
|
47.4
|
|
‘Improvement’ in availability of finance is optimistic.
|
|
Table 15: Assessment and Expectations for Availability of Finance (from banks and other sources)
(Percentage responses)
|
|
Quarter
|
Total response
|
Assessment
|
Expectations
|
|
Improve
|
Worsen
|
No change
|
Net response
|
Improve
|
Worsen
|
No change
|
Net response
|
|
Q3:2022-23
|
1,356
|
26.0
|
9.1
|
64.9
|
17.0
|
56.7
|
1.7
|
41.6
|
55.1
|
|
Q4:2022-23
|
1,066
|
27.8
|
4.5
|
67.7
|
23.3
|
50.5
|
1.3
|
48.2
|
49.2
|
|
Q1:2023-24
|
1,247
|
26.5
|
6.1
|
67.4
|
20.4
|
42.2
|
2.1
|
55.7
|
40.1
|
|
Q2:2023-24
|
1,223
|
34.9
|
5.7
|
59.4
|
29.1
|
50.5
|
1.5
|
47.9
|
49.0
|
|
Q3:2023-24
|
1,040
|
28.8
|
5.6
|
65.5
|
23.2
|
58.2
|
2.5
|
39.3
|
55.8
|
|
Q4:2023-24
|
|
|
|
|
|
46.5
|
2.1
|
51.4
|
44.5
|
|
‘Improvement’ in availability of finance is optimistic.
|
|
Table 16: Assessment and Expectations for Availability of Finance (from overseas, if applicable)
(per cent)
|
|
Quarter
|
Total response
|
Assessment
|
Expectations
|
|
Improve
|
Worsen
|
No change
|
Net response
|
Improve
|
Worsen
|
No change
|
Net response
|
|
Q3:2022-23
|
1,356
|
20.4
|
9.7
|
69.9
|
10.7
|
59.6
|
0.8
|
39.6
|
58.9
|
|
Q4:2022-23
|
1,066
|
11.1
|
3.6
|
85.3
|
7.6
|
51.3
|
1.3
|
47.4
|
50.1
|
|
Q1:2023-24
|
1,247
|
23.8
|
5.8
|
70.4
|
18.0
|
34.3
|
1.8
|
64.0
|
32.5
|
|
Q2:2023-24
|
1,223
|
24.3
|
5.7
|
69.9
|
18.6
|
52.4
|
2.0
|
45.7
|
50.4
|
|
Q3:2023-24
|
1,040
|
20.2
|
6.0
|
73.9
|
14.2
|
56.4
|
2.9
|
40.7
|
53.5
|
|
Q4:2023-24
|
|
|
|
|
|
45.3
|
1.4
|
53.4
|
43.9
|
|
‘Improvement’ in availability of finance is optimistic.
|
|
Table 17: Assessment and Expectations for Cost of Finance
(per cent)
|
|
Quarter
|
Total response
|
Assessment
|
Expectations
|
|
Increase
|
Decrease
|
No change
|
Net
response
|
Increase
|
Decrease
|
No change
|
Net response
|
|
Q3:2022-23
|
1,356
|
37.0
|
5.9
|
57.1
|
-31.1
|
53.5
|
1.6
|
44.9
|
-51.9
|
|
Q4:2022-23
|
1,066
|
36.2
|
3.8
|
60.0
|
-32.4
|
51.6
|
1.1
|
47.3
|
-50.5
|
|
Q1:2023-24
|
1,247
|
36.9
|
4.5
|
58.6
|
-32.4
|
47.5
|
1.7
|
50.8
|
-45.8
|
|
Q2:2023-24
|
1,223
|
33.0
|
6.6
|
60.4
|
-26.4
|
56.4
|
2.2
|
41.5
|
-54.2
|
|
Q3:2023-24
|
1,040
|
29.2
|
6.8
|
64.0
|
-22.5
|
58.5
|
3.6
|
37.9
|
-54.9
|
|
Q4:2023-24
|
|
|
|
|
|
48.8
|
2.9
|
48.3
|
-45.9
|
|
‘Decrease’ in cost of finance is optimistic.
|
|
Table 18: Assessment and Expectations for Cost of Raw Materials
(Percentage responses)
|
|
Quarter
|
Total response
|
Assessment
|
Expectations
|
|
Increase
|
Decrease
|
No change
|
Net
response
|
Increase
|
Decrease
|
No change
|
Net response
|
|
Q3:2022-23
|
1,356
|
73.0
|
8.1
|
18.9
|
-64.9
|
66.8
|
2.6
|
30.7
|
-64.2
|
|
Q4:2022-23
|
1,066
|
64.5
|
5.4
|
30.2
|
-59.1
|
63.4
|
2.4
|
34.2
|
-60.9
|
|
Q1:2023-24
|
1,247
|
49.1
|
8.0
|
42.8
|
-41.1
|
62.6
|
1.7
|
35.8
|
-60.9
|
|
Q2:2023-24
|
1,223
|
49.3
|
5.5
|
45.3
|
-43.8
|
60.6
|
2.4
|
37.0
|
-58.3
|
|
Q3:2023-24
|
1,040
|
41.8
|
8.4
|
49.7
|
-33.4
|
67.8
|
2.8
|
29.3
|
-65.0
|
|
Q4:2023-24
|
|
|
|
|
|
57.0
|
2.9
|
40.1
|
-54.2
|
|
‘Decrease’ in cost of raw materials is optimistic.
|
|
Table 19: Assessment and Expectations for Salary/Other Remuneration
(Percentage responses)
|
|
Quarter
|
Total response
|
Assessment
|
Expectations
|
|
Increase
|
Decrease
|
No change
|
Net response
|
Increase
|
Decrease
|
No change
|
Net response
|
|
Q3:2022-23
|
1,356
|
30.1
|
3.1
|
66.8
|
-27.0
|
46.3
|
0.3
|
53.4
|
-46.0
|
|
Q4:2022-23
|
1,066
|
23.1
|
1.9
|
75.0
|
-21.2
|
39.3
|
0.6
|
60.0
|
-38.7
|
|
Q1:2023-24
|
1,247
|
41.1
|
3.0
|
56.0
|
-38.1
|
45.2
|
0.9
|
53.9
|
-44.3
|
|
Q2:2023-24
|
1,223
|
32.3
|
3.5
|
64.2
|
-28.8
|
49.8
|
0.5
|
49.7
|
-49.3
|
|
Q3:2023-24
|
1,040
|
30.3
|
4.1
|
65.7
|
-26.2
|
47.3
|
1.7
|
51.0
|
-45.6
|
|
Q4:2023-24
|
|
|
|
|
|
42.9
|
0.9
|
56.2
|
-42.0
|
|
‘Decrease’ in Salary / other remuneration is optimistic.
|
|
Table 20: Assessment and Expectations for Selling Price
(Percentage responses)
|
|
Quarter
|
Total response
|
Assessment
|
Expectations
|
|
Increase
|
Decrease
|
No change
|
Net response
|
Increase
|
Decrease
|
No change
|
Net response
|
|
Q3:2022-23
|
1,356
|
23.3
|
12.9
|
63.8
|
10.4
|
48.8
|
3.7
|
47.5
|
45.1
|
|
Q4:2022-23
|
1,066
|
21.6
|
11.8
|
66.6
|
9.7
|
43.2
|
3.6
|
53.1
|
39.6
|
|
Q1:2023-24
|
1,247
|
26.1
|
13.3
|
60.6
|
12.8
|
34.0
|
5.6
|
60.4
|
28.4
|
|
Q2:2023-24
|
1,223
|
22.3
|
10.6
|
67.1
|
11.7
|
46.9
|
5.4
|
47.7
|
41.4
|
|
Q3:2023-24
|
1,040
|
22.0
|
11.9
|
66.1
|
10.2
|
45.2
|
5.2
|
49.6
|
40.1
|
|
Q4:2023-24
|
|
|
|
|
|
40.4
|
5.6
|
54.0
|
34.8
|
|
‘Increase’ in selling price is optimistic.
|
|
Table 21: Assessment and Expectations for Profit Margin
(Percentage responses)
|
|
Quarter
|
Total response
|
Assessment
|
Expectations
|
|
Increase
|
Decrease
|
No change
|
Net response
|
Increase
|
Decrease
|
No change
|
Net response
|
|
Q3:2022-23
|
1,356
|
17.6
|
26.1
|
56.3
|
-8.4
|
44.2
|
9.0
|
46.8
|
35.2
|
|
Q4:2022-23
|
1,066
|
16.2
|
21.6
|
62.1
|
-5.4
|
41.0
|
8.1
|
50.9
|
32.9
|
|
Q1:2023-24
|
1,247
|
20.6
|
21.8
|
57.5
|
-1.2
|
30.5
|
11.4
|
58.1
|
19.1
|
|
Q2:2023-24
|
1,223
|
21.9
|
17.4
|
60.7
|
4.5
|
43.8
|
8.1
|
48.1
|
35.7
|
|
Q3:2023-24
|
1,040
|
20.5
|
19.1
|
60.4
|
1.4
|
45.5
|
9.7
|
44.8
|
35.8
|
|
Q4:2023-24
|
|
|
|
|
|
40.3
|
9.5
|
50.2
|
30.8
|
|
‘Increase’ in profit margin is optimistic.
|
|
Table 22: Assessment and Expectations for Overall Business Situation
(Percentage responses)
|
|
Quarter
|
Total response
|
Assessment
|
Expectations
|
|
Better
|
Worsen
|
No change
|
Net response
|
Better
|
Worsen
|
No change
|
Net response
|
|
Q3:2022-23
|
1,356
|
37.7
|
17.4
|
44.9
|
20.3
|
63.8
|
4.4
|
31.7
|
59.4
|
|
Q4:2022-23
|
1,066
|
45.9
|
11.4
|
42.7
|
34.4
|
66.9
|
3.7
|
29.4
|
63.1
|
|
Q1:2023-24
|
1,247
|
39.9
|
15.0
|
45.1
|
24.9
|
62.4
|
4.0
|
33.6
|
58.3
|
|
Q2:2023-24
|
1,223
|
46.0
|
11.8
|
42.2
|
34.3
|
65.0
|
4.3
|
30.7
|
60.7
|
|
Q3:2023-24
|
1,040
|
40.6
|
12.0
|
47.4
|
28.6
|
73.1
|
5.2
|
21.7
|
67.9
|
|
Q4:2023-24
|
|
|
|
|
|
62.5
|
4.2
|
33.3
|
58.3
|
|
‘Better’ Overall Business Situation is optimistic.
|
|
Table 23: Business Sentiments
|
|
Quarter
|
Business Assessment Index (BAI)
|
Business Expectations Index (BEI)
|
|
Q3:2022-23
|
108.6
|
134.4
|
|
Q4:2022-23
|
112.2
|
132.9
|
|
Q1:2023-24
|
112.2
|
126.4
|
|
Q2:2023-24
|
115.0
|
132.5
|
|
Q3:2023-24
|
113.9
|
135.4
|
|
Q4:2023-24
|
|
130.3
|
|
 IST,
IST,