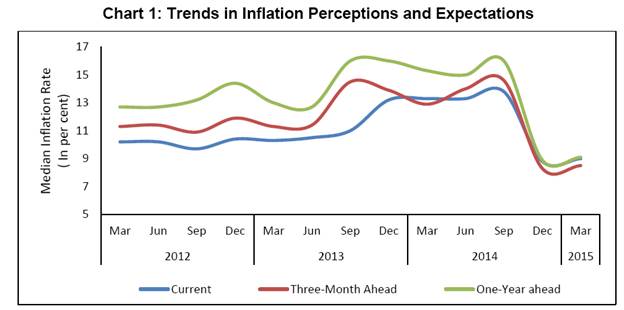
Inflation Expectations Survey of Households: March 2015
The Inflation Expectations Survey of Households for March 2015 (39th round) captures the inflation expectations of 4,996 urban households across 16 cities, for the next three-month period and the next one-year period. These expectations are based on their individual consumption baskets and hence these rates should not be considered as benchmark of official measure of inflation. The households’ inflation expectations provide useful directional information on near-term inflationary pressures and also supplement other economic indicators.
Highlights:
Qualitative response from survey suggests that percentage respondents expecting general prices to rise by ‘more than current rate’ (i.e., respondents expect higher inflation) during the next three months and next one year have marginally increased. Inflation expectations were slightly higher across various product groups for both the horizons.
A similar pattern is witnessed in terms of quantitative responses. However, the current inflation perceptions, and inflation expectations on an average (both three-month ahead as well as one-year ahead) remained at single digit in current round (Chart1).
The survey shows that retired persons and housewives have comparatively higher level of inflation expectations for three-month ahead period based on median inflation rates. Respondents from Guwahati, Kolhapur, Nagpur, Patna and Lucknow cities expect relatively higher inflation for next three months.
Table 1: Respondents’ Profile (Category): Share in Total Sample
Category of Respondents
Share in Total (%)
Target Share (%)
Financial Sector Employees
9.7
10.0
Other Employees
15.9
15.0
Self-employed
20.3
20.0
Housewives
29.3
30.0
Retired Persons
9.8
10.0
Daily Workers
9.9
10.0
Others
5.0
5.0
Note: The above sample proportion is for the round ended March 2015 survey.
Table 2: Product-wise Expectations of Prices for Three-month ahead and One-year ahead
(Percentage of respondents)
Round No./survey period
35
36
37
38
39
35
36
37
38
39
(Round ended) →
Mar-14
Jun-14
Sep-14
Dec-14
Mar-15
Mar-14
Jun-14
Sep-14
Dec-14
Mar-15
Options: General
Three-month ahead
One-year ahead
Prices will increase
89.2
77.5
86.4
72.4
73.6
94.1
83.6
90.0
79.8
82.2
Price increase more than current rate
51.2
41.2
43.9
25.7
28.3
59.0
47.4
48.0
32.1
32.9
Price increase similar to current rate
28.4
21.5
28.8
27.0
24.0
25.7
22.0
27.4
29.9
28.8
Price increase less than current rate
9.6
14.8
13.7
19.8
21.2
9.3
14.2
14.6
17.8
20.6
No change in prices
8.3
12.7
9.0
16.5
15.4
3.5
7.4
5.5
11.2
10.0
Decline in price
2.5
9.8
4.6
11.0
11.1
2.4
9.0
4.5
9.0
7.8
Options: Food Product
Three-month ahead
One-year ahead
Prices will increase
88.6
77.2
85.9
72.3
74.4
93.8
82.8
89.5
79.9
82.4
Price increase more than current rate
51.9
42.3
41.9
25.2
27.9
57.6
47.0
46.2
30.7
32.0
Price increase similar to current rate
26.3
21.5
28.1
28.5
25.2
26.3
21.3
27.7
30.5
29.2
Price increase less than current rate
10.4
13.4
15.8
18.5
21.3
9.9
14.5
15.5
18.7
21.1
No change in prices
8.7
13.9
9.0
17.1
15.0
4.0
7.9
5.8
11.3
9.9
Decline in price
2.7
8.9
5.1
10.6
10.6
2.2
9.3
4.7
8.9
7.7
Options: Non-Food Product
Three-month ahead
One-year ahead
Prices will increase
80.6
73.1
78.5
65.1
64.2
87.5
79.5
83.8
75.1
76.0
Price increase more than current rate
42.5
37.3
34.7
21.2
21.7
48.1
42
36.3
26.1
25.8
Price increase similar to current rate
27.2
21.7
27.2
26.1
24.0
28.5
22.3
29.0
30.6
28.4
Price increase less than current rate
10.8
14.1
16.5
17.8
18.5
10.8
15.3
18.4
18.4
21.7
No change in prices
16.5
18.9
17.4
25.6
24.6
9.7
12.7
12.1
16.6
16.3
Decline in price
3.0
8.0
4.2
9.3
11.2
2.9
7.8
4.1
8.3
7.7
Options: Household Durables
Three-month ahead
One-year ahead
Prices will increase
70.5
68.9
64.0
59.7
68.2
81.5
76.9
76.8
72.1
77.6
Price increase more than current rate
35.4
35.3
27.2
20.4
25.4
44.2
42.1
33.9
27.5
29.2
Price increase similar to current rate
23.1
20.0
22.7
23.8
24.4
25.6
20.7
26.1
27.8
29.2
Price increase less than current rate
12.0
13.6
14.1
15.6
18.4
11.7
14.1
16.9
16.8
19.2
No change in prices
21.1
20.9
24.3
27.3
21.6
12.4
13.9
15.0
16.5
15.5
Decline in price
8.4
10.2
11.7
13.0
10.2
6.0
9.2
8.2
11.4
6.9
Options: Housing Prices
Three-month ahead
One-year ahead
Prices will increase
85.5
82.2
84.6
78.4
83.2
91.6
87.2
91.5
86.1
90.3
Price increase more than current rate
58.0
55.4
55.5
39.5
46.7
66.2
59.7
60.8
47.9
53.1
Price increase similar to current rate
21.1
17.0
20.3
24.9
21.5
19.2
17.8
22.5
25.6
23.0
Price increase less than current rate
6.4
9.8
8.8
13.9
14.9
6.3
9.7
8.2
12.6
14.2
No change in prices
10.2
11.1
11.4
13.7
11.8
4.4
6.0
5.0
6.6
5.4
Decline in price
4.4
6.7
4.0
7.9
5.0
4.0
6.8
3.5
7.3
4.4
Options: Cost of Services
Three month ahead
One-year ahead
Prices will increase
83.1
78.5
79.1
71.6
78.5
90.4
84.9
87.5
81.8
86.9
Price increase more than current rate
48.0
46.4
38.8
28.4
32.7
54.8
50.6
45.4
34.7
37.6
Price increase similar to current rate
26.5
19.4
25.3
26.6
25.7
25.4
20.7
26.9
30.0
29.5
Price increase less than current rate
8.7
12.6
15.0
16.6
20.0
10.2
13.6
15.2
17.2
19.9
No change in prices
14.5
16.2
18.0
21.7
17.9
7.2
9.3
9.8
11.6
9.7
Decline in price
2.4
5.3
2.9
6.7
3.6
2.4
5.8
2.8
6.6
3.3
Table 3: Households Expecting General Price Movements in Coherence with Movements in Price Expectations of Various Product Groups: Three-month ahead and One-year ahead
Table 5: Factors that Explain the Total Variability
Round No.
Survey period ended
Current
Three-month ahead
One-year ahead
35
Mar-14
City, Category, Gender, Age-group
City, Category, Gender
36
Jun-14
City
City
City
37
Sep-14
City, Age-Group
City, Age-Group
City
38
Dec-14
City, Category
City, Category
City, Category
39
Mar-15
City
City
City
Note: Results based on exercise using Analysis of Variance.
Table 6 : Various Group-wise Inflation Expectations for March 2015 Survey Round
Current
Three-month Ahead
One-year Ahead
Mean
Median
Std. Dev.
Mean
Median
Std. Dev.
Mean
Median
Std. Dev.
Gender-wise
Male
9.0
8.9
4.0
8.9
8.4
4.3
9.5
9.1
4.5
Female
9.1
9.1
4.1
9.1
8.6
4.3
9.7
9.2
4.5
Financial Sector Employees
9.0
9.1
4.0
9.0
8.4
4.3
9.7
9.3
4.5
Other Employees
9.0
8.9
4.0
8.8
8.2
4.2
9.2
8.7
4.5
Self Employed
9.0
8.8
3.9
8.8
8.3
4.2
9.3
9.0
4.5
Housewives
9.1
9.1
4.1
9.1
8.7
4.3
9.6
9.2
4.5
Retired Persons
9.4
9.2
4.2
9.3
9.0
4.5
10.1
9.8
4.5
Daily Workers
9.0
8.8
4.1
9.0
8.4
4.3
9.8
9.3
4.5
Other category
8.8
8.0
3.8
8.6
8.1
4.3
9.3
8.7
4.5
Up to 25 years
8.7
8.5
3.9
8.8
8.3
4.3
9.3
8.7
4.5
25 to 30 years
9.0
8.9
3.9
9.0
8.3
4.1
9.4
9.0
4.6
30 to 35 years
9.0
9.0
3.9
8.8
8.5
4.1
9.4
9.1
4.5
35 to 40 years
9.0
8.8
4.0
8.9
8.2
4.3
9.3
8.9
4.5
40 to 45 years
9.2
9.1
4.1
9.0
8.5
4.3
10.1
9.5
4.4
45 to 50 years
9.5
9.3
4.3
9.2
8.7
4.5
10.0
9.6
4.6
50 to 55 years
9.4
9.2
3.9
9.2
8.8
4.1
9.8
9.4
4.5
55 to 60 years
9.2
9.1
4.2
9.1
8.5
4.5
9.6
9.1
4.6
60 years and above
9.2
9.1
4.1
9.1
8.9
4.5
9.9
9.6
4.5
Ahmadabad
8.0
6.9
4.2
8.4
7.4
4.3
9.3
8.4
4.5
Bengaluru
6.5
5.3
3.5
7.9
7.3
3.8
7.9
7.1
3.7
Bhopal
8.7
9.1
2.7
9.7
9.7
3.7
10.5
10.0
3.9
Bhubaneswar
9.0
9.3
2.8
8.6
8.3
3.6
8.7
8.4
3.8
Chennai
9.2
8.6
3.6
8.8
7.7
3.9
9.3
8.2
4.3
Delhi
6.9
5.4
4.1
6.9
5.3
4.4
6.7
4.8
4.8
Guwahati
10.7
9.9
4.9
11.1
11.0
5.0
10.9
10.5
5.1
Hyderabad
9.8
9.5
4.1
8.7
8.5
4.1
10.0
8.9
4.9
Jaipur
8.3
8.0
3.5
9.1
8.6
4.1
9.5
9.2
4.3
Kolhapur
12.2
11.6
3.8
11.4
10.4
4.5
12.3
11.8
3.8
Kolkata
11.1
10.4
4.5
9.8
9.8
4.7
11.5
11.1
4.5
Lucknow
8.3
7.9
3.7
10.0
10.1
3.8
10.1
9.6
3.8
Mumbai
8.0
8.0
2.8
7.8
7.9
3.1
7.6
7.2
3.1
Nagpur
11.4
11.3
4.1
10.7
10.3
4.7
11.5
11.8
4.7
Patna
8.8
9.2
2.1
9.8
10.2
2.6
10.6
10.6
2.9
Thiruvananthapuram
8.9
8.1
3.9
7.0
5.4
4.3
9.9
9.5
4.8
All
9.1
9.0
4.0
9.0
8.5
4.3
9.6
9.1
4.5
Table 7: Cross-tabulation of Current and Three-month Ahead Inflation Expectations
(Number of respondents)
Three-month ahead inflation rate (per cent)
Current inflation rate (per cent)
<1
1-2
2-3
3-4
4-5
5-6
6-7
7-8
8-9
9-10
10-11
11-12
12-13
13-14
14-15
15-16
>=16
No idea
Total
<1
3
2
2
4
1
1
3
2
1
3
2
24
1-2
2
10
9
8
4
1
1
5
40
2-3
15
20
37
14
4
3
1
1
1
1
2
12
111
3-4
2
52
36
35
13
4
1
3
1
15
162
4-5
4
14
16
147
144
66
62
29
28
21
4
1
1
3
4
22
566
5-6
4
6
7
14
97
99
66
55
19
7
14
4
3
4
4
12
415
6-7
4
4
3
23
16
173
46
40
23
7
8
2
2
3
3
5
362
7-8
6
9
11
12
36
34
154
101
61
47
11
7
1
3
1
9
503
8-9
8
3
5
4
5
3
3
152
41
28
25
7
4
3
2
1
8
7
309
9-10
2
1
11
7
1
22
235
173
123
88
32
10
56
4
33
25
823
10-11
1
1
3
4
27
10
1
4
34
90
132
57
37
6
11
20
31
12
481
11-12
1
2
17
1
1
34
4
18
33
33
23
8
17
5
17
1
215
12-13
1
1
1
14
7
11
5
2
5
5
52
13-14
2
1
1
1
5
11
5
1
3
30
14-15
3
3
1
6
7
4
10
2
4
29
31
15
60
11
186
15-16
1
2
1
1
4
1
4
2
12
1
3
1
24
59
54
3
173
>=16
4
7
6
2
13
3
2
1
25
19
39
3
3
16
5
365
31
544
Total
43
79
135
290
430
417
345
454
455
444
378
262
114
84
179
118
592
177
4996
Note: The shaded cells represent the number of respondents who expressed double digit current and three-month ahead inflation.
Table 8: Cross-tabulation of Current and One-year Ahead Inflation Expectations
(Number of respondents)
One-year ahead inflation rate ( per cent)
Current inflation rate (per cent)
<1
1-2
2-3
3-4
4-5
5-6
6-7
7-8
8-9
9-10
10-11
11-12
12-13
13-14
14-15
15-16
>=16
No idea
Total
<1
1
3
2
1
5
1
1
10
24
1-2
6
10
7
5
7
1
2
1
1
40
2-3
15
35
9
20
6
1
3
5
6
4
1
6
111
3-4
2
6
30
31
13
15
16
13
15
4
2
3
1
5
6
162
4-5
4
9
121
135
36
42
94
15
40
6
6
2
6
4
6
40
566
5-6
3
6
5
61
89
43
84
21
21
31
4
3
1
5
4
10
24
415
6-7
2
5
31
5
94
63
38
14
17
10
4
3
5
5
52
14
362
7-8
1
21
16
34
31
20
129
96
22
35
19
11
3
2
5
7
36
15
503
8-9
5
9
19
16
10
5
39
57
52
21
17
4
5
4
10
4
23
9
309
9-10
1
1
6
3
62
14
6
11
132
268
71
46
20
19
61
23
53
26
823
10-11
2
4
3
4
11
6
8
21
9
66
161
32
21
10
19
33
28
43
481
11-12
1
3
5
2
10
10
1
6
33
75
6
5
16
11
21
10
215
12-13
1
1
4
1
2
8
18
1
3
8
5
52
13-14
2
1
1
6
10
5
1
1
3
30
14-15
2
1
5
2
2
4
5
14
1
1
26
58
29
32
4
186
15-16
1
1
1
1
5
2
1
1
1
1
1
4
28
67
53
5
173
>=16
10
1
1
4
5
17
5
11
3
4
4
1
11
14
428
25
544
Total
34
78
139
262
368
294
373
456
301
504
372
199
93
83
233
211
755
241
4996
Note: The shaded cells represent the number of respondents who expressed double digit current and one-year ahead inflation.
1 The previous round of the survey data was published on January 15, 2015 on RBI website. The survey results are based on views of the respondents which are not necessarily shared by the Reserve Bank of India.
RbiTtsCommonUtility
PLAYING
LISTEN
LOADING...
0:062:49
Related Assets
RBI-Install-RBI-Content-Global
RbiSocialMediaUtility
Share this page:
Install the RBI mobile application and get quick access to the latest news!
RbiWasItHelpfulUtility
Was this page helpful?Thanks!
Would like to give more details?
Thank you for your feedback!Thank you for your feedback!