 IST,
IST,
IV. Monetary and Liquidity Conditions
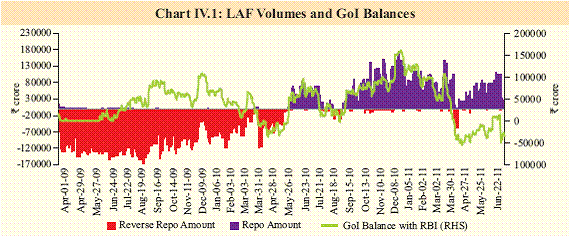
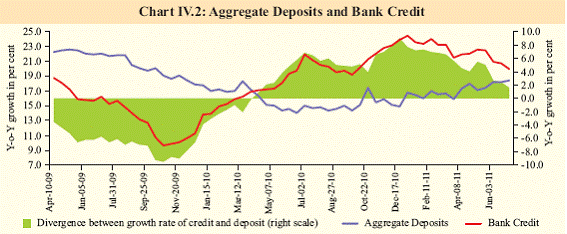
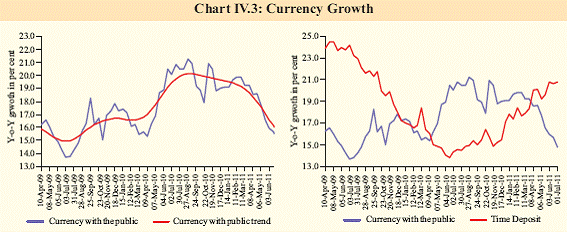
Liquidity conditions eased further during Q1 of 2011-12 while remaining in deficit mode. This brought about an adjustment in liquidity in line with the policy objective. The easing reflected mainly structural factors, as the divergent trend between credit growth and deposit growth narrowed with rising interest rates. The sharp rise in currency growth observed during 2010- 11 was also reversed as the opportunity cost of holding currency increased with rise in deposit rates. Following the pick-up in the deposit growth, the money supply growth remained above the indicative trajectory. Though credit growth moderated, partly reflecting base effect, it is still above the indicative trajectory. Monetary conditions remain tight in line with policy stance IV.1 Monetary conditions remained tight during Q1 of 2011-12 with interest rates firming, deposit growth picking up and credit growth decelerating. The Reserve Bank persisted with its anti-inflationary monetary policy stance during Q1 of 2011-12. As inflation became increasingly generalised, the Reserve Bank raised policy repo rate by 50 bps in May, followed by another 25 bps in June. The Reserve Bank has thus raised the reverse repo rate, repo rate and the CRR by 325 basis points (bps), 275 bps and 25 bps respectively since March 2010. Following a shift from absorption mode to injection mode in the liquidity adjustment facility (LAF), there has been, in effect, a rise in policy rates by 425 bps since February 2010 till date as the money market rate started hovering around the upper bound from the lower bound of the LAF corridor (Table IV.1). IV.2 Based on the recommendations of the
Working Group on Operating Procedures of
Monetary Policy (Chairman: Shri Deepak Liquidity conditions continue to be in deficit mode IV.3 Liquidity conditions eased significantly during Q1 of 2011-12. The average availment of liquidity under LAF was lower at around ` 49,300 crore in Q1 of 2011-12 as compared with around ` 84,400 crore in Q4 of 2010-11. The easing was mainly on account of sharp drawdown in Government’s cash balances with the Reserve Bank. With the Government transiting to Ways and Means Advances/ Overdraft in early April, reflecting, inter alia, tax refunds, the liquidity conditions were in absorption mode for a brief period in early April 2011. As part of their usual year-end balance sheet adjustments, banks maintained higher cash reserves with the Reserve Bank, which following their unloading, also had an easing effect on liquidity conditions in early April 2011.
IV.4 Liquidity conditions reverted to the deficit mode in the second week of April 2011. Seasonally, the month of April has mostly seen surplus liquidity in terms of the net absorption under LAF, reflecting lower credit demand and Government’s cash draw-down. This year turned out to be contrarian in that April experienced liquidity deficit on an average daily basis (around ` 19,000 crore, albeit, lower than that of ` 81,000 crore in March 2011) (Chart IV.1). The deficit liquidity conditions were in line with stated policy objective of the Reserve Bank. With the Government substituting WMA by issuances of cash management bills (CMBs) and additional borrowing through Treasury Bills from the market, the average daily net liquidity injection under the LAF increased to around ` 55,000 crore in May 2011.
IV.5 Even as liquidity was in the surplus mode during early April 2011, the Reserve Bank had anticipated reversal in liquidity conditions based on its liquidity assessment for the subsequent period. Accordingly on April 8, 2011, the Reserve Bank had pre-emptively extended the additional liquidity support to SCBs under the LAF to the extent of up to one per cent of their NDTL till May 6, 2011. Moreover, the second LAF (SLAF) on a daily basis was also extended up to May 6, 2011. Following the introduction of MSF on May 9, 2011, where banks can submit their bids during 15.30 - 16.30 hrs, the second LAF was discontinued. Further, under the MSF scheme, banks need not seek a specific waiver for default in SLR compliance arising out of use of this facility. Till date the maximum availment of liquidity under MSF has been ` 4,105 crore IV.6 Liquidity in the banking system remained in deficit mode in June as Government balances increased reflecting quarterly advance tax outflows (Table IV.2). The average daily net outstanding liquidity injection was around ` 74,000 crore in June 2011. Liquidity conditions eased in early July reflecting drawdown of Government cash balances including, inter alia, redemption of a security amounting to around ` 37,000 crore on July 2, 2011. The average daily net liquidity injection is placed at around ` 41,000 crore during July 1 to 22, 2011.
Structural drivers ease pressure on liquidity IV.7 During the third quarter of 2010-11, the deficit liquidity conditions were driven by structural as well as frictional factors. The structural factors included a sharp rise in currency demand and divergent trends in credit and deposit growth, while the frictional factors included maintenance of surplus cash balances by the Government with the Reserve Bank (Table IV.3). During Q4 of 2010-11, the liquidity conditions eased marginally due to pick-up in government spending, staggered OMOs carried out by the Reserve Bank and narrowing divergence between credit growth and deposit growth. The currency growth, however, continued to be strong. In contrast, the deficit liquidity conditions during the first quarter of 2011-12 were largely driven by frictional factors, i.e., Government’s cash balance with the Reserve Bank. The structural drivers of liquidity responded to the monetary policy signals, thereby alleviating the pressure on liquidity.
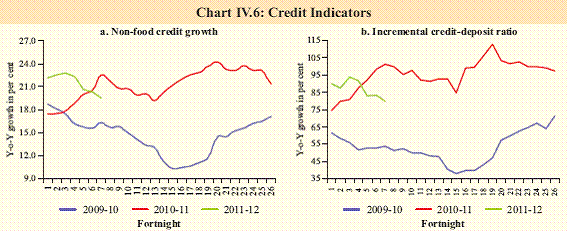
Narrowing divergence between credit
growth and deposit growth
Currency growth moderates as opportunity cost of holding currency increases IV.9 Currency growth, which had witnessed significant acceleration and remained above trend for most part of 2010-11, decelerated below the trend during the first quarter of 2011- 12 (Chart IV.3). The currency growth was strong during 2010-11 mainly on account of stronger GDP growth and persistent high inflation. In addition, as deposit interest rates were low, the opportunity cost of holding currency was also low for most part of the year. The cumulative rise in the deposit rates, however, progressively raised the opportunity cost of holding idle currency; accordingly, a switch from currency holdings and demand deposits to time deposits ensued. The moderation in economic activity and correction in asset markets further aided this phenomenon.
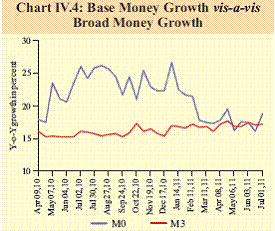
Reserve money growth moderates IV.10 During the first three quarters of 2010- 11, reserve money growth was high reflecting the injection of primary liquidity by the Reserve Bank in response to the tight liquidity conditions. The injection of primary liquidity was mainly through repo operations under the LAF and open market purchases. Reserve money growth also reflected the increase in CRR. During the same period however, growth in money supply was restrained due to sharp moderation in the growth of aggregate deposits as a response to low deposit rates in an environment of high inflation. IV.11 Liquidity conditions eased during Q1 of 2011-12 as reflected in the lower average availment of LAF window by banks. No primary liquidity was added by way of the Reserve Bank’s forex management. The slowdown in the injection of primary liquidity by the Reserve Bank has resulted in a deceleration in reserve money growth since the peak attained in end- December 2010 (Chart IV.4).
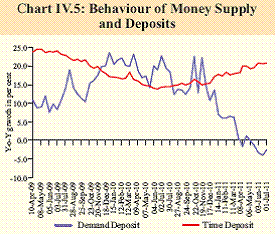
Money supply growth remains above projection IV.12 Even though reserve money growth decelerated, broad money growth increased faster in Q1 of 2011-12 as deposit growth picked-up. The broad money supply growth thus remains above the indicative trajectory of the Reserve Bank (Table IV.4). Time deposits, which account for nearly 88 per cent of aggregate deposits, have especially witnessed a strong growth as interest rates increased sharply in response to the deficit liquidity conditions coupled with steady increase in policy rates. Demand deposits declined on a year-on-year basis as the opportunity cost of holding money in low interest bearing deposits increased (Chart IV.5).
Credit growth stays above indicative
trajectory
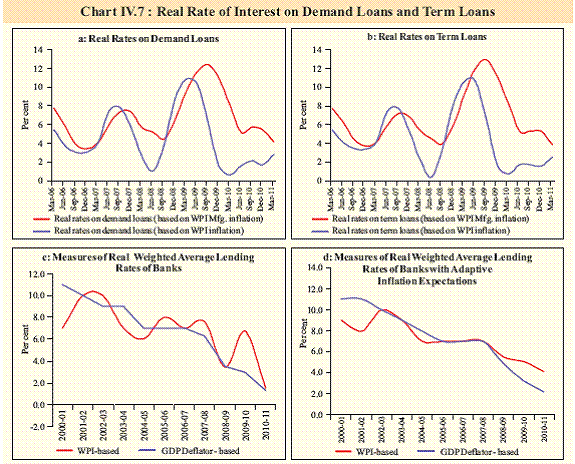
Real rates remain positive IV.14 With the recent acceleration in inflation, some real interest rates, measured ex post, by subtracting current inflation from the nominal interest rates are negative, giving an impression that the policy stance is not contractionary enough. The policy repo rate at 7.5 per cent seen against the current headline inflation rate of 9.4 per cent is negative. However, an appropriate way of calculation of real policy rates is by using expected inflation rate for calculations. The Reserve Bank has projected 6.0 per cent inflation rate by the end of 2011-12. Ex-ante, on this basis, the real rate is positive at the current level. However, what is important is the level of real lending rate which continues to remain positive in the various alternative ways of calculation (Chart IV.7). Taking a two-year moving average series of headline inflation rate to represent adaptive inflation expectations, the smoothened real lending rate series reinforces the observation that real interest rates remain positive. Credit expansion shows a differential trend IV.16 The year-on-year flow of credit continued to register high growth to industrial, services and personal loans sectors (Table IV.6). Credit to industry was led by sectors such as mining and quarrying, infrastructure, food processing and basic metal and metal products. While bank credit to NBFC sector continues to accelerate sharply, the sharp rise in credit to infrastructure sector is also noteworthy as it is on a high base.
IV.17 Even though banks continued to be the dominant source of finance to the commercial sector, non-bank sources also contributed significantly to the credit requirements of the economy during Q1 of 2011-12 (Table IV.7). The share of non-bank sources to total flow of financial resources increased from about 36 per cent in April-June 2010-11 to 49 per cent in April-June 2011-12, with both domestic and foreign funding increasing. Within domestic sources, net issuance under CPs and NBFC-NDSI, LIC and housing finance companies (HFCs) increased. The resource flow from external sources went up on account of higher mobilisation through foreign direct investment and external commercial borrowings. Tight monetary conditions likely to prevail IV.18 The Reserve Bank has been pursuing an anti-inflationary monetary policy stance since October 2009, with a view to containing inflation and anchoring inflationary expectations. The steady rise in policy rates was reflected in increase in borrowing as well as lending interest rates. As a result, reserve money creation has been restrained. This may keep monetary conditions tight in near term. Credit and money supply growth may decelerate further and help in sustaining monetary transmission. |
||||||||||||||||||||||||||||||||||||||||||||||||||||||||||||||||||||||||||||||||||||||||||||||||||||||||||||||||||||||||||||||||||||||||||||||||||||||||||||||||||||||||||||||||||||||||||||||||||||||||||||||||||||||||||||||||||||||||||||||||||||||||||||||||||||||||||||||||||||||||||||||||||||||||||||||||||||||||||||||||||||||||||||||||||||||||||||||||||||||||||||||||||||||||||||||||||||||||||||||||||||||||||||||||||||||||||||||||||||||||||||||||||||||||||||||||||||||||||||||||||||||||||||||||||||||||||||||||||||||||||||||||||||||||||||||||||||||||||||||||||||||||||||||||||||||||||||||||||||||||||||||||||||||||||
Page Last Updated on:


