 IST,
IST,


IV. Monetary Conditions
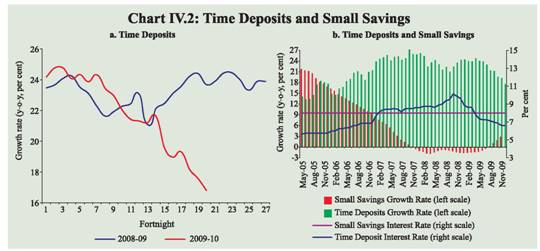
Reflecting the accommodative monetary policy stance of the Reserve Bank, monetary and liquidity conditions have remained supportive of growth during 2009-10. The key driver of growth in reserve money during Q3 of 2009-10 was the significant increment in net Reserve Bank credit to the Centre. Broad money growth, particularly since Q3 of 2009-10, has exhibited gradual moderation, primarily because of deceleration in growth of bank credit to both the private sector as well as the Government. There has, however, been a reversal in the decelerating trend of credit to the commercial sector since November 2009. The flow of financial resources from the non-banking sources to the commercial sector also exhibited significant increase during April-January 2009-10. IV.1 The Reserve Bank’s accommodative monetary policy stance in 2009-10 to date, has conditioned the overall monetary and liquidity trends, consistent with the need to support revival of economic growth while ensuring successful completion of the Government’s borrowing programme without exerting major pressures on the overall interest rate structure in the system. Broad money growth (year-on-year) witnessed some moderation during the third quarter of 2009-10 and remained close to the Reserve Bank’s projected indicative trajectory of 17.0 per cent growth for 2009-10, as set out in the Second Quarter Review of Monetary Policy for 2009-10. As on January 15, 2010 growth in broad money (y-o-y) was at 16.5 per cent as against 19.1 per cent a year ago. The moderation in M3 growth since the third quarter has been driven by deceleration in bank credit to the commercial sector as well as to the Government on the sources side of money and by a slowdown in the growth of deposits on the components side. For the year as a whole, however, the banking system’s credit to the Government has been the major driver of growth in broad money, a trend which has persisted since the third quarter of 2008-09 in response to the increase in Government’s borrowing programme to finance the expansionary fiscal response to the economic slowdown. IV.2 During the third quarter of 2009-10, the reserve money growth pattern changed, exhibiting a reversal in the decelerating trend that had set in since October 2008. On the sources side of reserve money, the increase has been driven by the significant expansion of net Reserve Bank credit to the Centre, on account of decline in reverse repo operations under the Liquidity Adjustment Facility (LAF), which was partially offset by increase in cash balances of the Government with the Reserve Bank. On the components side of reserve money, there was a significant increase in currency in circulation, consistent with the seasonal demand pattern for currency in Q3, as witnessed in previous years. During the year so far, unwinding of MSS balances has been the prime channel for expansion in net Reserve Bank credit to the Centre. IV.3 There was a deceleration in the flow of credit to the commercial sector beginning in November 2008. With a rebound in economic growth in the second quarter of 2009-10, strong manufacturing sector growth and signs of pick-up in private consumption demand, the decelerating trend in credit growth has shown a reversal since November 2009. The flow of financial resources from non-banking sources increased significantly during April-January 2009-10, partially offsetting the impact of deceleration in credit growth, and thereby helping in financing of economic activities as well as the robust recovery in industrial production since June 2009. Monetary Survey IV.4 On a year-on-year (y-o-y) basis, M3 growth was 16.5 per cent on January 15, 2010 as compared with 19.1 per cent a year ago. The growth in M3 was primarily in line with the expansion in aggregate deposits during this period (Table 4.1 and Chart IV.1). Within aggregate deposits, time deposits registered a growth (y-o-y) of 16.0 per cent as on January 15, 2010, as compared with 23.1 per cent a year ago (Chart IV.2a). In 2009-10, there has been a gradual deceleration in the growth of time deposits, with softening of interest rates, in contrast to the shift from demand to time deposits during the second half of 2008-09. On the other hand, demand deposits expanded by 19.8 per cent (y-o-y) as on January 15, 2010, as compared with a decline of 0.8 per cent a year ago. There were net outflows from small savings schemes between December 2007 and July 2009; moderate inflows have, however, been recorded during August-November 2009 (the latest period for which the data are available) (Chart IV.2b). Growth in currency with the public at 17.3 per cent (y-o-y) as on January 15, 2010 remained almost same as a year ago.
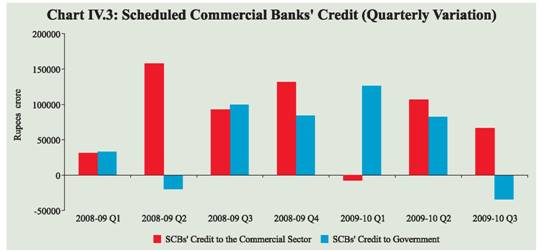
IV.5 On a financial year basis, growth in M3 during 2009-10 (up to January 15, 2010) was 10.8 per cent as compared with 12.8 per cent during the corresponding period of the previous year (Table 4.2). IV.6 A quarter-wise analysis of bank credit reveals that there was continuation of expansion in bank credit to the commercial sector in the third quarter of 2009-10, as against the absolute decline in the first quarter, although the absolute increment in credit was much lower than in the second quarter and in the corresponding quarter of the previous year (Chart IV.3). Banks’ credit to the Government decreased in absolute terms during the third quarter due to the decline in the securities held by them under the LAF operations. The deceleration in commercial banks’ credit to the Government since Q3 of 2009-10 has to be seen in the context of the high base in the second half of 2008-09 when the Government borrowing programme increased significantly to deliver the fiscal stimulus as well as completion of a greater part of the borrowing programme for 2009-10 in the first half.
IV.7 Non-food credit growth (y-o-y) of scheduled commercial banks (SCBs) decelerated over twelve months following the peak reached in October 2008, which could be partly explained by the availability of alternate non-banking sources of funding, including internal resources of corporates, besides the impact of the economic slowdown on credit from the demand side. Non-food credit growth has shown a reversal in trend since November 2009 increasing from 10.3 per cent (y-o-y) as on November 6, 2009 to 14.4 per cent as on January 15, 2010; the Reserve Bank’s current indicative projection is 18.0 per cent for 2009-10. With the pick-up seen in credit growth in the last few fortnights, the persistent decline in the incremental credit-deposit ratio in 2009-10 has also reversed (Chart IV.4). IV.8 While there has been deceleration in credit growth of the banking sector as a whole, credit flow from foreign banks registered a decline (Table 4.3). The expansion of credit from the public sector banks, which had held up till the first quarter of 2009-10, witnessed deceleration in the following two quarters. IV.9 The high growth in deposits and weak demand for credit from the private sector led to an increase in SCBs’ investment in SLR securities by 21.1 per cent (y-o-y) as on January 15, 2010 as compared with 19.5 per cent a year ago. Commercial banks’ holdings of such securities as on January 15, 2010 at 29.9 per cent of their net demand and time liabilities (NDTL) were higher than 28.1 per cent at end-March 2009 and 28.8 per cent a year ago. Excess SLR investments of SCBs increased to Rs.2,26,720 crore as on January 15, 2010 from Rs. 1,69,846 crore at end-March 2009. Adjusted for LAF collateral securities on an outstanding basis, SCB’s holding of SLR securities amounted to 28.2 per cent of NDTL as on January 15, 2010. Simultaneously, SCBs have reduced their overseas foreign currency borrowings (Table 4.4). 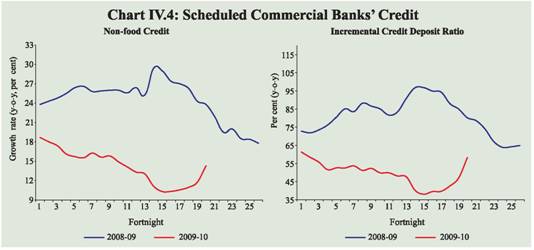
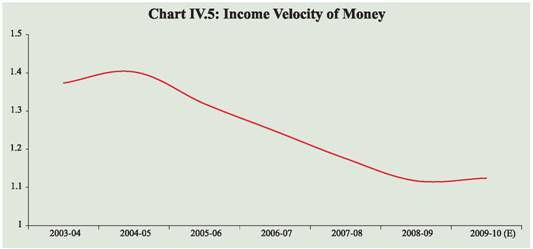
IV.10 There has been a significant turnaround in economic growth, increase in inflation and moderation in interest rates, during 2009-10. With such high variability in growth, inflation and interest rates during the year, money growth would need to be assessed in conjunction with the recent trend of income velocity of money (Chart IV.5). With receding uncertainty, the velocity could be expected to have increased, explaining partly the modest deceleration in money supply, consistent with the overall macroeconomic developments. The key factor behind moderation in money growth, though, has been the deceleration in credit growth to the private sector. IV.11 Disaggregated data on sectoral deployment of gross bank credit available up to November 20, 2009 show that credit flow to agriculture remained strong despite deficient monsoon-related weak economic activity, while credit to other sectors significantly decelerated. In terms of flow of incremental credit, 56.1 per cent of incremental non-food credit (y-o-y) was absorbed by industry and 23.7 per cent by the agricultural sector (as against 50.7 per cent and 9.3 per cent, respectively, in the corresponding period of the previous year). The expansion of incremental nonfood credit to the industry during this period was led by infrastructure and iron and steel industries. Personal loans witnessed deceleration in flow of credit; within the category, housing loans also witnessed moderation (Table 4.5). IV.12 Apart from banks, the commercial sector mobilised resources from a variety of other sources, such as the capital market, commercial papers (CPs), American Depository Receipts (ADRs)/Global Depository Receipts (GDRs) and foreign direct investment (FDI). During the first ten months of 2009-10, flow of resources from external sources increased as compared with the corresponding period of the previous year, mainly reflecting large FDI inflows. Resources mobilised through domestic non-bank sources also recorded an increase during this period. The increased flow from non-bank sources notwithstanding, the reduced flow of bank credit, has led to a decrease in the total flow of financial resources to the commercial sector during April 2009-January 2010, compared to a year ago (Table 4.6).
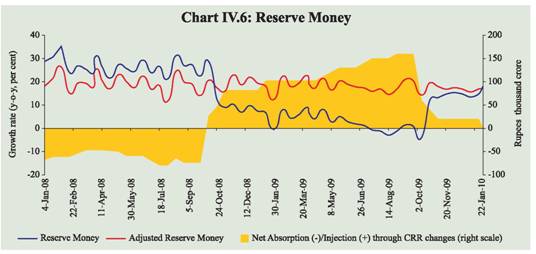
Reserve Money Survey IV.13 During the third quarter of 2009-10, growth in reserve money showed a reversal from the decelerating trend that was in place since October 2008. Reserve money registered a growth of 18.0 per cent, y-o-y, as on January 22, 2010 as compared with a growth of 4.2 per cent a year ago. On the components side, the increment in reserve money in the third quarter of 2009-10 was mainly driven by the expansion in currency in circulation, due to the seasonal demand arising from festive season. On the sources side, even though net foreign currency assets (adjusted for valuation) decreased during Q3 of 2009-10, liquidity management operations of the Reserve Bank led to increase in the Reserve Bank’s credit to the Centre. Significant decline in reverse repo balances were offset to an extent by the increase in Centre’s surplus with the Reserve Bank. Adjusted for the first round effect of the changes in CRR, reserve money growth (y-o-y) as on January 22, 2010 was 17.5 per cent which is comparable to 18.0 per cent a year ago. The CRR impact (in terms of injection of liquidity during policy-driven decline in CRR and absorption during increase in CRR) explains the difference between ‘reserve money’ and ‘adjusted reserve money’. Since the last change in CRR was effected in January 2009, the difference between the growth rates of reserve money and adjusted reserve money has tapered after the end of the one year cycle during which the difference persisted (Chart IV.6).
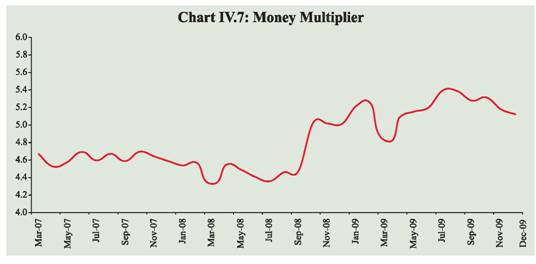
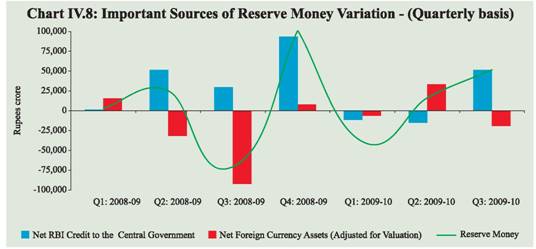
IV.14 The money multiplier increased from 4.3 at end-March 2008 to 4.8 at end-March 2009, on account of the 400 basis points reduction in CRR between October 2008 and January 2009. The multiplier has remained higher in 2009-10 so far, though not in an uninterrupted fashion, reaching 5.1 at end-December 2009 (Chart IV.7). IV.15 The financial year variations in reserve money during 2009-10 (up to January 22, 2010) show that reserve money increased by 4.2 per cent as against a decrease of 6.0 per cent in the corresponding period of the previous year (Table 4.7 and Chart IV.8). IV.16 Movements in the Reserve Bank’s net credit to the Central Government during the financial year (up to January 22, 2010) largely reflected the liquidity management operations of the Reserve Bank and changes in Central Government deposits with the Reserve Bank. With easy liquidity conditions prevailing since mid-November 2008, the Reserve Bank has been absorbing large amount of liquidity through reverse repo under the LAF. Accordingly, Reserve Bank’s holding of government securities (up to January 22, 2010) declined on account of an increase in absorption under the LAF (by Rs.68,845 crore). The Centre’s surplus cash balances with the Reserve Bank also increased (by Rs.51,220 crore). On the other hand, unwinding of MSS securities (by Rs.80,340 crore) led to a decline in Central Government deposits with the Reserve Bank and, therefore increased net Reserve Bank credit to the Centre. Furthermore, net open market purchases under OMO/special market operations (SMO) led to higher holding of Central Government securities/bonds (by Rs.75,477 crore) by the Reserve Bank. Reflecting the combined effect of these developments, the Reserve Bank’s net credit to the Centre increased during 2009-10 (up to January 22, 2010), which is lower than the increase during the corresponding period of the previous year.
IV.17 Overall, reflecting the accommodative monetary policy stance of the Reserve Bank, monetary and liquidity conditions have remained supportive of growth. Deposit growth on the components side and higher growth in banking system credit to the Government on the sources side have been the major drivers of growth in monetary aggregates during the year. Since the third quarter of 2009-10, there has been moderation in growth of credit to both the Government and the private sector, as a result of which broad money growth exhibited some deceleration. Deposit growth has also decelerated since the third quarter of 2009-10. Going forward, higher capital inflows and the revival in demand for credit from the private sector could influence the trajectory of growth in monetary conditions. |
|||||||||||||||||||||||||||||||||||||||||||||||||||||||||||||||||||||||||||||||||||||||||||||||||||||||||||||||||||||||||||||||||||||||||||||||||||||||||||||||||||||||||||||||||||||||||||||||||||||||||||||||||||||||||||||||||||||||||||||||||||||||||||||||||||||||||||||||||||||||||||||||||||||||||||||||||||||||||||||||||||||||||||||||||||||||||||||||||||||||||||||||||||||||||||||||||||||||||||||||||||||||||||||||||||||||||||||||||||||||||||||||||||||||||||||||||||||||||||||||||||||||||||||||||||||||||||||||||||||||||||||||||||||||||||||||||||||||||||||||||||||||||||||||||||||||||||||||||||||||||||||||||||||||||||||||||||||||||||||||||||||||||||||||||||||||||||||||||||||||||||||||||||||||||||||||||||||||||||||||||||||||||||||||||||||||||||||||||||||||||||||||||||||||||||||||||||||||||||||||||||||||||||||||||||||||||||||||||||||||||||||||||||||||||||||||||||||||||||||||||||||||||||||||||||||||||||||||||||||||||||||||||||||||||||||||||||||||||||||||||||||||||||||||||||||||||||||||||||||||

Share this page:


Install the RBI mobile application and get quick access to the latest news!
Scan the QR code to install our app


Page Last Updated on:


