 IST,
IST,
IV. Price Situation
Inflation Indicators
The upward drift imparted to inflation by three successive rounds of administered price revisions receded towards the close of 2000-01. By the end of February 2001, wholesale price inflation began to decline, partly reflecting base effects since the first two rounds of revisions in the administered items had been effected in February and March 2000 and partly, completion of the pass-through of administered price hikes into the general price level.
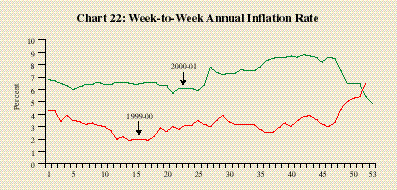
Headline inflation, measured by the variation in the Wholesale Price Index (WPI), on a point-to-point basis, ruled generally above 6 per cent throughout the year touching a peak of 8.8 per cent on January 13, 2001, as against 3.8 per cent in the corresponding week of 1999-2000. By the first week of March 2001, however, the headline inflation moderated to 6.5 per cent and fell sharply to 4.9 per cent by the end of March – the lowest during the year 2000-01 – as compared with 6.5 per cent in 1999-2000 (Chart 22).
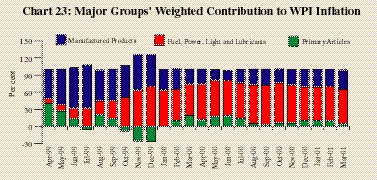
Among the major groups, manufacturing inflation increased by 3.3 per cent during 2000-01, on an average basis, comparable with 2.7 per cent a year ago, while primary articles inflation inched up to 3.0 per cent from 1.1 per cent. Fuel group inflation, on the other hand, shot up to 28.4 per cent from 9.0 per cent a year ago. The fuel group contributed the maximum to the price rise during 2000-01, with a share of 62.9 per cent as against 41.4 per cent in the preceding year, reflecting the impact of administered price hikes (Table 10). The share of the manufactured products group fell to 27.6 per cent from 49.9 per cent during 1999-2000. On the other hand, the weighted contribution of the primary articles group increased marginally to 10.0 per cent from 8.1 per cent in 1999-2000 (Chart 23).
(Per cent) | |||||||||||||||||||
Electricity | Kerosene | Urea-N- | Liquefied | Aviation | Diesel | Petrol | |||||||||||||
Content | Petroleum | Turbine | |||||||||||||||||
Gas (LPG) | Fuel | ||||||||||||||||||
(ATF) | |||||||||||||||||||
1 | 2 | 3 | 4 | 5 | 6 | 7 | 8 | ||||||||||||
February 2000 | 15.1 | | 14.0 | | | | | ||||||||||||
March 2000 | | 100.9 | | 30.2 | 18.2 | | | ||||||||||||
September 2000 | | 50.0 | | 19.0 | 20.0 | 19.0 | 10.0 | ||||||||||||
Core Inflation
In the recent period, the focus on core inflation among central banks as a guide for the conduct of monetary policy is expanding into a more broad based approach in which measures of core inflation are assessed in conjunction with other indicators of monetary and aggregate demand conditions. Typically, central banks invested with a mandate to independently pursue an inflation target have chosen to separate out exogenous influences on their inflation targets. Food and energy price changes are examples of such exogenous effects which do not normally reflect changes/shifts in domestic demand. The limited experience gained from dealing with issues relating to construction of core inflation measures, the loss of information content due to exclusion of certain commodity price effects and lack of public acceptance suggest that these measures are useful in indicating the underlying medium-term trends in the inflationary process under normal output conditions rather than as policy targets. Inflation targets, therefore, continue to be defined in terms of aggregate consumer price inflation in almost all economies.
The concept of core inflation is closely associated with the methodology adopted for its construction. One approach defines core inflation as the common element in the expected behaviour of different price indices. The more standard approach is to employ time series techniques - filters or smoothers, structural vector autoregressions - to separate transient elements from more permanent components of inflation. An alternative method is the stochastic or limited influence estimators which remove or reduce the weights of extreme price changes. The most common approach in this class of core inflation measures is the trimmed mean which excludes a proportion of each tail of the distribution of price changes to arrive at a central tendency which represents core inflation. The most widely used core inflation measures are based on the exclusion principle by which core inflation is derived by excluding prices of those commodities which are subject to seasonal supply shocks and/or administrative controls (Table 11).
Country | Price Index | Items Excluded | |||||||||||||||||
1 | 2 | 3 | |||||||||||||||||
Canada | CPI | Food, energy and first round effects of indirect | |||||||||||||||||
taxes with a weight of 26.3 per cent. | |||||||||||||||||||
France | CPI | Tax changes, energy, food and regulated | |||||||||||||||||
items. | |||||||||||||||||||
New Zealand | Weighted median | ||||||||||||||||||
CPI inflation rate | | ||||||||||||||||||
Portugal | CPI (exclusion) | Energy and non-processed food, with a weight | |||||||||||||||||
(first principal component) | of 21.9 per cent. | ||||||||||||||||||
(10.0 per cent trimmed mean) | |||||||||||||||||||
An ideal measure of core inflation should be efficient in distinguishing between 'core' and 'non-core' components of inflation. It should be unbiased with respect to measured inflation. It should also be robust in terms of coverage. Timeliness and credibility are other pre-requisites of an ideal measure of core inflation.
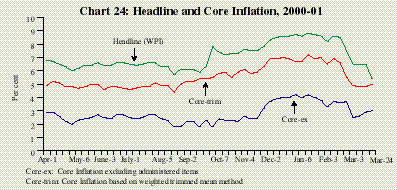
In India, the impact of supply side factors such as food prices in 1998-99 and administered price changes of electricity and petroleum products in 2000-01 suggests that it will be useful to estimate and monitor underlying inflation excluding the impact of changes in prices of such items. Preliminary work conducted in this area indicates that core inflation measured by excluding prices of administered items (which account for 16.4 per cent of the total weight of the WPI) rose marginally to 3.0 per cent, on a point-to-point basis, as on March 24, 2001 from 2.6 per cent in 1999-2000. On the other hand, core inflation measured by the weighted trimmed mean method worked out to 5.0 per cent as on March 24, 2001 as compared with 4.9 per cent at the end of March 2000 (Chart 24). It needs to be stressed that these are extremely preliminary results, and further research is needed before the utility of the concept of core inflation for monetary policy formulation in India can be judged.
Retail price inflation, as measured by the annual variation in consumer price index for industrial workers (CPI-IW), on a point-to-point basis, moderated to 3.0 per cent by February 2001 from 3.6 per cent during the corresponding period of the preceding year. On an average basis, however, the CPI-IW inflation rate which started the year at 3.2 per cent (as against 13.1 per cent last year) has trended up to 4.0 per cent by February 2001, as against 3.7 per cent in the corresponding period of 2000.
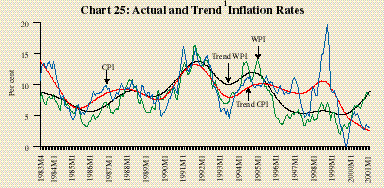
In general, there is considerable co-movement between the WPI and CPI in India with the CPI tending to follow the WPI with a lag. The co-movement between WPI and CPI is best depicted by the behaviour of their trend or filtered components. During the second half of the 1990s, a degree of divergence has set in with opposing movements becoming more discernible (Chart 25). While the WPI reflects the cost-push impact of administered price revisions, the CPI appears to track the sluggishness in demand conditions.


