IV. Price Situation - RBI - Reserve Bank of India
IV. Price Situation
Components of Inflation
Consumer Price Inflation
Asset Prices and Global Trends
The annual rate of inflation, measured by point-to-point changes in the wholesale price index (WPI), edged up to 6.2 per cent by end-March 2003 with the hardening of international oil prices. Underlying inflation, represented by the 52-week moving average of the WPI, however, fell throughout the first half of 2002-03. Despite a mild rise since mid-October, annual average inflation at 3.3 per cent in 2002-03 was lower than 3.6 per cent recorded in the preceding year (Chart 33).
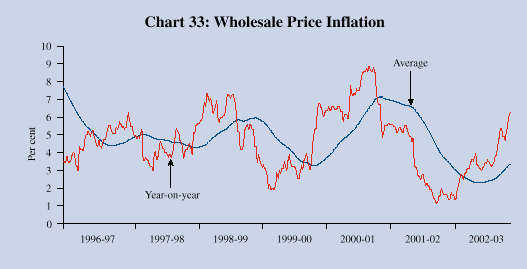
Inflation (point-to-point/headline) remained below 2 per cent up to end-May 2002. A moderate hardening on the back of increases in petroleum product (POL) prices in June and July, was reinforced by the impact of drought conditions on the prices of oilseeds which rose by 22 per cent in the first half of the year. On September 14, inflation peaked at 4 per cent but lost momentum thereafter and eased to 3.2 per cent on December 14, as supply management strategies were put in place.
Between December 14, 2002 and February 22, 2003 inflation spurted to 4.9 per cent. Of this 1.7 percentage point increase, more than a third reflects the statistical effect of the base – the WPI declined over the period December 15, 2001 to February 23, 2002 and this overstates the inflation in the current year (Chart 34). The rise in prices of manufactures explained around 30 per cent of the increase. The upward revision of POL prices in January and February 2003 contributed 18 per cent. The increase in prices of primary articles – mainly oilseeds, tea, natural fibres and raw cotton - accounted for the rest.
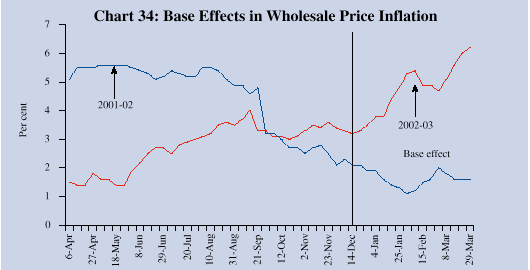
From February 22, 2003 inflation rose further, reaching 6.2 per cent on March 29, a 1.3 percentage point increase. The ‘base’ effect receded completely. The hardening of international crude oil prices drove domestic POL prices up by 10.8 per cent which accounted for 46 per cent of the increase in inflation during February 22-March 29, 2003. The rest was contributed by prices of manufactures, as primary articles prices declined marginally (Table 13).
Table 13 : Disaggregated WPI Inflation |
|||||
(Per cent) |
|||||
|
|
|||||
Groups |
December 14, |
February 22, |
March 29, |
Weighted |
Weighted |
2002 |
2003 |
2003 |
Variation |
Variation |
|
(Inflation) |
(Inflation) |
(Inflation) |
(Feb 22, 2003 |
(Mar 29, 2003 |
|
over Dec 14, |
over Feb 22, |
||||
2002 |
2003) |
||||
|
|
|||||
1 |
2 |
3 |
4 |
5 |
6 |
|
|
|||||
Fuel Group |
4.4 |
7.0 |
10.8 |
0.3 |
0.6 |
Primary Articles |
3.3 |
6.1 |
5.9 |
0.3 |
0.0 |
Manufactured Products |
2.8 |
3.7 |
4.8 |
0.5 |
0.7 |
Base Effect |
– |
– |
– |
0.6 |
0.0 |
All Commodities |
3.2 |
4.9 |
6.2 |
1.7 |
1.3 |
|
|
|||||
In the first fortnight of April 2003 upward pressures persisted as inflation rose to 6.5 per cent on April 12. The impact of transport disruptions was reflected in a rise in prices of primary articles, mainly fruits and vegetables.
Disaggregated commodity price movements indicate shifts in the underlying constituents. Drought conditions associated with the uneven distribution of the south-west monsoon initially affected the prices of oil seeds and sugar cane. In spite of a shortfall of 22.1 million tonnes in foodgrains production in the kharif season, increased off-take under targeted public distribution programmes and other welfare schemes together with large open market sales and exports contained potential inflationary pressures on foodgrains. Primary food articles prices recorded a modest increase of 1.0 per cent in 2002-03 (Table 14).
Table 14 : Commodity-wise Break-up of Inflation |
||||||||||||
(Point-to-point) |
||||||||||||
(Per cent) |
||||||||||||
|
|
||||||||||||
Commodity |
Weight |
Inflation rate |
||||||||||
1996- |
1997- |
1998- |
1999- |
2000- |
2001- |
2002- |
Weighted |
|||||
97 |
98 |
99 |
00 |
01 |
02 |
03 |
Contri- |
|||||
bution |
||||||||||||
2002-03 |
||||||||||||
|
|
||||||||||||
1 |
2 |
3 |
4 |
5 |
6 |
7 |
8 |
9 |
10 |
|||
|
|
||||||||||||
All Commodities |
100.0 |
5.4 |
4.5 |
5.3 |
6.5 |
4.9 |
1.6 |
6.2 |
100.0 |
|||
I) |
Primary Articles |
22.0 |
9.2 |
4.6 |
7.6 |
4.0 |
-0.4 |
3.9 |
5.9 |
21.6 |
||
Food Articles |
15.4 |
12.4 |
3.0 |
2.7 |
3.8 |
-2.8 |
5.2 |
1.0 |
2.7 |
|||
i) |
Cereals |
4.4 |
15.9 |
-4.7 |
22.7 |
4.7 |
-5.5 |
0.8 |
4.6 |
3.4 |
||
ii) |
Pulses |
0.6 |
-1.3 |
5.2 |
0.1 |
10.7 |
7.1 |
-3.3 |
-0.3 |
0.0 |
||
iii) |
Fruits and Vegetables |
2.9 |
9.1 |
5.8 |
2.6 |
-0.7 |
-2.9 |
14.4 |
-1.1 |
-0.6 |
||
iv) |
Milk |
4.4 |
6.4 |
7.0 |
8.1 |
15.8 |
0.4 |
4.7 |
0.6 |
0.5 |
||
v) |
Eggs, Fish and Meat |
2.2 |
23.2 |
3.6 |
4.1 |
10.1 |
-2.1 |
9.3 |
-4.2 |
-1.9 |
||
vi) |
Condiments and Spices |
0.7 |
-1.7 |
28.8 |
-2.8 |
1.0 |
-13.8 |
-0.2 |
7.5 |
0.9 |
||
vii) |
Other food articles (Tea and coffee) |
0.2 |
24.9 |
22.3 |
-24.4 |
-2.8 |
-8.7 |
-25.7 |
27.9 |
0.6 |
||
Non-food Articles |
6.1 |
-0.9 |
2.5 |
10.4 |
9.4 |
2.4 |
0.6 |
20.7 |
18.9 |
|||
i) |
Fibres |
1.5 |
-3.0 |
18.2 |
-6.3 |
-3.6 |
7.4 |
-17.9 |
28.2 |
5.5 |
||
ii) |
Oilseeds |
2.7 |
4.4 |
3.7 |
4.9 |
-8.0 |
2.8 |
6.8 |
26.0 |
9.5 |
||
II) |
Fuel, Power, Light and Lubricants |
14.2 |
13.3 |
13.7 |
3.2 |
26.7 |
15.0 |
3.9 |
10.8 |
35.2 |
||
i) |
Mineral Oils |
7.0 |
20.8 |
13.5 |
-1.1 |
41.6 |
17.0 |
1.2 |
18.4 |
30.9 |
||
ii) |
Electricity |
5.5 |
4.5 |
13.7 |
9.6 |
15.1 |
11.5 |
9.2 |
3.4 |
4.3 |
||
iii) |
Coal Mining |
1.8 |
17.4 |
14.6 |
0.0 |
8.8 |
8.1 |
-1.9 |
0.0 |
0.0 |
||
III) |
Manufactured Products |
63.8 |
2.4 |
2.3 |
4.9 |
2.4 |
3.8 |
0.0 |
4.8 |
43.6 |
||
i) |
Food Products |
11.5 |
10.6 |
5.8 |
9.2 |
0.4 |
-3.7 |
0.3 |
7.4 |
12.7 |
||
ii) |
Sugar, Khandsari and Gur |
3.9 |
11.2 |
6.3 |
14.6 |
2.9 |
-6.1 |
-3.2 |
-13.2 |
-7.4 |
||
iii) |
Edible Oil |
2.8 |
1.0 |
6.9 |
12.7 |
-17.9 |
-4.8 |
12.5 |
26.9 |
8.7 |
||
iv) |
Oil Cakes |
1.4 |
5.3 |
-1.2 |
-0.2 |
4.7 |
0.9 |
15.0 |
40.1 |
9.1 |
||
v) |
Cotton Textiles |
4.2 |
-2.0 |
4.5 |
1.2 |
-1.9 |
6.3 |
-6.7 |
8.2 |
4.9 |
||
vi) |
Man-made Textiles |
4.7 |
-18.6 |
-2.7 |
-7.8 |
6.6 |
2.0 |
-4.7 |
14.5 |
5.7 |
||
vii) |
Rubber and Plastic Products |
2.4 |
-1.6 |
-0.2 |
0.1 |
0.2 |
0.8 |
0.8 |
5.7 |
1.7 |
||
viii) |
Chemicals and Chemical Products |
11.9 |
4.9 |
0.7 |
11.0 |
5.5 |
4.0 |
2.5 |
4.0 |
8.0 |
||
ix) |
Fertilisers |
3.7 |
4.9 |
0.0 |
3.9 |
8.7 |
3.4 |
3.6 |
2.1 |
1.3 |
||
x) |
Urea-N-Content |
2.2 |
10.3 |
0.0 |
9.0 |
12.8 |
1.8 |
4.7 |
0.5 |
|||
xi) |
Cement |
1.7 |
-6.9 |
-7.0 |
5.6 |
-0.7 |
20.3 |
-4.7 |
1.1 |
0.3 |
||
xii) |
Basic metals, Alloys and Metal products |
8.3 |
3.7 |
3.3 |
1.0 |
3.2 |
3.2 |
-0.9 |
6.5 |
7.5 |
||
xiii) |
Iron and Steel |
3.6 |
7.0 |
4.6 |
0.9 |
1.4 |
1.3 |
0.0 |
9.2 |
4.6 |
||
xiv) |
Non-metallic Mineral |
|||||||||||
Products |
2.5 |
-3.6 |
-2.4 |
2.9 |
-0.9 |
15.7 |
-2.8 |
3.3 |
1.2 |
|||
xv) |
Machinery and Tools |
8.4 |
3.0 |
-1.5 |
1.1 |
-0.5 |
10.0 |
2.0 |
0.9 |
1.0 |
||
xvi) |
Non-electrical Machinery |
3.4 |
8.8 |
1.0 |
3.9 |
1.1 |
6.9 |
5.4 |
1.9 |
1.2 |
||
xvii) Electrical Machinery |
5.0 |
-1.4 |
-3.5 |
-1.3 |
-1.9 |
11.8 |
-1.1 |
-0.4 |
-0.2 |
|||
xviii) Transport Equipment and Parts |
4.3 |
5.0 |
3.1 |
2.3 |
4.7 |
5.8 |
1.3 |
-1.3 |
-0.8 |
|||
|
|
||||||||||||
The effects of moisture stress impacted on the prices of primary non-food articles which steadily increased from August 2002 onwards. Prices of agro-based products in the manufacturing category rose sympathetically (Chart 35).
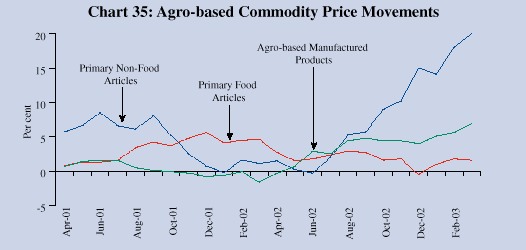
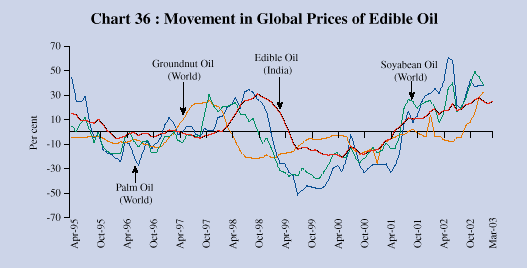
Prices of oil seeds and edible oils rose more sharply. Shortfalls in the domestic production of oilseeds have necessitated imports of edible oils which account for about half of domestic demand. Consequently, the domestic prices of edible oils display close co-movement with international prices of edible oils (Chart 36).
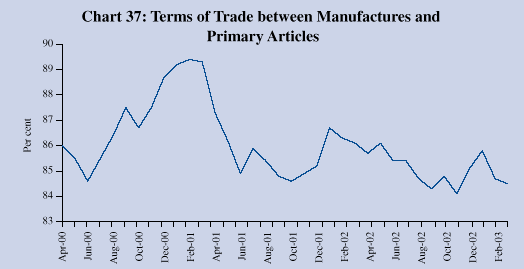
Prices of manufactured products recovered from lows in early 2002 –when they touched zero and even dipped below – and rose mildly through the year. Between February 22, 2003 and March 29, 2003 however, prices of manufactures increased somewhat faster. Edible oil, oil cakes, cotton textiles, iron and steel, manmade textiles and chemicals and chemical products were the prime movers. Provisional information indicates that the strengthening of prices of manufactures continued in early April 2003. The firming up of prices of manufactured goods arrested the erosion of the internal terms of trade between manufactures and primary articles which improved towards the close of 2002-03 (Chart 37).
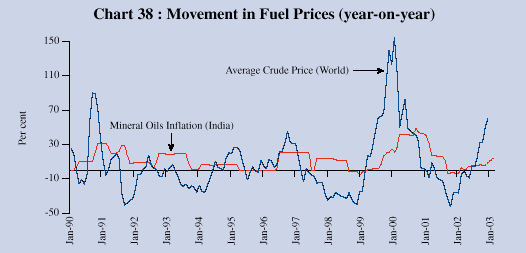
Fuel group inflation was moderate up to mid-December 2002 except for some firming up in June and July 2002 on account of upward revision in domestic POL prices. From the second half of December 2002, however, international crude prices began hardening as tensions in Iraq mounted. Domestic fuel prices were revised upward successively, following the formal dismantling of the administered pricing mechanism (APM) (Chart 38). In the first week of April 2003, domestic fuel prices edged down as international crude prices softened with the dissipation of war uncertainties.
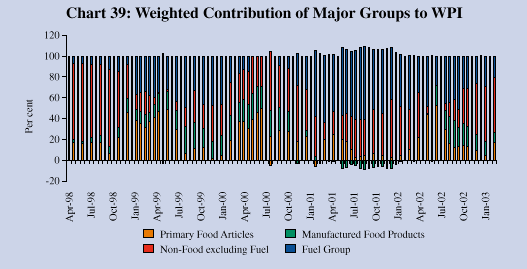
Underlying inflation (measured by average WPI) during 2002-03 was dominated by the behaviour of the manufactured products group whose weighted contribution to overall inflation rose to 43.7 per cent from 29.6 per cent during the previous year. The contribution of the fuel group declined to 32.4 per cent from 48.0 per cent, while the contributions of the primary articles group was stable at around 23.2 per cent during the same period. The inflation record of 2002-03 was, thus, dominated by the prices of non-food items (composite) which contributed 84.6 per cent to overall inflation; in contrast, it was food items (composite) which drove inflation in the preceding year, contributing 53.3 per cent to overall inflation (Chart 39).
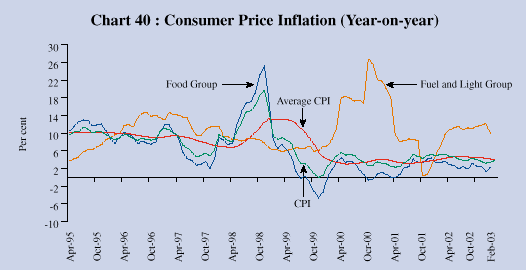
Retail price inflation, measured by the annual variation in the average consumer price index for industrial workers (CPI-IW) remained stable at 4.1 per cent in February 2003, the same as in the preceding year. On a point-to-point basis, the CPI-IW displayed variability, reflecting lagged adjustment of consumer prices to agricultural supply disturbances (Chart 40).
Asset Prices and Global Trends
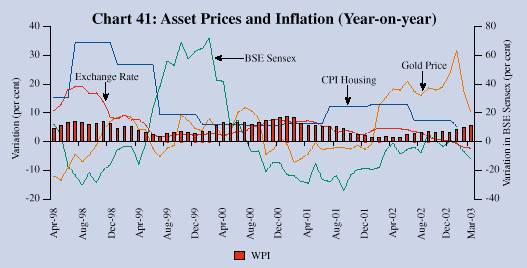
A key issue in the inflationary process is the manner in which economic agents read current and past information to assess how the future will unfold. In turn, understanding the formation of inflation expectations has implications for the efficiency of forward-looking monetary policy. Stabilising inflation expectations becomes the principal objective of monetary policy action. Accordingly, it becomes crucial to obtain a reliable gauge on inflation expectations in the economy. The various measures of inflation have displayed conflicting signals in tracking inflation. The current long phase of low inflation has resulted in a loss of practical utility in core measures of inflation. This warrants the need to develop and monitor a broader set of conditions including asset prices to assess underlying inflation and inflation expectations (Chart 41).
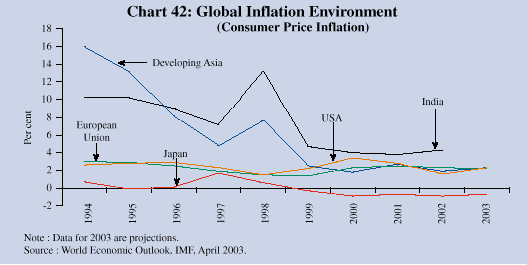
Current inflation conditions render the inflation outlook considerably uncertain. Over more than a decade, the world has experienced an unprecedented period of low inflation. In the second half of the 1990s, most monetary authorities in the world have had to contend with the need to arrest the downturn in economic activity and even the threat of deflation. Despite the accommodative stance of monetary policy, aggregate demand remains weak in large parts of the world (Chart 42).
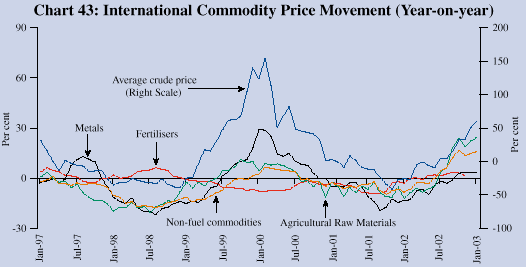
International commodity prices recovered in the second half of 2002 after bottoming out in late 2001 from a prolonged decline in the aftermath of the Asian crisis. Non-fuel commodity prices, however, remain bound by weak demand and inventory drawdown. Metal prices declined through the 1990s and again in 2001. In 2002 metal prices recovered weakly. International prices of food items, agricultural raw materials and beverages firmed up in 2002 after a trough starting in late 1998. International crude prices declined from 1992 onwards, interrupted by periods of hardening in 1995-97 and 1999-2000. Since early August 2002, spot oil prices rose markedly owing to concerns about the geo-political situation in the Middle-East (Chart 43). In the aftermath of the war in Iraq, the outlook for international oil prices is soft.
These global developments are expected to have a bearing on the domestic inflation situation in the year ahead. The overall inflation outlook is contingent upon a set of imponderables like the prospects for global growth, continuing geo-political uncertainties and international oil prices in addition to the performance of the monsoon this year. Sharp changes in the future behaviour of international oil prices, in particular, would warrant a revision in the inflation outlook.
The outlook for inflation in 2003-04 is expected to remain benign in India. International crude prices have started easing and upside risks for domestic inflation are waning. A downward revision in domestic POL prices with effect from April 16, 2003 is expected to enable a further decline in inflation. Information on the spread and intensity of rainfall needs to be juxtaposed with initial forecasts of the monsoon in the approaching season to obtain reliable gauge of the impact on prices of primary articles. The recent firming up of prices of manufactures would depend on sustained acceleration in industrial activity to influence the near-term inflation outlook in India.


