 IST,
IST,


IV. Price Situation
Inflation conditions firmed up worldwide in 2004, driven up by soaring international crude oil prices and upward pressures from prices of metals and key agricultural commodities. Inflation in India rose sharply up to August 2004 in concert with imported price pressures and was exacerbated by the setback to Kharif output from the uneven and inadequate South-West monsoon. From September 2004, however, inflationary pressures began to ease under the impact of a mix of factors including the waning of the impact of the South-West monsoon on agricultural commodity prices, fiscal measures to moderate the pass-through of imported inflation, monetary policy measures to drain excess liquidity from financial markets and stabilise inflation expectations and the strong base effect of the sharp rise in prices in the preceding year. Although international commodity prices are beginning to stabilise, crude oil prices remain at elevated levels which, together with the persistence of nervous sentiment in world oil markets, pose a serious upside risk to inflation.
Globally, inflation began to rise in early 2004, driven up by strong input demand from the global recovery and the continued expansion of the Chinese economy. Demand-side pressures on global inflation remained relatively weak, despite concerns about easy monetary conditions fuelling asset prices . Reflecting the supply-side character of inflation, producer prices tended to lead consumer prices in most economies. As commodity costs represent only a small share of the overall costs, the increase in commodity prices was initially absorbed by firms in their profit margins, creating a wedge between producer and consumer prices.
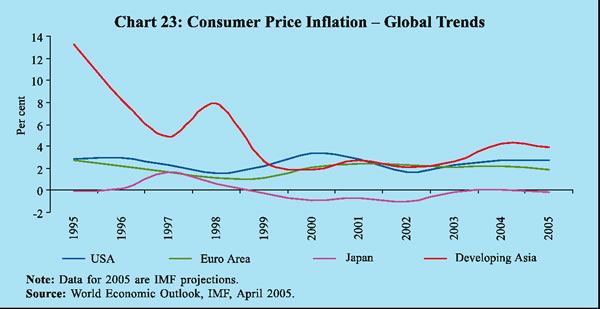
Consumer prices, however, began to harden by July 2004 as expansion in capacity utilis ation forced producers to pass on higher input prices . Consumer price inflation firmed up to 2. 0 per cent in advanced economies in 2004, after remaining below two per cent for two years in succession. By contrast, inflation eased somewhat to 5.7 per cent in 2004 after remaning steady at 6.0 per cent in the previous two years across emerging market economies and the developing countries as a group. In developing Asia, inflation was somewhat higher because of strong economic activity and rising oil intensity (Chart 23) .
In the US, producer price inflation accelerated to 4.7 per cent in February 2005 from 2.0 per cent a year ago, driven by input demand, oil prices and the weakening of the US dollar. Headline consumer inflation accelerated to 3.0 per cent in February 2005 from 1.7 per cent a year ago. In the Euro area, inflation at 2.4 per cent in December 2004, measured by the Harmonised Index of Consumer
Prices (HICP), crossed the European Central Bank's (ECB) target of about 2.0 per cent, driven by higher oil prices. Inflation at 2.1 per cent in March 2005 continued to be above the target. The Japanese economy experienced some upturn in consumer prices in 2004, especially on account of higher oil prices after a long bout of deflation. Deflationary pressures emerged again in early 2005 with consumer prices falling by 0.3 per cent year-on-year (y-o-y) in February 2005.
In China, the general purchasing price index (PPI) of industrial raw materials, fuels and power increased by 11.4 per cent over the previous year on the back of strong growth, while the factory prices of industrial products rose by 6.1 per cent leaving smaller profit margins. Although real GDP growth continued to be strong at above 9 per cent in the fourth quarter of 2004, consumer price inflation in China dipped to a 9-month low of 2.4 per cent by December 2004 on account of decline in food prices and the higher base of the preceding year. For the full year, inflation rose by 3.9 per cent as compared with 1.2 per cent in 2003, mainly due to a sharp rise in food prices which contribut ed over 80 per cent of the consumer price inflation of 2004. Consumer price inflation accelerated to 3.9 per cent in February 2005 from 2.1 per cent a year ago.
A number of central banks, most notably the US Federal Reserve, began to signal a reversal of their accommodative monetary policy stance in order to stabilise inflation expectations (Table 16). The US Federal Reserve raised its target Federal Funds Rate in seven equal stages by 175 basis points to 2.75 per cent between June 2004 and March 2005. The Federal Open Market Committee
|
Table 16 : Global Monetary PolicyTargets and Inflation |
|||||
|
(Per cent) |
|||||
|
Country / Region |
Key Policy Rate/Target |
Changes |
in Policy Rate/ |
Inflation Rate |
|
|
Target |
|||||
|
From |
To |
Target |
Outcome |
||
|
1 |
2 |
3 |
4 |
5 |
6 |
|
U S |
Target Federal |
||||
|
Funds Rate |
|||||
|
June 2003 |
1 . 2 5 |
1 . 0 0 |
No Target |
2 . 1 |
|
|
June 2004 |
1 . 0 0 |
1 . 2 5 |
3 . 3 |
||
|
August 2004 |
1 . 2 5 |
1 . 5 0 |
2 . 7 |
||
|
September 2004 |
1 . 5 0 |
1 . 7 5 |
2 . 5 |
||
|
November 2004 |
1 . 7 5 |
2 . 0 0 |
3 . 5 |
||
|
December 2004 |
2 . 0 0 |
2 . 2 5 |
3 . 3 |
||
|
February 2005 |
2 . 2 5 |
2 . 5 0 |
3 . 0 |
||
|
March 2005 |
2 . 5 0 |
2 . 7 5 |
- |
||
|
UK |
Repo Rate |
||||
|
February 2003 |
4 . 0 0 |
3 . 7 5 |
2 . 5 |
3 . 2 |
|
|
July 2003 |
3 . 7 5 |
3 . 5 0 |
2 . 5 |
3 . 1 |
|
|
November 2003 |
3 . 5 0 |
3 . 7 5 |
2 . 5 |
2 . 5 |
|
|
February 2004 |
3 . 7 5 |
4 . 0 0 |
2.0* |
1.3* |
|
|
May 2004 |
4 . 0 0 |
4 . 2 5 |
2 . 0 |
1 . 5 |
|
|
June 2004 |
4 . 2 5 |
4 . 5 0 |
2 . 0 |
1 . 6 |
|
|
August 2004 |
4 . 5 0 |
4 . 7 5 |
2 . 0 |
1 . 3 |
|
|
March 2005 |
* * |
* * |
2 . 0 |
- |
|
|
Euro Area |
Interest Rate on |
||||
|
Main Refinancing |
|||||
|
Operations |
|||||
|
March 2003 |
2 . 7 5 |
2 . 5 0 |
2 . 0 |
2 . 5 |
|
|
June 2003 |
2 . 5 0 |
2 . 0 0 |
2 . 0 |
1 . 9 |
|
|
March 2005 |
* * |
* * |
2 . 0 |
2 . 1 |
|
|
Japan |
Target Balance of |
||||
|
Current Accounts with |
|||||
|
the BoJ (Trillion Yen) @ |
|||||
|
April 2003 |
15-20 |
22-27 |
No Target |
- 0 . 1 |
|
|
May 2003 |
22-27 |
27-30 |
- 0 . 2 |
||
|
October 2003 |
27-30 |
27-32 |
0 . 0 |
||
|
January 2004 |
27-32 |
30-35 |
- 0 . 3 |
||
|
March 2005 |
* * |
* * |
- |
||
|
* : Inflation target which was defined in terms of Retail Price Index
(RPI) excluding mortgage |
|||||
(FOMC), however, believes that the stance of monetary policy continues to be accommodative and, coupled with robust underlying growth in productivity, is providing ongoing support to economic activity.
The ECB maintained its monetary policy stance as the overall inflation outlook was perceived to be consistent with price stability in the medium term. Inflation is expected to gradually come down to its target of around 2.0 per cent in the course of 2005.
The Bank of England's Monetary Policy Committee raised its policy repo rate by 125 basis points between November 2003 and August 2004 in order to preempt the possibility of any undue increase in asset prices, especially housing prices, from feeding into inflation. CPI inflation at 1.6 per cent in February 2005 is projected to increase to the Bank of England's target of 2.0 per cent over the next two years.
The Bank of Japan (BoJ) switched from the traditional approach of targeting short-term interest rate to quantitative easing in March 2001. This was because the target interest rate being pursued had already approached zero (0.15 per cent), constrainng the BoJ’s ability to provide futher stimulus to growth through expansionary monetary policy. Under quantitative easing in the present form, the BoJ conducts open market operations (OMOs) aimed at increasing the current account balances held at the BoJ by commercial banks. In view of the continuing deflation, the Bank of Japan chose to persist with the target range for bank reserves at 30-35 trillion yen in its monetary policy meetings throughout 2004 to ensure sufficient liquidity in the system.
Faced with the challenges of an overheating economy in 2004, the People's Bank of China (PBC) used a mix of monetary policy instruments to appropriately adjust the monetary and credit aggregates on a timely basis and prompted commercial banks to implement the macro financial management policy by differentiating credit support to various industries. The People's Bank of China tightened monetary policy through a mix of higher reserve requirements and a hike in the benchmark deposit and lending interest rates in order to moderate economic expansion and rein in inflation.
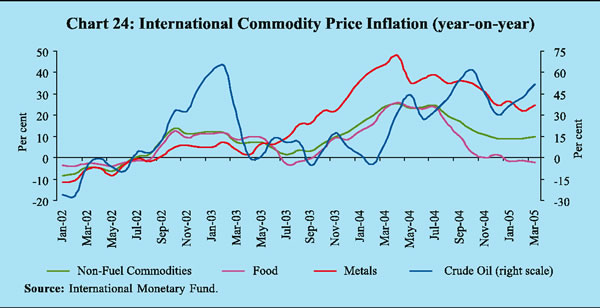
Commodity prices, which had risen sharply in the first half of 2004, stabilised at elevated levels by the end of the year. Fuel prices surged up by 30.9 per cent , on an average, in 2004 on top of an increase of 16.7 per cent in the previous year. Non-fuel commodity prices (covering prices of food, beverages, agricultural raw materials and metals) rose on an average by 18. 6 per cent in 2004, led by metals (36.4 per cent) (Chart 24). The increase in commodity prices in the international markets in US dollar terms was much higher than in terms of the Euro or the Japanese Yen. This reflected the depreciation of the US dollar by 9.4 per cent against the Euro and 6.7 per cent against the Yen in 2004.
International oil prices hardened during 2004 amidst concerns about strong demand, oil supply bottlenecks, low inventories and very low spare output capacity. In spite of periodic increases in supply by the Organisation of the Petroleum Exporting Countries (OPEC), market sentiment remained nervous on supply concerns and forecasts of a sustained rise in demand. US crude oil prices (West Texas Intermediate or WTI) climbed to a high of US $ 55 per barrel
towards end-October 2004, driven up by a combination of adverse factors such as the effects of Hurricane Ivan on production sites along the Gulf of Mexico, financial difficulties of the major Russian producer Yukos and a drop in US oil inventories on the eve of the winter season. UK crude prices (i.e. , UK Brent) rose by 20 per cent during January-March 2005 over and above an increase of 32.8 per cent in 2004.
Oil prices (WTI) receded to sub-US$ 50 levels by November 5, 2004 following an improvement in US inventories, recovery in supply lines along the Gulf of Mexico and a relaxation in the OPEC production ceiling by a further million barrels per day effective November 1, 2004 but crossed US$ 50 per barrel in February 2005 again over supply concerns. Despite the OPEC's decision in its March 16, 2005 meeting to raise its output target immediately by 0.5 million barrels a day (mb/d) to 27.5 mb/d, US crude oil prices (WTI) rose to a record US $ 57.40 on March 17, 2005 on concerns about the OPEC's capacity to meet global demand which is seen as rising faster than supply. Crude oil prices moderated to about US $ 54 a barrel by March 28, 2005 supported by a rebound in the US dollar, but rose again to an all-time peak of US$ 57.8 a barrel on April 4, 2005 triggered by a forecast that prices could spike above US$ 100 a barrel due to robust global demand , tight spare capacity and on concerns about the OPEC's capacity to meet rising global demand.
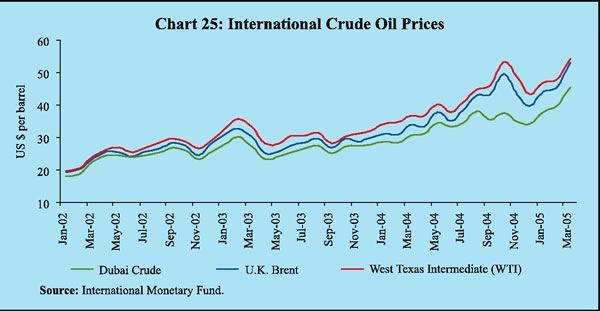
All categories of international crude oil recorded sharp price increases. The increase in the Dubai crude prices was subdued during June-October 2004 relative to the increase in the prices of US WTI and UK Brent. During January-March 2005, however, Dubai crude prices rose faster than the other categories (Chart 25). This poses significant risks to inflation in India as the basket of crude oil imported by India is weighted in favour of the Dubai crude variety relative to Brent.
According to the IMF (2004), a permanent increase of US $ 5 per barrel in crude oil prices is estimated to reduce world output by 0.3 per cent a year after the hike. Inflation is estimated to increase by 60-70 basis points in major developing regions - more than three times the increase in industrial economies.
Average coal prices almost doubled in 2004. Begining in the first quarter, coal prices were driven up by strong Chinese demand, higher demand for fuel emerging from the global economic recovery and substitution in favour of coal as a result of increase in prices of natural gas.
Metal prices, on an average, rose sharply by 36.4 per cent in 2004 on the back of strong Chinese demand. The World Bank's composite index of steel products recorded an increase of 54.2 per cent in 2004. Steel prices recorded steep increases of 21 per cent in March 2004 and 10.3 per cent in April 2004. They continued to remain at high levels during the year due to a pick-up in demand from South Asian countries, including India. Rising Chinese demand is also beginning to put pressure on prices of iron ore. Prices of other metals such as aluminium, copper, nickel, tin and zinc also recorded sharp increases.
Prices of agricultural commodities as a group firmed up in the first quarter of the year as bad weather damaged crop prospects in a number of countries. During the course of the year, prices of key commodities such as wheat and oilseeds began to soften because of a bumper crop in the 2004-05 season. The Food and Agricultural Organisation (FAO) estimates that world cereal output increased by 9.2 per cent to a record 2,057 million tonnes in 2004. Cereal production is, in fact, forecast to exceed utilisation in 2004-05 for the first time in five years. Prices in world wheat markets began to soften as production increased by 11.8 per cent on the back of good harvests, in sharp contrast to a decline of 1.5 per cent in 2003-04. Prices of other coarse grains also declined as excess production drove up stocks by 27.9 per cent in 2004-05. Rice prices, however, remained firm amidst supply concerns, especially as the crop in the major producing countries of South Asia was reportedly affected by bad weather. Although rice output is now slated to increase by 3.8 per cent due mainly to a 15 per cent jump in the US output, most of the leading exporter countries, including India, Myanmar and Pakistan are reported to have cutshipments because of supply set backs . The resultant shrinkage in the international rice trade has kept rice prices firm, notwithstanding a drawdown of world rice stocks by 6.1 per cent.
Global oilseed production is estimated to have increased by 12 per cent during 2004-05, led by bumper soya crops in Argentina, Brazil, China and the US after a poor outturn in the previous year. Although demand remained strong, prices of oilseed-based products such as soyabean, soyabean oil, palm oil and soyabean meal softened substantially in the latter half of 2004-05 from the elevated levels in the first half as a result of a poor 2003-04 crop. Palm oil prices in Malaysia also eased, although fears of a return of El Nino resulted in some nervousness in the markets in the middle of the year.
World sugar markets witnessed excess demand conditions in 2004-05. Higher sugar demand, especially from developing countries, was exacerbated by a decline in Chinese production for the second consecutive year. As a result, sugar prices in the international markets were up by about 37 per cent (y-o-y) in March 2005.
In sharp contrast to the experience of the previous year, global cotton prices generally softened through 2004 with production catching up with rising demand. The International Cotton Advisory Committee (ICAC) estimates that cotton production climbed by 25.2 per cent during 2004-05, spurred by the higher prices of the previous year and outpaced consumption which grew by 8.1 per cent. Net imports by China during the 2004-05 season are expected to have remained at the previous year's level of 1.85 million tonnes. As a result, cotton prices reflected by the Cotlook A Index declined to US 53 cents per pound in 2004-05 from US 68 cents per pound in 2003-04.
The hardening of global commodity prices impacted inflation in India. Pressures from international prices of petroleum products and metals, in particular, resulted in these commodities contributing more than half of the wholesale price inflation in India in 2004-05. As against an increase of 49. 7per cent (y-o-y) in Dubai crude prices in March 2005, mineral oil prices in India increased by only 13.7 per cent (y-o-y) at end-March 2005. Domestic prices were last revised in November 2004 when the Dubai crude price was at US $ 34. 9 a barrel. Dubai prices increased further by over 30 per cent by March 2005. While international metal prices, on average, increased by 36.4 per cent in 2004, domestic metal prices rose by only 17.0 per cent (y-o-y) during 2004-05. The administered prices of domestic coal and fertilisers limited the automatic pass-through of the sharp rise in international coal and fertiliser prices. While international average coal prices almost doubled in 2004 before moderating somewhat in early 2005, administered prices of coal in India were increased by only 16.7 per cent during 2004-05. The administered prices of urea in India were not changed during 2004-05, despite an increase of over 65 per cent (y-o-y) in world urea prices in March 2005. The appreciation of the rupee against the US dollar during August 2004 - March 2005 (6.1 per cent) also seems to have cushioned the full impact of international commodity prices on domestic inflation.
Inflation in India moderated by the end of 2004-05 after spiking in the first half of the year. Supply side pressures dominated the inflation scenario -especially mineral oil - exacerbated by the setback to Kharif output from the uneven and inadequate South-West monsoon. The easing of inflation in the latter half reflected the waning of the adverse effect of the South-West monsoon on agricultural commodity prices, fiscal and monetary policy measures to moderate the pass-through of imported inflation and the strong base effect of the sharp rise in prices in the preceding year.
Headline inflation, measured by year-on-year (y-o-y) changes in the wholesale price index (WPI), moved in two distinct phases during 2004-05 (Table 17). The first phase, i.e. , April-August 2004 was marked by a hardening of domestic prices of coal, petroleum products, iron and steel and other metals, reflecting lagged adjustments to the increase in international prices. Prices of petroleum products were revised upwards effective June 16 and August 1, 2004. Coal prices were also raised in June 2004. The inadequate and uneven South-West monsoon began to push up prices of food items and non-food agricultural commodities such as cotton and oilseeds by July 2004. As a result, headline inflation rose sharply to a peak of 8.7 per cent by end-August 2004.
|
Table 17 : Variation in Wholesale Price Index |
||||
|
(Per cent) |
||||
|
Item |
Phase I |
Phase II |
||
|
(End-August 2004 over |
(End-March 2005 over |
|||
|
1 |
2 |
3 |
||
|
All Commodities |
4 . 9 |
0 . 1 |
||
|
1. |
Vegetables |
7 7 . 1 |
-27.1 |
|
|
2. |
Eggs, Fish and Meat |
1 0 . 1 |
-3.5 |
|
|
3. |
Raw Cotton |
0 . 8 |
-24.4 |
|
|
4. |
Oilseeds |
7 . 7 |
-11.9 |
|
|
5. |
Iron Ore |
1 9 0 . 0 |
-18.3 |
|
|
6. |
Coal Mining |
1 7 . 1 |
-0.3 |
|
|
7. |
Mineral Oil |
1 0 . 3 |
3 . 1 |
|
|
8. |
Edible Oils |
0 . 1 |
-8.1 |
|
|
9. |
Oil Cakes |
-8.5 |
-10.2 |
|
|
10. |
Tea and Coffee Processing |
9 . 1 |
-5.6 |
|
|
11. |
Cotton Textiles |
-3.0 |
-10.4 |
|
|
12. |
Iron and Steel |
1 7 . 4 |
3 . 3 |
|
|
Memo Item |
||||
|
i . |
Total Food Items |
4 . 4 |
-2.1 |
|
|
i i . |
Total Non-food Items |
5 . 1 |
0 . 3 |
|
Inflationary pressures began to recede in the second phase beginning September 2004, led by a decline in the prices of vegetables as the adverse effect of the inadequate South-West monsoon was found to be restricted largely to sugar. Cotton and oilseeds prices also fell sharply. The impact of fiscal measures in the form of cuts in excise and customs duties in June and August 2004 cushioned the pass-through of the increase in international prices to domestic inflation. Monetary policy measures by the Reserve Bank including higher reserve requirements announced in September 2004 and 25 basis point increase in the reverse repo rate and re-introduction of one-day reverse repo in October 2004 were able to rein in inflation expectations. A hike in fuel prices on November 5, 2004 was partly offset by some moderation, effective November 15, 2004. Sugar prices, however, continued to harden through the year, reflecting reduced domestic supply which also affected international prices. On a year-on-year basis, headline inflation at 5. 0 per cent at the close of 2004-05 was well in line with the assumption on inflation in the Reserve Bank’s Annual Policy Statement for 2004-05, albeit somewhat higher than 4. 6 per cent in 2003-04.
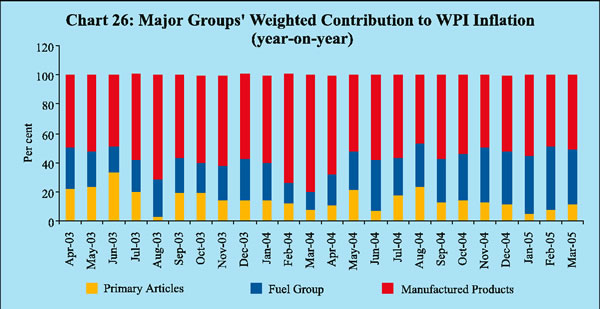
The contribution of various commodity groups to overall inflation underwent significant changes during 2004-05. The share of the fuel group climbed to 37.8 per cent during the year from 11.6 per cent during the previous year. The share of the manufactured products group declined to 51.1 per cent from 80.5 per cent in 2003-04 as the increase in sugar prices was more than offset by the decline in the prices of cotton, edible oils and oil cakes. The share of the primary articles group during the year was marginally higher than that in the previous year (Chart 26).
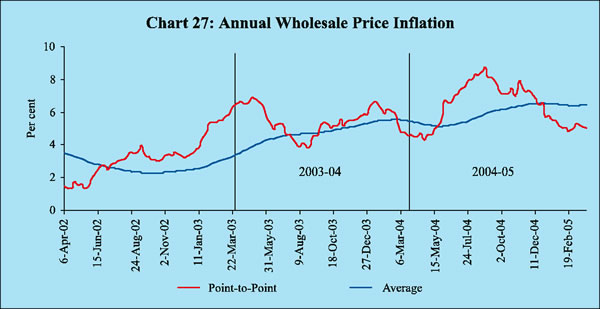
Reflecting the supply-induced character of the inflationary process during the year, annual WPI inflation excluding the administered and partially decontrolled items (electricity, coal mining, mineral oils and urea-N-content) at 4.1 per cent in 2004-05, on a point-to-point basis, was lower than the headline rate of 5.0 per cent. Driven up by the inflationary pressures during the first five months of 2004-05, the average inflation rate accelerated to 6.4 per cent during 2004-05 from 5.4 per cent and 3.4 per cent during 2003-04 and 2002-03, respectively (Chart 27).
Commodity Prices in India
Headline inflation in India was driven mainly by movements in commodity prices in 2004-05 as demand pressures remained muted. Global commodity prices, especially metals and crude oil, had a significant influence on the movements of commodity prices in India. The pass-through of global commodity prices to domestic inflation was, however, cushioned by monetary and fiscal policy measures.
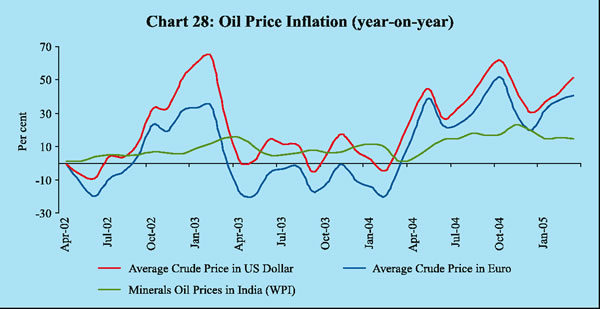
The upward revision in prices of petroleum products in three stages effective June 16, August 1 and November 5, 2004 (with some moderation effective November 15, 2004) resulted in domestic mineral oil prices emerging as the principal mover of inflation during the year (Chart 28). The contribution of mineral oils to year-on-year headline inflation worked out to as high as 30 per cent in 2004-05. The pass-through of the increase in international prices in 2004-05 was, however, cushioned by the absorption of a part of the burden of the oil price increase by the Government and oil companies. On June 15, 2004 excise duties on petrol, high-speed diesel and liquefied petroleum gas (LPG) were reduced by 4 percentage points, 3 percentage points and 8 percentage points, respectively. On August 18, 2004, excise duties were further cut for petrol and diesel (3 percentage points each) and kerosene (4 percentage points). This was buttressed by a reduction of customs duties on petrol, diesel, LPG and kerosene by 5 percentage points each. The revenue-neutral restructuring of customs and excise duties on petroleum products proposed in the Union Budget, 2005-06 is not expected to have any significant impact on retail prices.
The impact of a hike in world oil prices varies from country to country depending on the energy intensity of production, import intensity of consumption and impact on terms of trade. A change in the prices of petroleum products impacts inflation directly to the extent of its weighted contribution in the overall p r i c e index. As petroleum products are used as inputs in several other commodities, prices of all those commodities also change which, in turn, impacts inflation indirectly. In the Indian case, in the absence of countervailing policy intervention, it is estimated that every US dollar increase in crude oil prices could potentially add 15 basis points to WPI inflation as a direct effect and another 15 basis points as an indirect effect.
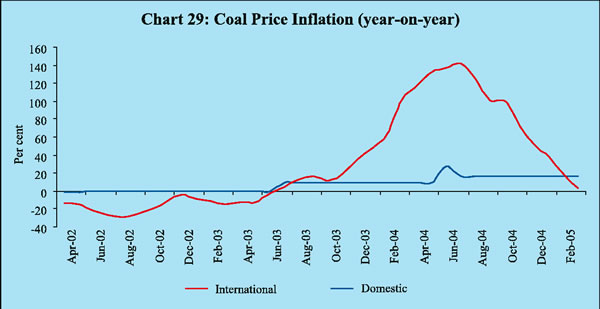
The upward revision in coal prices in June 2004 reflected the twin pressures of higher domestic demand and the sharp increases in international coal prices driven by strong Chinese growth (Chart 29). The Union Budget, 2005-06 has proposed to bring down the customs duty on coking coal with high ash content to 5 per cent from 15 per cent. Furthermore, coal production is estimated to have risen by 6.0 per cent in 2004-05 (up to February) from 4.9 per cent during the corresponding period of the previous year.
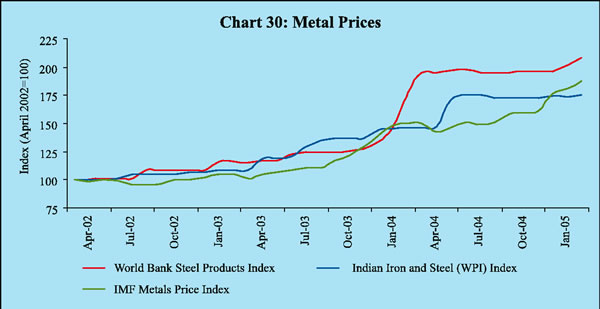
Domestic iron and steel prices increased by 21.3 per cent during 2004-05 on top of an increase of 34. 6 per cent in 2003-04 (Chart 30). This accounted for as much as 17.2 per cent of the increase in headline inflation during 2004-05. A sharp increase in international steel prices together with higher domestic demand drove up steel prices during April-August 2004. During April 2004-February 2005, the growth of production of finished steel at 3.2 per cent was lower than the increase of 6.3 per cent in consumption which was driven by substantial construction activity. The impact of the increase in international steel prices on domestic prices was partly contained by cuts in the customs and excise duties on inputs as well as on finished products. Domestic steel prices have stabilised since August 2004 in line with international price movements. Although the Union Budget, 2005-06 has proposed to restore the excise duty on iron and steel to the normal level of 16 per cent from 12 per cent, this is not expected to have any major impact on prices as the entire duty is modvatable by most categories of consumers.
Prices of agricultural and agriculture-related commodities rose during July-August 2004, reflecting mainly the concerns about the impact of the South-West monsoon on the Kharif crop (Chart 31). Rice prices hardened albeit marginally.
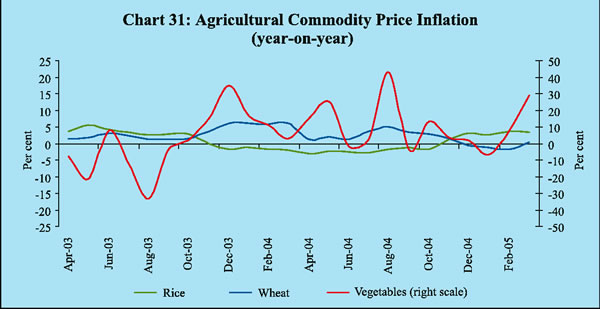
Jowar price inflation increased to double digits by August as output of coarse grains declined during the year. Potato prices also rose sharply in June-October as the unseasonal rainfall affected the crop on top of a lean season in 2003-04.
Prices of agriculture and related products began to move downwards in the latter half of the year as a result of the easing of drought fears and the expectation of a bumper rabi crop.
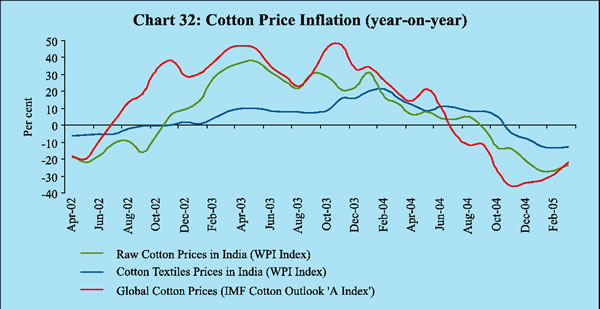
The intra-year movements in raw cotton and cotton textile prices reflected the diverse impact of international prices and domestic supply. Raw cotton prices began to harden in July 2004, reflecting worries about the South-West monsoon. The cotton crop is estimated to be 16.1 million tonnes during 2004-05, up from 13.8 million tonnes last year, spurred by the highly remunerative prices of the previous year. As supply concerns receded, cotton prices began to decline from September 2004 in line with the international price movements (Chart 32). Higher production of cotton also drove down prices of cotton textiles during the year.
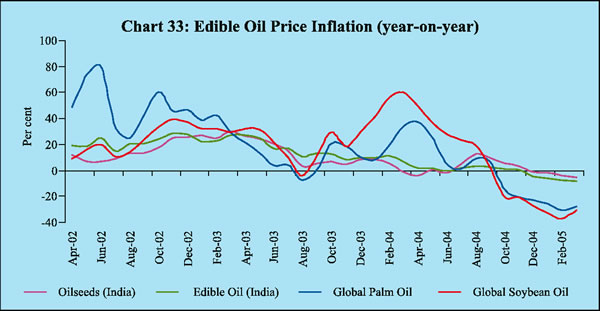
Domestic oilseeds prices hardened in the first phase despite the bumper crop of the previous year (Chart 33). Reports of a domestic crop failure resulting from inadequate rainfall were compounded by uncertainties over the possibilities of El Nino damaging Malaysian palm oil production. Besides, imports of edible oils during April 2004-January 2005 at 3.6 million tonnes were lower than 4.5 million tonnes during the corresponding period of 2003-04 in the wake of sufficient domestic production. Oilseeds prices began to soften in the second phase beginning September 2004 as the Kharif crop estimated at 16.8 million tonnes turned out to be actually higher than the preceding year’s output of 15.0 million tonnes. Furthermore, the acreage for the rabi season was also higher than the area sown in 2003-04. In order to contain rising prices, the Government reduced tariffs on vegetable oils in September 2004. A mix of reduction in tariff values alongside an increase in import duties was deployed in February 2005 to take care of the interests of both the farmers and the consumers.
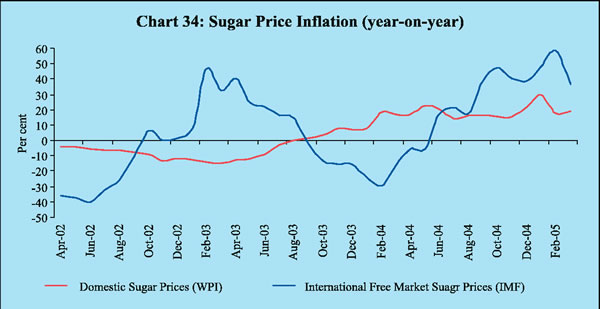
Sugar prices hardened in the latter half of 2004-05, reflecting domestic demand and supply imbalances as well as higher international prices (Chart 34). International sugar prices, in turn, have been affected by the domestic situation as India is the world’s largest consumer of sugar. The decline in output in the face of growing consumption put pressure on sugar prices in 2004-05. Although the Government released higher free sale quota of sugar during the latter half of the year, prices of sugar continued to increase unabated till March 2005.
Consumer Price Inflation
Retail price inflation, measured by y-o-y variation in the consumer price index for industrial workers (CPI-IW), accelerated to 4.8 per cent in September 2004 from 2.2 per cent in the beginning of the financial year and 2.9 per cent a year ago (Chart 35). This was driven by the increase in food prices emanating from the deficient and uneven progress of the South-West monsoon during July-August 2004. The food group (weight of 57 per cent) accounted for as much as 45 per cent of the overall retail inflation (y-o-y) in September 2004. Consumer price inflation decelerated thereafter to 3.8 per cent by December 2004 reflecting the easing of the impact of the monsoon on food prices. Consumer price inflation firmed up to 4.4 per cent in January 2005 mainly due to increase in the prices of fish, meat, sugar, kerosene oil and housing, before decelerating to 4.2 per cent in February 2005. On an annual average basis, CPI inflation at 3.8 per cent in February 2005, remained broadly at the level of the previous year.
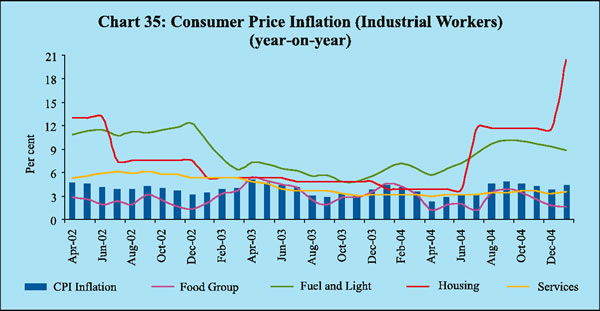
All other measures of consumer price inflation also showed upward movements in the first half of 2004-05. The annual CPI inflation for Urban Non-Manual Employees increased from 2.9 per cent in April 2004 to 4.0 per cent by August and remained steady at that level till November 2004. It fell to 3.6 per cent in December 2004 before edging up to 3.8 per cent in February 2005. CPI inflation for Agricultural Labourers increased from 1.5 per cent in the beginning of the financial year to 3.6 per cent by October 2004. It, however, gradually declined thereafter to 2.4 per cent in February 2005, lower than the previous year's level of 3.1 per cent. CPI inflation for Rural Labourers also increased from 1.8 per cent in the beginning of the year to 3.6 per cent by October 2004 and thereafter declined gradually to 2.4 per cent in February 2005.
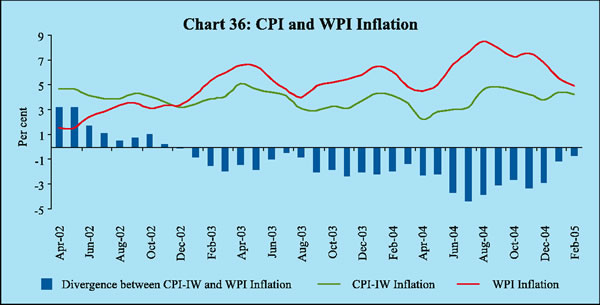
A distinctive feature of the recent inflation experience was a wedge between consumer price inflation and wholesale price inflation for the larger part of 2004-05 (Chart 36). This essentially reflected the differences in the composition of the two commodity baskets. Key drivers of wholesale price inflation such as fuels and metals have a negligible weight in the consumer price indices.
Harmonised Index of Consumer Prices (HICP)
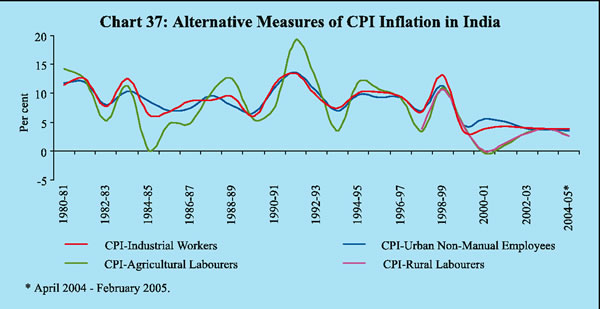
Various price indices are currently available to measure prices paid by a consumer or a producer. Most countries, therefore, compute indices of consumer prices to capture the cost of living and producer prices to capture the cost of production. In India, there are two sets of indices, viz., wholesale price index (WPI) and consumer price indices (CPIs), based on social classification and category of residence (rural or urban). The four broad measures of CPIs available at the national level to capture prices of a defined basket of goods and services consumed by a particular segment of the population are: CPI for Agricultural Labourers (CPI-AL) (defined as households which derive half their income through agricultural labour); CPI for Rural Labourers (CPI-RL) (households which derive half their income through rural labour); CPI for Industrial Workers (CPI-IW) (working class families, essentially in urban areas) and CPI for Urban Non-Manual Employees (CPI-UNME) (urban middle class families).
There are two key sources of difference in the four CPIs. The weight of cereals is about 10 per cent in the CPI basket for urban non-manual employees and about 20 per cent for industrial workers, while it is around 40 per cent for the agricultural/rural labourers. Housing is not considered in the CPI for agricultural/rural labourers, while it has a weight of as high as 16.4 per cent in the CPI for urban non-manual employees and 8.7 per cent in the CPI for industrial workers.
Although various measures of CPI do move together in the long run, significant variations have been observed in the short-run (Chart 37). This renders the interpretation of inflationary pressures difficult which, in turn, complicates the process of monetary policy formulation.
While different consumer price indices serve the purpose of assessing inflation for different sections of society, the analytical value of information provided by different CPIs can be enhanced by combining them into a Harmonised Index of Consumer Prices (HICP) which assesses consumer price inflation on a economy-wide scale.

Share this page:


Install the RBI mobile application and get quick access to the latest news!


