Both headline and core inflation in major economies remained firm during the first quarter of 2007-08, reflecting the combined impact of high commodity prices and strong demand conditions. Since end-March 2007, several central banks such as European Central Bank (ECB), Bank of England, Bank of Canada, Reserve Bank of New Zealand, Norges Bank (Norway), Sveriges Riksbank (Sweden), South African Reserve Bank and People’s Bank of China have further raised policy rates to contain inflation and inflationary expectations. Central banks of China and Russia also raised cash reserve requirements to address concerns regarding excess liquidity. On the other hand, central banks of Thailand, Indonesia and Brazil have further eased monetary policy since end-March 2007 in view of easing of inflationary pressures. The US Fed kept the policy rates unchanged during the first quarter.
In India, inflation based on the wholesale price index (WPI) initially rose to above 6.0 per cent in early April 2007 but eased to 4.4 per cent by July 14, 2007. Consumer price inflation also eased during the quarter ended June 2007, though it continued to remain above the WPI inflation, mainly reflecting the impact of higher food prices. Pre-emptive monetary measures since mid-2004 accompanied by fiscal and supply-side measures have helped in containing inflation.
Global Inflation
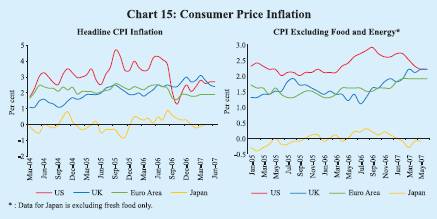
Headline inflation in major advanced economies remained firm in the first quarter of 2007-08 reflecting increases in prices of crude oil and food items (Chart 15). Notwithstanding some moderation during the quarter, headline inflation exceeded the targets/comfort zones in some cases. Amongst major economies, headline inflation (June 2007) was 2.7 per cent in the US, 2.4 per cent in the UK and 1.9 per cent in the euro area. Inflation was 2.2 per cent in May 2007 in the OECD countries, marginally lower than that of 2.4 per cent in March 2007. Core inflation also remained firm in major economies. In the US, CPI inflation (excluding food and energy) was 2.2 per cent in June 2007 (2.5 per cent in March 2007). In the OECD countries, CPI inflation (excluding food and energy) was 2.1 per cent in May 2007 (the same as in March 2007).
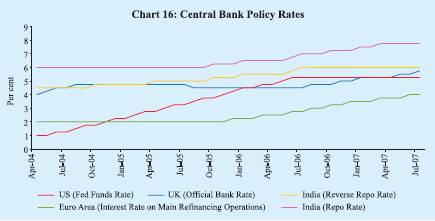
Many central banks have further tightened monetary policy during 2007-08 so far against the backdrop of persistent inflationary pressures, especially in view of continued strength of demand, ample liquidity and possible pass-through from past and present increases in oil and other commodity prices. In the euro area, risks to the price outlook are seen on the upside over the medium term. The European Central Bank (ECB), therefore, raised the key policy rate further by 25 basis points
on June 6, 2007 – a cumulative increase of 200 basis points since the tightening began in December 2005 (Table 28). Given the positive economic environment, the ECB is of the view that monetary policy is still on the accommodative side, with overall financing conditions favourable, money and credit growth vigorous and liquidity in the euro area ample. In the UK, in view of steady growth in output, continued rapid growth in credit and broad money, and margin of spare capacity in firms appearing limited, the risks to the outlook for inflation in the medium term are seen to be tilted to the upside. The Bank of England, therefore, raised its policy rate further by 50 basis points – 25 basis points each on May 10, 2007 and July 5, 2007 to 5.75 per cent – a cumulative increase of 125 basis points since the tightening began in August 2006 (Chart 16). Amongst other major advanced economies, the Bank of Canada (25 basis points), the Sveriges Riksbank (25 basis points), Norges Bank (50 basis points) and the Reserve Bank of New Zealand (75 basis points) have raised their policy rates during 2007-08 so far.
On the other hand, the US Fed did not change the policy rate during the quarter. Although core inflation moderated during April-June 2007, it remains at somewhat elevated level. The Federal Open Market Committee in its latest meeting held on June 28, 2007 noted that the risk that inflation would fail to moderate as expected remained the predominant policy concern. It indicated that future policy adjustments would depend on the evolution of the outlook for both inflation and economic growth, as implied by incoming information. The Bank of Japan (BoJ) has kept its policy rate unchanged at each of its meetings held since February 2007 when it raised the uncollateralised overnight call rate (the operating target of monetary policy since March 2006) by 25 basis points to 0.50 per cent.
Amongst major emerging economies, consumer price inflation in China increased to 4.4 per cent in June 2007 from 3.3 per cent in March 2007 and 1.5 per cent a year earlier, partly on the back of higher food prices (Chart 17). Economic activity has remained buoyant in 2007 so far; real GDP growth accelerated to 11.9 per cent during the second quarter of 2007 from 10.9 per cent a year ago. In view of strong growth in money supply and credit, the People’s
Table 28: Global Inflation Indicators |
(Per cent) |
Country/ |
Key Policy Rate |
Policy Rates
(As on |
|
Changes in |
|
CPI |
Real GDP |
Region |
|
July 24, 2007) |
|
Policy Rates
(basis points) |
|
Inflation
(y-o-y) |
Growth
(y-o-y) |
|
|
|
|
2005-06 |
2006-07 |
Since |
June |
June |
2006 |
2007 |
|
|
|
|
(April- |
|
(April- |
end- |
2006 |
2007 |
(Q1) |
(Q1) |
|
|
|
|
March) |
|
March) |
March
2007 |
|
|
|
|
1 |
2 |
3 |
|
4 |
|
5 |
6 |
7 |
8 |
9 |
10 |
Developed Economies |
|
|
|
|
|
|
|
|
|
|
Australia |
Cash Rate |
6.25 (Nov. 8, 2006) |
|
0 |
|
75 |
0 |
3.0 |
2.4 # |
3.1 |
3.8 |
Canada |
Overnight Rate |
4.50 (Jul.10, 2007) |
|
125 |
|
50 |
25 |
2.4 |
2.2 |
3.2 |
2.0 |
Euro area |
Interest Rate on |
|
|
|
|
|
|
|
|
|
|
|
Main Refinancing |
4.00 (Jun. 6, 2007) |
|
50 |
|
125 |
25 |
2.5 |
1.9 |
2.2 |
3.0 |
|
Operations |
|
|
|
|
|
|
|
|
|
|
Japan |
Uncollateralised |
0.50 (Feb. 21, 2007) |
|
0 |
** |
50 |
0 |
0.1 |
0.0 * |
3.0 |
2.6 |
|
Overnight Call Rate |
|
|
|
|
|
|
|
|
|
|
UK |
Official Bank Rate |
5.75 (Jul. 5, 2007) |
|
(-)25 |
|
75 |
50 |
2.5 |
2.4 |
2.4 |
3.0 |
US |
Federal Funds Rate |
5.25 (Jun. 29, 2006) |
|
200 |
|
50 |
0 |
4.3 |
2.7 |
3.7 |
1.9 |
Developing Economies |
Brazil |
Selic Rate |
11.50 (Jul. 18, 2007) |
|
(-)275 |
|
(-)375 |
(-)125 |
4.0 |
3.7 |
3.9 |
4.3 |
India |
Reverse Repo Rate |
6.00 (Jul. 25, 2006) |
|
75 |
|
50 |
0 |
6.3 |
6.6 * |
10.0 |
9.1 |
|
Repo Rate |
7.75 (Mar. 30, 2007) |
|
50 |
|
125 |
0 |
|
|
|
|
|
|
|
|
(0) |
|
(100) |
(50) |
|
|
|
|
China |
Benchmark 1-year |
6.84 (Jul. 21, 2007) |
|
|
|
81 |
45 |
1.5 |
4.4 |
10.9 |
11.9 $ |
|
Lending Rate |
|
|
|
|
(250) |
(150) |
|
|
|
|
Indonesia |
BI Rate |
8.25 (Jul. 5, 2007) |
|
425 |
@ |
(-)375 |
(-)75 |
15.5 |
5.8 |
5.0 |
6.0 |
Israel |
Key Rate |
3.75 (Jul. 23, 2007) |
& |
125 |
|
(-)75 |
(-)25 |
3.5 |
-0.7 |
5.2 |
5.4 |
Korea |
Overnight Call Rate |
4.75 (Jul. 12, 2007) |
|
75 |
|
50 |
25 |
2.4 |
2.5 |
5.1 |
4.9 $ |
|
|
|
|
|
|
(80) |
|
|
|
|
|
Russia |
Refinancing Rate |
10.00 (Jun. 19, 2007) |
|
(-)100 |
|
(-)150 |
(-)50 |
9.1 |
8.5 |
5.5 |
7.9 |
|
|
|
|
|
|
(150) |
(100) |
|
|
|
|
South Africa |
Repo Rate |
9.50 (Jun. 8, 2007) |
|
(-)50 |
|
200 |
50 |
3.9 |
6.9 * |
4.0 |
5.4 |
Thailand |
14-day Repurchase Rate |
5.00 (Jun. 7, 2006) |
|
225 |
|
50 |
|
|
|
|
|
|
1-day Repurchase Rate |
3.25 (Jul. 18, 2007) |
|
|
|
(-)44 ^ |
(-)125 |
5.9 |
1.9 |
6.1 |
4.3 |
@ : Bank Indonesia adopted BI rate as the reference rate with the formal adoption of inflation targeting in July 2005.
** : The Bank of Japan decided on March 9, 2006 to change the operating target of money market operations from
the outstanding balance of current accounts at the Bank to the uncollateralised overnight call rate.
^ : Change over January 16, 2007. Effective January 17, 2007, the 1-day repurchase rate replaced the 14 day
repurchase rate as the policy rate.
# : Q1 of 2007. * : May 2007. $ : Q2 of 2007.
& : To be effective from August 2007.
Note :
1. For India, data on inflation pertain to CPI for Industrial Workers.
2. Figures in parentheses in column (3) indicate the date when the policy rates were last revised.
3. Figures in parentheses in columns (5) and (6) indicate the variation in cash reserve ratios during the period.
Source : International Monetary Fund, websites of respective central banks and the Economist. |
Bank of China (PBC) increased the benchmark 1-year lending rate by 18 basis points on May 19, 2007 and 27 basis points on July 21, 2007 to 6.84 per cent –a total hike of 126 basis points since April 2006. Apart from continued issuances of its own bills to mop up liquidity, the PBC has raised the cash reserve ratio (CRR) by another 150 basis points since end-March 2007 - 50 basis points each effective April 16, 2007, May 15, 2007 and June 5, 2007 - to 11.50 per cent. The CRR has, thus, been increased by 400 basis points since July 2006.
In Korea, inflation was 2.5 per cent in June 2007 (2.2 per cent in March 2007). Although the upward pace of real estate prices has slowed down significantly, financial institutions’ lending has increased sharply. Against the backdrop of the domestic economy likely maintaining its upward trend and ample liquidity in the financial markets, the Bank of Korea raised the policy rate by 25 basis points to 4.75 per cent on July 12, 2007 - a cumulative increase of 150 basis points since October 2005. In other major Asian emerging economies such as Thailand and Indonesia, inflation remains relatively benign, reflecting both pre-emptive monetary tightening as well as appreciation of the exchange rates. In Thailand, real GDP growth has moderated on the back of slowdown in private consumption and investment demand. Inflation was moderate (1.9 per cent in June 2007 as compared with 2.0 per cent in March 2007). Therefore, the Bank of Thailand lowered the 1-day repurchase rate by 50 basis points each on April 11, 2007 and May 23, 2007, and another 25 basis points on July 18, 2007 to 3.25 per cent. The policy rate has been lowered by 169 basis points since January 17, 2007, partly reversing the increase of 275 basis points between June 2005 and June 2006. In Indonesia, economic activity is gradually regaining momentum, driven primarily by rapidly expanding exports and also by domestic consumption. Inflation was 5.8 per cent in June 2007, substantially lower than the peak of 18.4 per cent in November 2005. The Bank Indonesia, therefore, cut its policy rate by another 25 basis points to 8.25 per cent on July 5, 2007 – a total of 450 basis points since May 2006 - to support growth. The policy rate was earlier raised by 425 basis points during July-December 2005 to contain inflation.
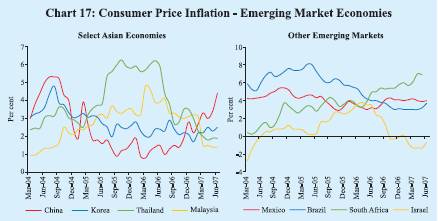
Amongst other emerging economies, the South African Reserve Bank raised its policy rate by 50 basis points in June 2007 to 9.5 per cent. The policy rate has been raised by 250 basis points since June 2006 to contain inflationary pressures emanating from volatility in oil prices and from food and services prices. Turkey has kept rates unchanged since August 2006 due to slowdown in domestic demand and moderation in inflation expectations. Turkey had earlier increased its policy rate by 425 basis points during June-July 2006 on concerns over the possible pass-through effect of the exchange rate movements arising from the volatility in international financial markets. On the other hand, in view of weak economic activity/easing of inflation, Brazil has reduced policy rate further by 125 basis points during 2007-08 so far – 25 basis points on April 18, 2007 and 50 basis points each on June 6, 2007 and July 18, 2007 - to 11.50 per cent. The policy rate has, thus, been reduced by 825 basis points since September 2005. The Bank of Israel initially lowered its policy rate by 50 basis points during 2007-08 (25 basis points each for May and June 2007) but increased the policy rate by 25 basis points on July 23, 2007 to 3.75 per cent. In Russia, consumer price inflation remains high, increasing from 7.1 per cent in March 2007 to 8.5 per cent in June 2007. Growth in money supply (M2) accelerated to 53 per cent, year-on-year, as on July 1, 2007 from 44 per cent a year ago. The Bank of Russia raised the required reserve ratio on credit institutions’ liabilities to nonresident banks in roubles and foreign currency by another 100 basis points to 4.5 per cent effective July 1, 2007 (it was earlier raised by 150 basis points effective October 1, 2006). However, the refinancing rate was reduced by 50 basis points in June 2007 – a total cut of 200 basis points of 50 basis points each on four occasions - from 12.0 per cent in December 2005 to 10.0 per cent in June 2007.
An assessment of key macroeconomic indicators in select EMEs shows that real GDP growth during 2006 was in the range of 3.7-11.1 per cent. Real GDP growth in India was the highest after China. Consumer price inflation was in the range of 1.9-8.5 per cent in select EMEs in June 2007 and inflation in India was the third highest amongst the select EMEs. Real policy rates in most countries ranged between 2 and 4 per cent in July 2007 (Table 29). Major EMEs, except India and South Africa, recorded surplus in current accounts in 2006. The real effective exchange rate (REER) for most EMEs has appreciated in the recent period; in June 2007, the year-on-year real appreciation ranged from 0.9 per cent (Korea) to 14.3 per cent (Philippines). Although the Centre’s fiscal deficit in India declined during 2006-07 and is budgeted to decline further during 2007-08, it would remain higher than the most EMEs.
Table 29: Key Macroeconomic Indicators: Emerging Markets |
(Per cent) |
Country |
Consumer Price |
Current Account |
Real Effective |
Central Govt. Fiscal |
Real Policy |
Real GDP |
|
Inflation |
Balance (per cent to GDP) |
Exchange Rate (REER) |
Balance (per cent of GDP) |
Rate |
Growth |
|
June |
June |
|
|
June |
June |
|
|
July |
July |
|
|
|
2006 |
2007 |
2005 |
2006 |
2006 |
2007 |
2005 |
2006 |
2006 |
2007 |
2005 |
2006 |
1 |
2 |
3 |
4 |
5 |
6 |
7 |
8 |
9 |
10 |
11 |
12 |
13 |
Brazil |
4.0 |
3.7 |
1.6 |
1.3 |
6.8 |
13.7 |
-3.4 |
-3.2 |
10.8 |
7.8 |
2.9 |
3.7 |
China |
1.5 |
4.4 |
7.2 |
9.1 |
1.6 |
4.7 |
-1.3 |
-0.7 |
4.9 |
2.4 |
10.4 |
11.1 |
|
|
|
|
|
|
|
(17.9) |
(17.3) |
|
|
|
|
India |
6.3 |
6.6 * |
-1.1 |
-1.1 |
-4.8 |
12.0 |
-4.1 |
-3.5 |
0.3 |
1.2 |
9.0 |
9.4 |
|
(5.2) |
(4.3) |
(-6.4) |
(-7.1) |
|
|
(63.9) |
(63.4) |
(2.3) |
(3.3) |
|
|
Indonesia |
15.5 |
5.8 |
0.1 |
2.7 |
14.6 |
6.1 |
-0.5 |
-1.0 |
-3.0 |
2.5 |
5.7 |
5.5 |
|
|
|
|
|
|
|
(46.5) |
(40.9) |
|
|
|
|
Israel |
3.5 |
-0.7 |
2.9 |
5.2 |
-0.8 |
-0.8 |
-2.9 |
-2.7 |
2.9 |
4.2 |
5.2 |
5.1 |
Korea |
2.4 |
2.5 |
1.9 |
0.7 |
5.2 |
0.9 |
1.9 |
1.8 |
2.0 |
2.3 |
4.2 |
5.0 |
|
|
|
|
|
|
|
(29.5) |
(32.2) |
|
|
|
|
Philippines |
6.7 |
2.3 |
2.0 |
2.9 |
7.5 |
14.3 |
-2.7 |
-1.0 |
1.1 |
3.7 |
5.0 |
5.4 |
Russia |
9.1 |
8.5 |
10.9 |
9.8 |
10.0 |
4.6 |
7.5 |
7.5 |
2.2 |
1.5 |
6.4 |
6.7 |
South Africa |
3.9 |
6.9 * |
-3.8 |
-6.4 |
-3.0 |
-2.1 |
-- |
-- |
2.5 |
2.6 |
5.1 |
5.0 |
Thailand |
5.9 |
1.9 |
-4.5 |
1.6 |
9.6 |
8.9 |
0.2 |
0.1 |
0.6 |
1.4 |
4.5 |
5.0 |
|
|
|
|
|
|
|
(26.1) |
(27.3) |
|
|
|
|
Table 30: International Commodity Prices |
|
|
Unit |
2004 |
|
|
Index |
|
|
Variation (per cent) |
Commodity |
|
|
|
2004 |
2005 |
2006 |
|
2007 |
|
June 2007/ |
June 2007/ |
|
|
|
|
|
|
|
|
|
|
March 2007 |
June 2006 |
|
|
|
|
|
|
January- |
March |
June |
|
|
|
|
|
|
|
|
|
June |
|
|
|
|
1 |
|
2 |
3 |
4 |
5 |
6 |
7 |
8 |
9 |
10 |
11 |
Coal |
|
$/mt |
53.0 |
100 |
90 |
93 |
105 |
105 |
114 |
9.0 |
15.3 |
Crude oil (Average) |
$/bbl |
37.7 |
100 |
142 |
170 |
163 |
161 |
181 |
12.5 |
-0.1 |
Palm oil |
|
$/mt |
471.3 |
100 |
90 |
102 |
146 |
132 |
171 |
29.7 |
84.7 |
Soybean oil |
|
$/mt |
616.0 |
100 |
88 |
97 |
122 |
117 |
135 |
15.7 |
38.3 |
Soybeans |
|
$/mt |
306.5 |
100 |
90 |
88 |
107 |
105 |
118 |
12.1 |
35.2 |
Rice |
|
$/mt |
237.7 |
100 |
120 |
128 |
133 |
134 |
136 |
1.4 |
3.5 |
Wheat |
|
$/mt |
156.9 |
100 |
97 |
122 |
129 |
127 |
142 |
12.0 |
14.2 |
Sugar |
|
c/kg |
15.8 |
100 |
138 |
206 |
140 |
146 |
130 |
-11.0 |
-39.7 |
Cotton A Index |
|
c/kg |
136.6 |
100 |
89 |
93 |
93 |
94 |
94 |
0.0 |
5.9 |
Aluminium |
|
$/mt |
1716.0 |
100 |
111 |
150 |
162 |
161 |
156 |
-3.1 |
8.1 |
Copper |
|
$/mt |
2866.0 |
100 |
128 |
235 |
237 |
225 |
261 |
15.8 |
3.8 |
Gold |
|
$/toz |
409.2 |
100 |
109 |
148 |
161 |
160 |
160 |
0.1 |
10.0 |
Silver |
|
c/toz |
669.0 |
100 |
110 |
173 |
199 |
197 |
196 |
-0.2 |
22.0 |
Steel cold-rolled coil/sheet |
$/mt |
607.1 |
100 |
121 |
114 |
107 |
107 |
107 |
0.0 |
0.0 |
Steel hot-rolled coil/sheet |
$/mt |
502.5 |
100 |
126 |
119 |
109 |
109 |
109 |
0.0 |
-4.3 |
Tin |
|
c/kg |
851.3 |
100 |
87 |
103 |
158 |
163 |
166 |
1.5 |
78.6 |
Zinc |
|
c/kg |
104.8 |
100 |
132 |
313 |
340 |
312 |
344 |
10.1 |
11.7 |
$ : US dollar. c : US cent. bbl : barrel. mt : metric tonne. kg: Kilogram. toz: troy oz.
Source : Based on World Bank's actual commodity price data. The year 2004 has been taken as the base to better exhibit price trends over the relevant period. |
Global Commodity Prices
Commodity prices firmed up further in the first quarter of 2007-08 led by crude oil, metals and edible oil (Table 30 and Chart 18).
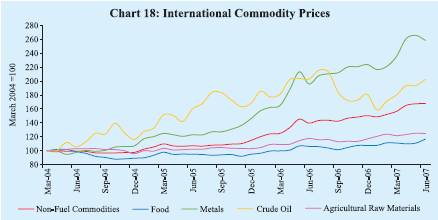
International crude oil prices (WTI) rose during the first quarter of 2007-08 reflecting limited spare capacity, renewed interest by hedge funds and concerns over supply disruptions due to strike in Nigeria (Table 31 and Table 32). The two rounds of production cuts by the Organisation of Petroleum Exporting Countries (OPEC) effected during November 2006 (1.2 million barrels per day) and February 2007 (0.5 million barrels per day) also supported prices. WTI crude prices increased to US $ 76 a barrel on July 19, 2007 from around US $ 60 a barrel level in March 2007. During the first quarter, UK Brent and Dubai crude prices –and hence the Indian basket price – recorded higher increases vis-à-vis WTI crude prices. During April-June 2007, Brent prices were US $ 3.8 a barrel above WTI prices while the premium of the WTI over Dubai variety was only US $ 0.25 a barrel. Typically, WTI prices have been higher than other varieties. For instance, during the six-year period, 2001-02 to 2006-07, WTI prices, on average, were US $ 1.7 a barrel above Brent and US $ 4.8 a barrel above Dubai crude.
Metal prices firmed up further during the first quarter of 2007-08 on the back of robust demand and supply constraints amidst speculative investor interest. Between March 2007 and June 2007, prices of lead and copper rose by 27 per cent and 16 per cent, respectively. On a year-on-year basis, prices of lead, nickel and tin during June 2007 were higher by about 152 per cent, 101 per cent and 79 per cent, respectively.
Increases in food prices during the first quarter of 2007-08 were led by oilseeds/edible oils, reflecting a shortfall in global production and rising demand for non-food uses. According to the latest assessment by the US Department of Agriculture (USDA), world vegetable oils stocks were forecast to fall by 13 per cent
Table 31: International Crude Oil Prices |
(US dollars per barrel) |
Year/Month |
Dubai Crude |
UK Brent |
US WTI |
Average
Crude Price |
Indian Basket Price |
1 |
2 |
3 |
4 |
5 |
6 |
2001-02 |
21.8 |
23.2 |
24.1 |
23.0 |
22.4 |
2002-03 |
25.9 |
27.6 |
29.2 |
27.6 |
26.6 |
2003-04 |
26.9 |
29.0 |
31.4 |
29.1 |
27.8 |
2004-05 |
36.4 |
42.2 |
45.0 |
41.3 |
38.9 |
2005-06 |
53.4 |
58.0 |
59.9 |
57.1 |
55.4 |
2006-07 |
60.9 |
64.4 |
64.7 |
63.3 |
62.4 |
March 2004 |
30.5 |
33.8 |
36.7 |
33.7 |
31.9 |
March 2005 |
45.6 |
53.1 |
54.2 |
50.9 |
48.8 |
March 2006 |
57.7 |
62.3 |
62.9 |
60.9 |
59.6 |
March 2007 |
59.1 |
62.1 |
60.6 |
60.6 |
60.4 |
April 2007 |
63.8 |
67.4 |
63.9 |
65.1 |
65.4 |
May 2007 |
64.5 |
67.5 |
63.5 |
65.2 |
65.8 |
June 2007 |
65.8 |
71.3 |
67.5 |
68.2 |
68.2 |
Source : International Monetary Fund and the World Bank. |
Table 32: World Supply-Demand Balance of Oil |
(Million barrels per day) |
Item |
|
2003 |
2004 |
2005 |
2006 |
2007
(P) |
2008
(P) |
|
2007 P |
|
|
|
|
|
|
|
|
|
Q1 |
Q2 |
Q3 |
Q4 |
1 |
|
2 |
3 |
4 |
5 |
6 |
7 |
8 |
9 |
10 |
11 |
Demand |
1. OECD |
|
48.7 |
49.5 |
49.6 |
49.1 |
49.4 |
49.6 |
49.5 |
48.2 |
49.3 |
50.4 |
2. Non-OECD |
31.2 |
33.0 |
34.4 |
35.4 |
36.6 |
37.8 |
36.0 |
36.4 |
36.6 |
37.2 |
of which: |
China |
5.6 |
6.5 |
6.9 |
7.3 |
7.8 |
8.3 |
7.5 |
7.8 |
7.8 |
8.1 |
3. Total (1+2) |
79.9 |
82.5 |
84.0 |
84.6 |
85.9 |
87.4 |
85.5 |
84.7 |
85.9 |
87.6 |
Supply |
4. Non-OPEC |
48.9 |
50.1 |
50.3 |
49.2 |
49.9 |
50.8 |
49.6 |
49.5 |
49.9 |
50.4 |
5. OPEC |
|
30.7 |
32.9 |
34.2 |
35.3 |
35.2 |
36.7 |
34.5 |
34.7 |
35.3 |
36.2 |
6. Total (4+5) |
79.6 |
83.1 |
84.5 |
84.5 |
85.1 |
87.5 |
84.1 |
84.3 |
85.2 |
86.6 |
Stock Changes |
0.3 |
-0.6 |
-0.5 |
0.0 |
0.9 |
-0.1 |
1.4 |
0.4 |
0.7 |
1.0 |
P : Projections.
Source : US Energy Information Administration. |
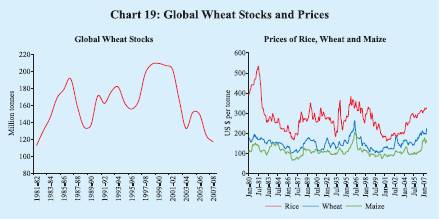
during 2006-07 and by an additional 8 per cent in 2007-08. Edible oil prices hardened by 16-30 per cent between March 2007 and June 2007; on a y-o-y basis, prices in June 2007 were higher by 38-85 per cent. Amongst other food items, prices of wheat rose by 12 per cent between March 2007 and June 2007. According to the USDA, although global wheat production is expected to increase by 3.3 per cent in 2007-08 (June-May), global wheat stocks are likely to decline further in 2007-08 to 116.6 million tonnes - their lowest levels since 1981-82 (Chart 19). Rice stocks are also expected to decline by about 5 per cent during 2007-08. The overall food price index compiled by the IMF increased by about 10 per cent in June 2007 (y-o-y) on top of an increase of 12 per cent a year ago. The IMF’s food price index in June 2007 has been the highest since early 1981.
The decline in international sugar prices that began in August 2006 continued through the first quarter of 2007-08 on forecasts of higher global production during 2006-07 season (October-September). Sugar prices fell by 11 per cent during April-June 2007 and have almost halved from the recent peak touched in February 2006. According to the International Sugar Organisation, global sugar production is estimated to increase by 10.5 million tonnes to 162.6 million tonnes during 2006-07 season, exceeding global consumption by 9.1 million tonnes. A record crop in Brazil, the world’s largest producer, significant growth in sugar output in countries such as Bangladesh, Thailand and Vietnam along with higher production in India are expected to more than offset the contraction in the output in the European Union. Global cotton prices have largely remained unchanged since March 2007, but are expected to harden during 2007-08 reflecting shortfalls in production. According to the latest assessment by the International Cotton Advisory Committee (ICAC), the cotlook A index is expected to increase by about 12 per cent during 2007-08 due to an estimated decline in world cotton stocks by 13 per cent to 10.6 million tonnes in 2007-08.
Inflation Conditions in India
The Annual Policy Statement for 2007-08 (April 2007) of the Reserve Bank observed that the stance of monetary policy in 2007-08 would be conditioned by the patterns in which the global and, more particularly, the domestic environment unfold. It further observed that the likely evolution of macroeconomic and financial conditions indicated an environment supportive of sustaining the growth momentum in India. The Statement reiterated that monetary policy, while contributing to growth, had to ensure and maintain conditions of price and financial stability. Accordingly, the policy preference for the period ahead was articulated strongly in favour of reinforcing the emphasis on price stability and anchoring inflation expectations.
In view of the lagged and cumulative effects of monetary policy on aggregate demand and assuming that supply management would be conducive, capital flows would be managed actively and in the absence of shocks emanating in the domestic or global economy, the Statement noted that the policy endeavour would be to contain inflation close to 5.0 per cent in 2007-08. In recognition of India’s evolving integration with the global economy and societal preferences in this regard, the resolve, going forward, would be to condition policy and perceptions for inflation in the range of 4.0–4.5 per cent. This objective would be conducive for maintaining self-accelerating growth over the medium-term.
As announced on March 30, 2007, the cash reserve ratio (CRR) was raised by another 50 basis points in two stages of 25 basis points each effective April 14, 2007 and April 28, 2007 - a cumulative increase of 150 basis points beginning December 2006 (Table 33).
Table 33: Movement in Key Policy Rates and Inflation in India |
(Per cent) |
Effective since |
Reverse
Repo Rate |
Repo Rate |
Cash Reserve Ratio |
WPI Inflation |
1 |
2 |
3 |
|
4 |
|
5 |
March 31, 2004 |
4.50 |
6.00 |
|
4.50 |
|
4.6 |
September 18, 2004 |
4.50 |
6.00 |
|
4.75 |
(+0.25) |
7.9 |
October 2, 2004 |
4.50 |
6.00 |
|
5.00 |
(+0.25) |
7.1 |
October 27, 2004 |
4.75 (+0.25) |
6.00 |
|
5.00 |
|
7.4 |
April 29, 2005 |
5.00 (+0.25) |
6.00 |
|
5.00 |
|
6.0 |
October 26, 2005 |
5.25 (+0.25) |
6.25 |
(+0.25) |
5.00 |
|
4.5 |
January 24, 2006 |
5.50 (+0.25) |
6.50 |
(+0.25) |
5.00 |
|
4.2 |
June 9, 2006 |
5.75 (+0.25) |
6.75 |
(+0.25) |
5.00 |
|
4.9 |
July 25, 2006 |
6.00 (+0.25) |
7.00 |
(+0.25) |
5.00 |
|
4.7 |
October 31, 2006 |
6.00 |
7.25 |
(+0.25) |
5.00 |
|
5.3 |
December 23, 2006 |
6.00 |
7.25 |
|
5.25 |
(+0.25) |
5.8 |
January 6, 2007 |
6.00 |
7.25 |
|
5.50 |
(+0.25) |
6.4 |
January 31, 2007 |
6.00 |
7.50 |
(+0.25) |
5.50 |
|
6.7 |
February 17, 2007 |
6.00 |
7.50 |
|
5.75 |
(+0.25) |
6.0 |
March 3, 2007 |
6.00 |
7.50 |
|
6.00 |
(+0.25) |
6.5 |
March 30, 2007 |
6.00 |
7.75 |
(+0.25) |
6.00 |
|
6.5 |
April 14, 2007 |
6.00 |
7.75 |
|
6.25 |
(+0.25) |
6.3 |
April 28, 2007 |
6.00 |
7.75 |
|
6.50 |
(+0.25) |
6.0 |
Note :
1. With effect from October 29, 2004, the nomenclature of repo and reverse repo was changed in keeping with international usage.
Now, reverse repo indicates absorption of liquidity and repo signifies injection of liquidity. Prior to October 29, 2004, repo indicated absorption of liquidity, while reverse repo meant injection of liquidity. The nomenclature in this Report is based on the new usage of terms even for the period prior to October 29, 2004.
2. Figures in parentheses indicate change in policy rates. |
Wholesale Price Inflation
Headline inflation, based on movement in the wholesale price index (WPI), eased to 4.4 per cent (y-o-y) as on July 14, 2007 from 5.9 per cent at end-March 2007 (and 4.6 per cent a year ago). The y-o-y inflation excluding fuel, at 6.1 per cent, was above the headline inflation rate (Chart 20 and Table 34). Headline inflation has
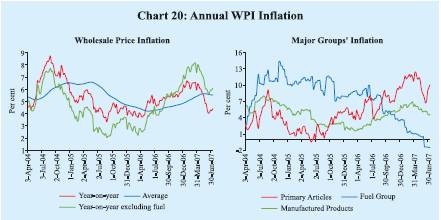
Table 34: Wholesale Price Inflation in India (year-on-year) |
(Per cent) |
Commodity |
|
2006-07 |
2006-07 |
2007-08 P |
|
|
(March 31) |
(July 15) |
(July 14) |
|
Weight |
Inflation |
WC |
Inflation |
WC |
Inflation |
WC |
1 |
2 |
3 |
4 |
5 |
6 |
7 |
8 |
All Commodities |
100.0 |
5.9 |
100.0 |
4.6 |
100.0 |
4.4 |
100.0 |
1. |
Primary Articles |
22.0 |
10.7 |
39.0 |
3.8 |
18.1 |
10.0 |
49.7 |
|
Food Articles |
15.4 |
8.0 |
20.8 |
2.6 |
8.9 |
9.0 |
31.3 |
|
i. |
Rice |
2.4 |
5.7 |
2.1 |
0.7 |
0.4 |
5.6 |
2.7 |
|
ii. |
Wheat |
1.4 |
7.3 |
1.8 |
7.8 |
2.2 |
11.1 |
3.4 |
|
iii. |
Pulses |
0.6 |
12.5 |
1.4 |
29.7 |
3.7 |
1.7 |
0.3 |
|
iv. |
Vegetables |
1.5 |
1.2 |
0.3 |
-9.2 |
-3.5 |
22.4 |
7.8 |
|
v. |
Fruits |
1.5 |
5.7 |
1.8 |
-5.7 |
-2.0 |
3.1 |
1.1 |
|
vi. |
Milk |
4.4 |
8.4 |
5.8 |
3.7 |
3.3 |
7.7 |
7.2 |
|
vii. |
Eggs, Meat and Fish |
2.2 |
9.4 |
3.8 |
-1.9 |
-1.1 |
10.0 |
5.5 |
|
Non-Food Articles |
6.1 |
17.2 |
15.6 |
1.4 |
1.7 |
12.6 |
15.9 |
|
i. |
Raw Cotton |
1.4 |
21.9 |
3.5 |
3.6 |
0.8 |
16.9 |
3.8 |
|
ii. |
Oilseeds |
2.7 |
31.6 |
11.0 |
-6.2 |
-3.3 |
29.8 |
14.6 |
|
iii. |
Sugarcane |
1.3 |
1.1 |
0.3 |
0.7 |
0.2 |
1.1 |
0.4 |
|
Minerals |
0.5 |
17.5 |
2.6 |
52.8 |
7.6 |
11.4 |
2.5 |
|
|
|
|
|
|
|
|
|
|
2. |
Fuel, Power, Light and Lubricants |
14.2 |
1.0 |
4.0 |
7.2 |
34.8 |
-1.4 |
-7.4 |
|
i. |
Mineral Oils |
7.0 |
0.5 |
1.1 |
13.1 |
35.6 |
-3.7 |
-11.3 |
|
ii. |
Electricity |
5.5 |
2.3 |
2.8 |
-0.6 |
-0.9 |
2.4 |
3.9 |
|
iii. |
Coal Mining |
1.8 |
0.0 |
0.0 |
0.0 |
0.0 |
0.0 |
0.0 |
3. |
Manufactured Products |
63.7 |
6.1 |
57.3 |
3.9 |
47.5 |
4.6 |
58.1 |
|
i. |
Food Products |
11.5 |
6.1 |
10.5 |
2.0 |
4.5 |
2.5 |
5.9 |
|
|
of which: Sugar |
3.6 |
-12.7 |
-6.6 |
6.3 |
4.1 |
-17.9 |
-12.3 |
|
|
Edible Oils |
2.8 |
14.1 |
4.7 |
-0.5 |
-0.2 |
15.8 |
7.2 |
|
ii. |
Cotton Textiles |
4.2 |
-1.0 |
-0.6 |
3.8 |
2.7 |
1.1 |
0.8 |
|
iii. |
Man Made Fibres |
4.4 |
3.9 |
1.3 |
2.2 |
1.0 |
1.2 |
0.5 |
|
iv. |
Chemicals and Chemical Products |
11.9 |
3.6 |
7.1 |
4.5 |
11.1 |
3.9 |
9.9 |
moved in a range of 4.0-6.4 per cent during 2007-08 so far. The annual average WPI inflation rate (average of the 52 weeks) for the week ended July 14, 2007 was 5.5 per cent as compared with 5.4 per cent at end-March 2007 and 4.3 per cent a year ago.
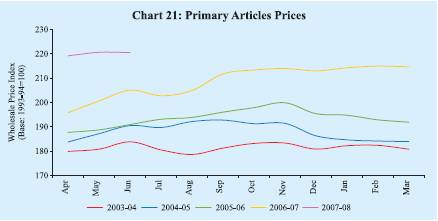
Primary articles’ inflation (10.0 per cent on July 14, 2007) eased from end-March 2007 level (10.7 per cent) but was higher than the previous year’s level (3.8 per cent). Primary articles’ inflation, y-o-y, was led by wheat, vegetables, eggs, fish and meat, milk, oilseeds and raw cotton. Wheat prices increased marginally by 0.4 per cent between end-March and July 14, 2007, but were higher by 11.1 per cent on y-o-y basis. Prices of oilseeds have increased by 29.8 per cent, y-o-y, as against a decline of 6.2 per cent a year ago, which could be attributed to lower domestic production as well as firm global prices. Raw cotton prices were 16.9 per cent higher, y-o-y, as on July 14, 2007 as compared with 3.6 per cent in the previous year (Chart 21).
Fuel group inflation turned negative (-1.4 per cent), y-o-y, on July 14, 2007 from 7.2 per cent a year ago, reflecting the cuts in domestic prices of petrol, diesel and other fuel products in November 2006 and February 2007. While domestic prices have remained unchanged since February 2007, international crude prices (WTI) have increased by over 20 per cent over the same period.
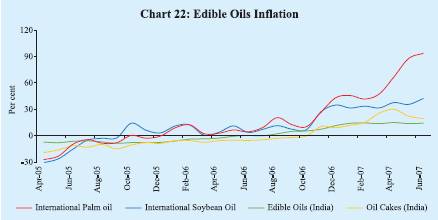
Manufactured products inflation at 4.6 per cent as on July 14, 2007 was higher than a year ago (3.9 per cent), although lower than that of 6.1 per cent at end-March 2007. Manufactured products inflation was led by edible oils (y-o-y increase of 15.8 per cent), oil cakes (22.7 per cent), metals (6.4 per cent), cement (11.1 per cent) and electrical machinery (16.3 per cent), partly offset by decline in sugar prices (17.9 per cent) (see Table 34). Edible oils, oil cakes, metals, cement and electrical machinery together contributed 43 per cent of the overall WPI inflation on July 14, 2007. The rise in domestic prices of metals broadly mirrored the hardening trends in the international markets. Higher prices of cement could be attributed largely to the strong demand from the construction sector and high capacity utilisation in the cement industry (98 per cent during 2007-08 (April-June) as compared with 95 per cent a year ago). The rise in electrical machinery prices reflected higher input prices as well as investment demand. The firming up of domestic edible oils and oil cakes prices reflected lower domestic output and rise in international prices (Chart 22). Edible oils and oil cakes along with oilseeds accounted for more than one-fourth of headline inflation on July 14, 2007.
In order to contain inflationary pressures, the Government continued to take fiscal measures during 2007-08. On April 3, 2007, the Government decided to exempt import of portland cement from countervailing duty and special additional customs duty; it was earlier exempted from basic customs duty in January 2007. On July 23, 2007, the Government reduced the import duty on palm oils by five percentage points - from 50 per cent to 45 per cent in case of crude palm oil and from 57.5 per cent to 52.5 per cent in case of refined palm oil.
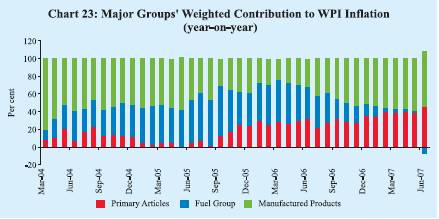
Overall, manufactured products were the major driver of domestic inflation as on July 14, 2007 (with weighted contribution of 58.1 per cent) followed by primary articles (49.7 per cent) (Chart 23). The fuel group’s contribution to the y-o-y headline inflation, on the other hand, was negative at 7.4 per cent.
Consumer Price Inflation
Consumer price inflation eased during the first quarter of 2007-08, but remained higher than WPI inflation. Moderation in consumer price inflation during the quarter could be attributed to some lowering of food price inflation. Disaggregated data show that food group inflation in various CPI measures eased to 7.7-9.2 per cent by May/June 2007 from 10.9-12.2 per cent in March 2007 and 8.0-10.0 per cent a year ago (Table 35). Various measures of consumer price inflation were placed in the range of 6.1-7.8 per cent during May/June 2007 as compared with 6.7-9.5 per cent in March 2007.
Table 35: Consumer Price Inflation : Major Groups |
(Year-on-year variation in per cent) |
CPI Measure |
Weight |
|
March |
March |
March |
March |
March |
June |
|
|
|
2003 |
2004 |
2005 |
2006 |
2007 |
2007 |
1 |
2 |
|
3 |
4 |
5 |
6 |
7 |
8 |
CPI-IW (Base: 2001=100) |
|
|
|
|
|
|
|
|
|
General |
100.0 |
|
4.1 |
3.5 |
4.2 |
4.9 |
6.7 |
6.6 * |
Food Group |
46.2 |
|
3.7 |
3.1 |
1.6 |
4.9 |
12.2 |
9.2 * |
Pan, Supari etc. |
2.3 |
|
1.9 |
4.2 |
2.1 |
3.1 |
4.4 |
9.6 * |
Fuel and Light |
6.4 |
|
6.3 |
6.5 |
4.9 |
-2.9 |
3.2 |
2.3 * |
Housing |
15.3 |
|
5.4 |
3.9 |
20.4 |
6.6 |
4.1 |
4.1* |
Clothing, Bedding, etc. |
6.6 |
|
1.5 |
2.1 |
2.3 |
3.0 |
3.7 |
3.5 * |
Miscellaneous |
23.3 |
|
5.3 |
3.2 |
3.9 |
4.6 |
3.3 |
3.2 * |
CPI-UNME (Base: 1984-85=100) |
General |
100.0 |
|
3.8 |
3.4 |
4.0 |
5.0 |
7.6 |
6.1 |
Food Group |
47.1 |
|
2.6 |
3.0 |
2.2 |
5.3 |
10.9 |
7.7 |
Fuel and Light |
5.5 |
|
3.1 |
3.2 |
9.6 |
1.9 |
6.4 |
7.2 |
Housing |
16.4 |
|
6.3 |
5.2 |
7.5 |
5.5 |
5.6 |
5.6 |
Clothing, Bedding, etc. |
7.0 |
|
2.6 |
2.6 |
2.0 |
2.9 |
3.6 |
4.3 |
Miscellaneous |
24.0 |
|
6.0 |
2.8 |
4.4 |
5.1 |
4.4 |
3.7 |
CPI-AL (Base: 1986-87=100) |
General |
100.0 |
|
4.9 |
2.5 |
2.4 |
5.3 |
9.5 |
7.8 |
Food Group |
69.2 |
|
6.0 |
1.6 |
2.2 |
5.5 |
11.8 |
8.8 |
Pan, Supari etc. |
3.8 |
|
3.5 |
4.7 |
-1.3 |
6.6 |
5.7 |
9.1 |
Fuel and Light |
8.4 |
|
4.8 |
3.0 |
3.0 |
4.3 |
6.9 |
7.4 |
Clothing, Bedding, etc. |
7.0 |
|
3.0 |
4.1 |
2.5 |
2.2 |
3.5 |
2.7 |
Miscellaneous |
11.7 |
|
3.1 |
2.7 |
5.5 |
5.5 |
6.8 |
6.7 |
CPI-RL (Base: 1986-87=100) |
General |
100.0 |
|
4.8 |
2.5 |
2.4 |
5.3 |
9.2 |
7.5 |
Food Group |
66.8 |
|
5.6 |
1.9 |
1.9 |
5.8 |
11.5 |
8.5 |
Pan, Supari etc. |
3.7 |
|
3.5 |
4.7 |
-1.0 |
6.3 |
5.7 |
9.3 |
Fuel and Light |
7.9 |
|
4.8 |
3.0 |
2.9 |
4.0 |
6.9 |
7.4 |
Clothing, Bedding, etc. |
9.8 |
|
3.3 |
3.4 |
2.8 |
2.7 |
3.1 |
2.6 |
Miscellaneous |
11.9 |
|
3.1 |
3.0 |
5.5 |
5.2 |
6.3 |
6.2 |
Memo: |
|
|
|
|
|
|
|
|
WPI Inflation (End of period) |
|
|
6.5 |
4.6 |
5.1 |
4.1 |
5.9 |
4.3 |
GDP Deflator |
|
|
3.9 |
3.7 |
4.2 |
4.4 |
5.3 |
– |
* : May 2007.
IW : Industrial Workers. UNME : Urban Non-Manual Employees.
AL : Agricultural Labourers. RL : Rural Labourers. |
Asset Prices
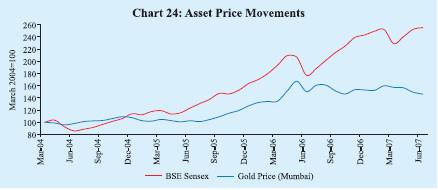
Domestic equity prices (the BSE Sensex) recorded gains of 20.7 per cent between end-March 2007 and July 26, 2007 (see Chapter V). International gold prices increased by around three per cent during 2007-08 (up to July 26, 2007); prices moved in a range of US $ 640-691 per ounce (Chart 24). Domestic gold prices declined by about 6 per cent over the same period (to around Rs.8,875 per 10 grams), which could be attributed to appreciation of the Indian rupee vis-à-vis the US dollar.
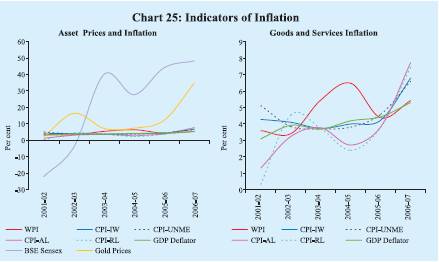
Increase in asset prices in recent years has been significantly higher than that in inflation indicators based on wholesale and consumer price indices (Chart 25).
|
 IST,
IST,


