Headline inflation generally edged up in major economies during the quarter ended September 2007 as compared with the previous quarter. Core inflation also remained firm reflecting the combined impact of high commodity prices and strong demand conditions. During July 1, 2007 to October 24, 2007, several central banks (such as the Bank of England, Bank of Canada, Reserve Bank of Australia, Reserve Bank of New Zealand, Norges Bank (Norway), Sveriges Riksbank (Sweden), South African Reserve Bank, the Bank of Israel, the Bank of Korea and People’s Bank of China) have further raised policy rates to contain inflation and inflationary expectations. The central bank of China also raised cash reserve requirements to address concerns regarding excess liquidity. On the other hand, central banks of Thailand, Indonesia, Turkey and Brazil have eased monetary policy during July 1, 2007 to October 24, 2007, in view of easing of inflationary pressures. After keeping its policy rate unchanged for more than a year, the US Fed also, in September 2007, reduced its target for the federal funds rate to help forestall some of the possible adverse effects of disruptions in financial markets on the broader economy. The discount rate in the US was also reduced to improve market liquidity.
In India, inflation based on the wholesale price index (WPI) eased below 4 per cent from mid-August 2007 to 3.1 per cent by October 6, 2007, partly due to base effects and negative contribution from fuel prices. Pre-emptive monetary measures since mid-2004 accompanied by fiscal and supply-side measures have helped in containing inflation. Consumer price inflation, however, remained firm during the second quarter of 2007-08 and continued to be above the WPI inflation, mainly reflecting the impact of higher food prices. Various measures of consumer price inflation were placed in the range of 5.7-7.9 per cent during August/ September 2007 as compared with 5.7-7.8 per cent in June 2007 (and 6.7-9.5 per cent in March 2007).
Global Inflation
Headline inflation in major advanced economies generally edged up towards the end of the second quarter of 2007-08, mainly reflecting hardening of food and fuel prices in the US, and clothing and education in the euro area. On the other hand, headline inflation in the UK eased due to downward contributions from housing and household services. Amongst major economies, headline inflation in September 2007 was 2.8 per cent in the US, 1.8 per cent in the UK and 2.1 per cent in the euro area as compared with 2.7 per cent, 2.4 per cent and 1.9 per cent, respectively, in June 2007 (Chart 16). Inflation fell to 1.8 per cent in August 2007 in the OECD countries from 2.2 per cent in June 2007 and 2.4 per cent in
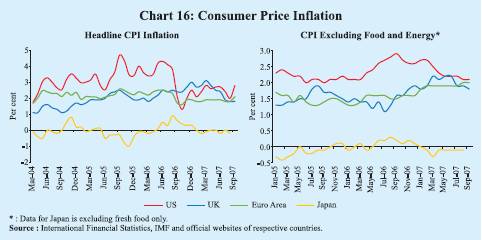
March 2007. Core inflation remained firm in major economies, reflecting strong demand conditions. In the US, CPI inflation (excluding food and energy) was 2.1 per cent in September 2007 (2.2 per cent in June 2007). In the OECD countries, CPI inflation (excluding food and energy) was 2.0 per cent in August 2007, same as in June 2007.
Many central banks further tightened monetary policy during the second quarter of 2007-08 against the backdrop of persistent inflationary pressures represented by core inflation, especially in view of continued strength of demand, ample liquidity and possible pass-through from past and present increases in oil and other commodity prices. In the UK, in view of steady growth in output, continued rapid growth in credit and broad money, limited spare capacity in businesses and elevated most indicators of pricing pressure, the risks to the outlook for inflation in the medium term were seen to lie on the upside. The Bank of England, therefore, raised its policy rate by 25 basis points on July 5, 2007 to 5.75 per cent – a cumulative increase of 125 basis points since the tightening began in August 2006 (Table 27). Notwithstanding some easing in inflation, however, the policy rate was left unchanged recognising the greater uncertainty in the outlook on inflation and growth following the turmoil in international financial markets begining August 2007.
In the euro area, risks to the price outlook were seen on the upside from increases in indirect taxes beyond those anticipated thus far and further increases in the prices of oil and agricultural products as well as stronger than expected wage developments and increase in the pricing power. The European Central Bank (ECB) viewed its monetary policy to be still on the accommodative mode with, inter alia, money and credit growth vigorous in the euro area amidst an
Table 27: Global Inflation Indicators |
(Per cent) |
Country/ |
Key Policy Rate |
Policy Rate |
Changes in |
|
CPI |
Real GDP |
Region |
|
(As on October |
Policy Rates |
|
Inflation |
Growth |
|
|
24, 2007) |
(basis points) |
|
(y-o-y) |
(y-o-y) |
|
|
|
2005-06 |
2006-07 |
Since |
Sep. |
Sep. |
2006 |
2007 |
|
|
|
(April- |
(April- |
end- |
2006 |
2007 |
(Q2) |
(Q2) |
|
|
|
March) |
March) |
March
2007 |
|
|
|
|
1 |
2 |
3 |
4 |
5 |
6 |
7 |
8 |
9 |
10 |
Developed Economies |
|
|
|
|
|
|
|
|
Australia |
Cash Rate |
6.50 (Aug. 8, 2007) |
0 |
75 |
25 |
4.0 |
2.1# |
1.9 |
4.3 |
Canada |
Overnight Rate |
4.50 (July 10, 2007) |
125 |
50 |
25 |
2.1 |
1.7* |
2.9 |
2.5 |
Euro area |
Interest Rate on |
|
|
|
|
|
|
|
|
|
Main Refinancing |
4.00 (June 6, 2007) |
50 |
125 |
25 |
1.7 |
2.1 |
2.7 |
2.5 |
|
Operations |
|
|
|
|
|
|
|
|
Japan |
Uncollateralised |
0.50 (Feb. 21, 2007) |
0 ** |
50 |
0 |
0.9 |
-0.2* |
2.1 |
1.6 |
|
Overnight Call Rate |
|
|
|
|
|
|
|
|
UK |
Official Bank Rate |
5.75 (July 5, 2007) |
(-)25 |
75 |
50 |
2.4 |
1.8 |
2.7 |
3.1 |
US |
Federal Funds Rate |
4.75 (Sep. 18, 2007) |
200 |
50 |
(-)50 |
2.1 |
2.8 |
3.2 |
1.9 |
Developing Economies |
Brazil |
Selic Rate |
11.25 (Sep. 5, 2007) |
(-)275 |
(-)375 |
(-) 150 |
3.7 |
4.1 |
1.1 |
5.4 |
India |
Reverse Repo Rate |
6.00 (July 25, 2006) |
75 |
50 |
0 |
6.3 |
7.3* |
9.6 |
9.3 |
|
Repo Rate |
7.75 (Mar. 30, 2007) |
50 |
125 |
0 |
|
|
|
|
|
|
|
(0) |
(100) |
(100) |
|
|
|
|
China |
Benchmark 1-year |
7.29 (Sep. 18, 2007) |
|
81 |
90 |
1.5 |
6.2 |
10.9 |
11.5 |
|
Lending Rate |
|
|
(250) |
(300) + |
|
|
|
Indonesia |
BI Rate |
8.25 (July 5, 2007) |
425@ |
(-)375 |
(-)75 |
14.5 |
7.0 |
5.0 |
6.3 |
Israel |
Key Rate |
4.00 (Aug 27, 2007) |
125 |
(-)75 |
0 |
1.3 |
1.4 |
5.2 |
4.4 |
Korea |
Overnight Call Rate |
5.00 (Aug. 9, 2007) |
75 |
50 |
50 |
2.5 |
2.3 |
5.1 |
5.0 |
|
|
|
|
(80) |
|
|
|
|
|
Philippines |
Reverse Repo Rate |
5.75 (Oct. 4, 2007) & |
50 |
0 |
(-)175 |
5.7 |
2.7 |
5.5 |
7.5 |
Russia |
Refinancing Rate |
10.00 (June 19, 2007) |
(-)100 |
(-)150 |
(-)50 |
9.5 |
9.5 |
7.4 |
7.8 |
|
|
|
|
(150) |
(0) |
|
|
|
|
South Africa |
Repo Rate |
10.50 (Oct. 11, 2007) |
(-)50 |
200 |
150 |
5.4 |
6.7* |
3.6 |
5.0 |
Thailand |
14-day Repurchase Rate |
5.00 (June 7, 2006) |
225 |
50 |
|
|
|
|
|
|
1-day Repurchase Rate |
3.25 (July 18, 2007) |
|
(-)44 ^ |
(-)125 |
2.7 |
2.1 |
5.0 |
4.4 |
@ : Bank Indonesia adopted BI rate as the reference rate with the formal adoption of inflation targeting in July 2005.
** : The Bank of Japan decided on March 9, 2006 to change the operating target of money market operations from the
outstanding balance of current accounts at the Bank to the uncollateralised overnight call rate.
^ : Change over January 16, 2007. Effective January 17, 2007, the 1-day repurchase rate replaced the 14-day repurchase
rate as the policy rate.
# : Q2 of 2007. *: August 2007.
& : The tiering system on placements with the BSP was removed and interest rates were adjusted to 6.0 per cent for
the reverse repo rate and 8.0 per cent for the repo rate effective July 13, 2007.
+ : Including 50 basis points hike to be effective from October 25, 2007.
Note :
1. For India, data on inflation pertain to CPI for Industrial Workers.
2. Figures in parentheses in column (3) indicate the date when the policy rates were last revised.
3. Figures in parentheses in columns (5) and (6) indicate the variation in cash reserve ratios during the period.
Source : International Monetary Fund, websites of respective central banks and the Economist. |
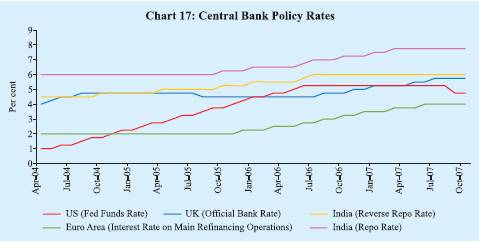
increase in uncertainty emanating from financial market volatility and reappraisal of risks of recent weeks. The ECB, therefore, observed caution in the context of medium-term-oriented monetary policy strategy aimed at delivering price stability and left the key policy rates unchanged during the quarter. The policy rate was last raised by 25 basis points on June 6, 2007 – a cumulative increase of 200 basis points since the tightening began in December 2005 (Chart 17). Amongst other major advanced economies, policy rates were raised (25 basis points each) by the Bank of Canada, the Reserve Bank of Australia, the Reserve Bank of New Zealand and the Sveriges Riksbank, and Norges Bank by 50 basis points during the second quarter of 2007-08.
In the US, growth was moderate during the first half of 2007. According to the Federal Open Market Committee (FOMC), the developments in financial markets since August 2007 have increased the uncertainty surrounding the economic outlook. Viewing that the tightening of credit conditions had the potential to intensify the housing correction and to restrain economic growth more generally, the FOMC cut its target for the federal funds rate by 50 basis points to 4.75 per cent on September 18, 2007 (it had kept the rate unchanged since June 2006) to forestall some of the adverse effects on the economy that might otherwise arise from the disruptions in financial markets. The discount rate was also cut by 50 basis points each on August 17, 2007 and September 18, 2007 to 5.25 per cent to improve market liquidity. Notwithstanding some moderation in core inflation during the quarter, the FOMC noted that some inflation risks remained and monitoring of inflation developments carefully would have to be continued. Against the backdrop of moderate expansion of the Japanese economy and consumer price inflation remaining low, the Bank of Japan (BoJ) kept its policy rate unchanged at each of its meetings held since
February 2007 when it had raised the uncollateralised overnight call rate (the operating target of monetary policy since March 2006) by 25 basis points to 0.50 per cent.
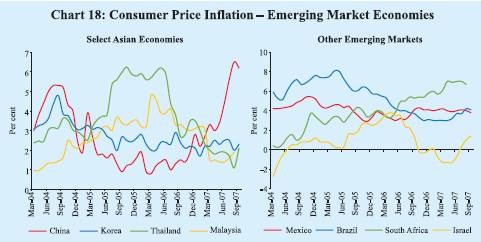
Amongst major emerging economies, consumer price inflation in China increased to 6.2 per cent in September 2007 (from 4.4 per cent in June 2007 and 1.5 per cent a year earlier) partly on the back of higher food prices (Chart 18). Economic activity has remained buoyant in 2007 so far with real GDP growth accelerating to 11.5 per cent during the second quarter of 2007 from 10.9 per cent a year ago. In view of strong growth in money supply and credit, the People’s Bank of China (PBC) increased the benchmark 1-year lending rate by 72 basis points since end-June 2007 - 27 basis points effective July 21, 2007, 18 basis points effective August 22, 2007 and 27 basis points effective September 18, 2007 - to 7.29 per cent, i.e., a total hike of 171 basis points since April 2006. Apart from continued issuances of its own bills to mop up liquidity, the PBC raised the cash reserve ratio (CRR) by another 150 basis points since end-June 2007 - 50 basis points each effective August 15, 2007 and September 25, 2007 and another 50 basis points to be effective October 25, 2007 - to 13.0 per cent. The CRR has, thus, been increased by 550 basis points since July 2006.
In Korea, inflation eased to 2.3 per cent in September 2007 from 2.5 per cent each in June 2007 (and September 2006) despite rise in international oil prices. Although the upward trend of real estate prices slowed down significantly, financial institutions’ lending increased sharply. Against the backdrop of the domestic economy likely to maintain its upward trend, ample liquidity in the financial markets and financial market prices showing increased volatility following the recent international financial market unrest, the Bank of Korea raised its policy rate by 50 basis points during the second quarter of 2007-08 -25 basis points each on July 12, 2007 and August 9, 2007 – to 5.0 per cent (a cumulative increase of 175 basis points since October 2005). In other major Asian emerging economies such as Thailand and Indonesia, inflation remained relatively benign. Inflation was moderate in Thailand, at 2.1 per cent in September 2007 as compared with 1.9 per cent in June 2007 (and 2.7 per cent a year ago). Real GDP growth also remained moderate, reflecting slowdown in exports and sluggishness in private spending. According to the Monetary Policy Committee (MPC), although the risks to domestic growth and inflation remained unchanged, risks to the global economy and financial markets increased as a result of rising concerns in the US subprime market. Therefore, after lowering the 1-day repurchase rate by 25 basis points to 3.25 per cent on July 18, 2007, the Bank of Thailand left it unchanged thereafter. Thus, the policy rate has been lowered by 169 basis points since January 17, 2007, partly reversing the earlier increase of 275 basis points between June 2005 and June 2006. In Indonesia, economic activity regained momentum and the trend was likely to continue in the next quarter due primarily to stronger performance in exports, private consumption and investment. Although headline inflation edged higher to 7.0 per cent by September 2007 from 5.8 per cent in June 2007 (it remained substantially lower than the peak of 18.4 per cent in November 2005), core inflation remained largely unchanged. The Bank Indonesia noted that it would closely monitor the impact on the domestic economy from the present difficulties in the sub-prime mortgage market and the likelihood of a US economic slowdown. It also observed that despite pressures bearing down on Indonesia’s financial markets and the exchange rate, financial system stability remained firm. Therefore, after cutting its policy rate by another 25 basis points to 8.25 per cent on July 5, 2007, the Bank Indonesia kept it unchanged since then. The policy rate had been cut by a total of 450 basis points since May 2006 to support growth. The policy rate had earlier been raised by 425 basis points during July-December 2005 to contain inflation.
Amongst other emerging economies, the South African Reserve Bank raised its policy rate by 100 basis points - 50 basis points each on August 16, 2007 and October 11, 2007 - to 10.50 per cent. The policy rate has been raised by 300 basis points since June 2006 to contain inflationary pressures emanating from oil and food prices and high rates of household consumption expenditure. The MPC noted that the recent financial market developments in some of the developed economies have had a spill-over effect on emerging markets including South Africa, although financial market turbulence appears to have subsided somewhat as per its latest assessment. On the other hand, the central bank of Turkey, after keeping the policy rates unchanged since August 2006 due to slowdown in domestic demand and moderation in inflation expectations, cut its policy rate by 25 basis points on September 13, 2007 and 50 basis points on October 16, 2007. The MPC noted that aggregate demand conditions continued to support the disinflation process and notwithstanding the risks related to energy, food and administered prices, inflation is expected to decelerate owing to the lagged effects of strong monetary tightening. The central bank of Turkey had earlier increased its policy rate by 425 basis points during June-July 2006 on concerns over the possible pass-through effect of the exchange rate movements arising from volatility in international financial markets.
The central bank of Brazil also reduced its policy rate further by 75 basis points during the second quarter of 2007-08 – 50 basis points on July 18, 2007 and 25 basis points on September 5, 2007 – to 11.25 per cent in view of weak economic activity/benign inflation. The policy rate has, thus, been reduced by 850 basis points since September 2005. On the other hand, the Bank of Israel initially lowered its policy rate by 25 basis points each during May and June 2007 but increased its policy rate by 25 basis points each on July 23, 2007 and August 27, 2007 to 4.0 per cent in view of acceleration in inflation.
In Russia, consumer price inflation remained high, increasing from 7.4 per cent in March 2007 to 8.5 per cent in June 2007 and further to 9.5 per cent in September 2007. Growth in money supply (M2) accelerated to 50 per cent, year-on-year, as on September 1, 2007 from 45 per cent a year ago. The Bank of Russia which had raised the required reserve ratio on credit institutions’ liabilities to non-resident banks in roubles and foreign currency by another 100 basis points to 4.5 per cent effective July 1, 2007, reduced it by 100 basis points to 3.5 per cent effective October 11, 2007. The refinancing rate has remained unchanged since June 2007, when it was reduced by 50 basis points to 10.0 per cent.
An assessment of key macroeconomic indicators in select EMEs shows that consumer price inflation was in the range of 1.4-9.5 per cent in select EMEs in August/September 2007 and inflation in India was the second highest amongst the select EMEs. Real policy rates in most countries ranged between 0.5 and 3.3 per cent in September 2007 (Table 28). Major EMEs, except India and South Africa, recorded surplus in current accounts in 2006. The real effective exchange rate (REER) for EMEs shows a mixed pattern in the recent period; in September 2007, while currencies of Korea, Indonesia and Israel exhibited depreciation, on a year-on-year basis, those of countries like India, China, Brazil, the Philippines, Thailand, South Africa and Russia underwent real appreciation. Although the Centre’s fiscal deficit in India declined during 2006-07 and was budgeted to decline further during 2007-08, it was likely to remain higher than that in most EMEs.
Table 28: Key Macroeconomic Indicators: Emerging Markets |
(Per cent) |
Country |
Consumer Price |
Current Account |
Real Effective |
Central Govt. |
Real Policy |
Real GDP |
|
Inflation |
Balance |
Exchange Rate |
Fiscal Balance |
Rate |
Growth |
|
|
|
(per cent to GDP) |
(REER) |
(per cent of GDP) |
|
|
|
|
|
Sept. |
Sept. |
|
|
Sept. |
Sept. |
|
|
Sept. |
Sept. |
|
|
|
2006 |
2007 |
2005 |
2006 |
2006 |
2007 |
2005 |
2006 |
2006 |
2007# |
2005 |
2006 |
1 |
2 |
3 |
4 |
5 |
6 |
7 |
8 |
9 |
10 |
11 |
12 |
13 |
|
|
|
|
|
|
|
|
|
|
|
|
|
Brazil |
3.7 |
4.1 |
1.6 |
1.2 |
6.0 |
10.8 |
-3.4 |
-3.2 |
10.6 |
7.2 |
2.9 |
3.7 |
China |
1.5 |
6.2 |
7.2 |
9.4 |
0.5 |
6.1 |
-1.3 |
-0.7 |
4.4 |
1.1 |
10.4 |
11.1 |
|
|
|
|
|
|
|
(17.9) |
(17.3) |
|
|
|
|
India |
6.3 |
7.3* |
-1.1 |
-1.1 |
-3.2 |
9.9 |
-4.1 |
-3.5 |
0.7 |
0.5 |
9.0 |
9.4 |
|
(5.4) |
(3.3) |
(-6.4) |
(-7.1) |
|
|
(63.4) |
(61.5) |
(1.6) |
(4.5) |
|
|
Indonesia |
14.5 |
7.0 |
0.1 |
2.7 |
24.4 |
-2.4 |
-0.5 |
-1.0 |
-3.3 |
1.3 |
5.7 |
5.5 |
|
|
|
|
|
|
|
(46.5) |
(40.9) |
|
|
|
|
Israel |
1.3 |
1.4 |
3.3 |
5.6 |
1.7 |
-0.6 |
-2.9 |
-2.7 |
4.2 |
2.6 |
5.3 |
5.2 |
Korea |
2.5 |
2.3 |
1.9 |
0.7 |
8.0 |
-2.5 |
1.9 |
1.8 |
2.0 |
2.7 |
4.2 |
5.0 |
|
|
|
|
|
|
|
(29.5) |
(32.2) |
|
|
|
|
Philippines |
5.7 |
2.7 |
2.0 |
4.3 |
14.8 |
5.8 |
-2.7 |
-1.0 |
1.8 |
3.3 |
4.9 |
5.4 |
Russia |
9.5 |
9.5 |
11.1 |
9.7 |
11.4 |
4.1 |
7.5 |
7.5 |
2.0 |
0.5 |
6.4 |
6.7 |
South Africa |
5.4 |
6.7* |
-4.0 |
-6.5 |
-13.5 |
2.9 |
– |
– |
2.6 |
3.3 |
5.1 |
5.0 |
Thailand |
2.7 |
2.1 |
-4.5 |
1.6 |
9.5 |
3.6 |
0.2 |
0.1 |
2.3 |
1.2 |
4.5 |
5.0 |
|
|
|
|
|
|
|
(26.1) |
(27.3) |
|
|
|
|
#: Based on nominal policy rate as on September 30, 2007.
*: August 2007.
Note :
1. For India, data pertain to fiscal years 2005-06 and 2006-07.
2. Consumer price inflation data are on a year-on-year basis. Data for India are for CPI-Industrial Workers.
3. Real policy rate is the policy rate less year-on-year consumer price inflation. For India, repo rate is used.
4. Figures in parentheses in columns (2) and (3) refer to wholesale price inflation.
5. Figures in parentheses in columns (4) and (5) refer to trade balance/GDP ratio.
6. Data on fiscal balance for Korea and Israel pertain to general government balance.
7. Figures in parentheses in columns (8) and (9) refer to central government debt/GDP ratio. For China, data
refer to public sector debt.
8. Figures in parentheses in columns (10) and (11) for India are based on wholesale price inflation.
9. Data on REER refer to year-on-year variation in broad indices (CPI-based) compiled by
the Bank for International Settlements.
A positive figure indicates appreciation while a negative figure indicates
depreciation. For India, data are based on movements in 6-currency indices.
Source :
International Monetary Fund, Asian Development Bank, Bank for International Settlements, World Bank, official
websites of respective central banks and the Economist. |
While some countries have prioritised inflation objectives in the hierarchy of their policy goals, some other countries continue to pursue multiple objectives (Table 29). In the light of responses of central banks to the recent turbulence in financial markets, it is becoming evident that central banks do have a role beyond inflation targeting. Although the outlook on inflation remained uncertain, central banks of some economies, including inflation targeters such as Bank of England, reacted to the volatility in financial markets by injecting liquidity in order to limit the adverse impact of the financial turmoil on the real economic activity. Central banks like the US Federal Reserve with price stability as the predominant objective of monetary policy, responded to the financial market developments by injecting additional liquidity as well as cutting key policy rates to support growth and ensure financial stability. This suggests that both growth and financial stability matter for all the central banks.
Table 29: Inflation Target as Defined in Law/Policy – Select Countries |
Country |
Target/Objective |
Measure |
Additional Considerations (if any) |
Inflation Targeting Countries |
|
|
United
Kingdom |
Price stability is defined by the
Government's inflation target of 2%. The Government's inflation target is announced each year by the Chancellor of the Exchequer in the annual Budget Statement. The target is expressed in terms of an annual rate of inflation based on CPI. |
CPI |
If the target is missed by more than 1
percentage point on either side, the Governor must write an open letter to the Chancellor explaining the reasons why inflation has deviated from the target and what the Bank proposes to do to bring inflation to the target. |
Australia |
As agreed by the Governor and the
Treasurer in the Third Statement on the Conduct of Monetary Policy, 2006, the appropriate target for monetary policy is to achieve an inflation rate of 2-3% on average, over the cycle. |
CPI |
The target is defined as a medium-term
average rather than as a hard-edged target band within which inflation is to be held at all times. |
New
Zealand |
The Reserve Bank of New Zealand (RBNZ) Act requires that price stability be defined in a specific and public contract, negotiated between the Government and the Reserve Bank, which is called the Policy Targets Agreement (PTA). As per the current PTA (there have been seven PTAs since the passage of the RBNZ Act, 1989) price stability is defined in terms of an inflation target of 1-3% on average over the medium term, defined in terms of the all groups CPI, as published by Statistics New Zealand. |
CPI |
The Act requires that the PTA sets out
specific price stability targets and the
agreement, or any changes to it, must be made public. The PTA also says that when external events push inflation above or below its medium term trend, "the Bank will respond consistent with meeting its medium term target". Furthermore, as it implements monetary policy to achieve price stability, the Bank "shall seek to avoid unnecessary instability in output, interest rates and the exchange rate." |
Canada |
Canada's monetary policy is built on a framework consisting of two key elements, namely, flexible exchange rate and inflation control target. At present, the inflation control target range established by the Bank of Canada and the federal government is 1-3% annual inflation as measured by the rate of change in the total CPI. |
CPI |
To keep inflation within this range, monetary policy aims at the 2% target mid-point over the six to eight quarters that are required for monetary policy to have most of its effect. By consistently aiming at 2 per cent for the 12-month rate of inflation, monetary policy can enhance the predictability of average inflation over longer time horizons. |
Korea |
As per the Bank of Korea Act (Formulation of operation plan of monetary policy), the Bank determines the annual inflation target for each year in consultation with the government. Currently, the target has been set for the period 2007-2009 as a 0.5% in terms of the 3-year range of 3+ – average of annual consumer price inflation. |
CPI |
In setting the inflation target itself at this
range, the Bank aims to reflect the appropriate rate of inflation consistent with Korean economic fundamentals and to allow itself flexibility in conducting monetary policy to deal with short-term economic
fluctuations. |
Thailand |
The Bank of Thailand decided to launch inflation targeting under the existing legal framework, whereby the Monetary Policy Board (MPB) was first appointed on April 5, 2000 and vested with the power to decide monetary policy by the Governor. Currently, the inflation target is set in terms of quarterly average core inflation in the range of 0 to 3.5%. The Bank adopted inflation targeting in May 2000. |
Core
CPI# |
The amendment to the Bank of Thailand Act, which is currently going through the parliamentary process, will give the MPB its official legal status and its operational independence in the conduct of monetary policy. If core inflation strays from the target range, the MPC will have to explain why the target was breached and what measures have to be taken, as well as the time required, to bring inflation back within the range. |
# : Excluding raw food and energy prices from headline inflation. |
Table 29: Inflation Target as Defined in Law/Policy – Select Countries (Concld.) |
Country |
Target/Objective |
Measure |
Additional Considerations (if any) |
The
Philippines |
The primary objective of the BSP's monetary policy is "to promote price stability conducive to a balanced and sustainable growth of the economy" (Republic Act 7653). The adoption of inflation targeting framework of monetary policy in January 2002 is aimed at achieving this objective. The government's inflation target is defined in terms of the average year-on-year change in the CPI over the calendar year. The target for both 2006 and 2007 has been set at 4-5%. |
CPI |
To ensure accountability in cases where the BSP fails to achieve the inflation target, the BSP Governor issues an Open Letter to the President outlining the reasons why actual inflation did not fall within the target, along with the steps that will be taken to bring inflation towards the target. |
Indonesia |
Inflation targeting is consistent with the mandate of 1999 Act concerning Bank Indonesia as amended in 2004. The inflation target represents the overriding monetary policy objective set by the Government after coordinating actions with Bank Indonesia. The Government has set the inflation target for 2007 at 5±1%. |
CPI |
The determination of the inflation target
considers the trade-off with economic growth in the effort to improve the living standards of the population. The setting of the intermediate targets is consistent with the desire to achieve a medium to long term inflation rate of 3% so that Indonesia can remain competitive with other Asian countries. |
Chile |
The focus of the Central Bank of Chile's monetary policy is price stability over time, taking into account the effects this policy has on economic activity and employment in the short and medium terms. Since 2001, the inflation target has been defined as a symmetrical range of 2 to 4%, centered on 3%, which must be met permanently over a medium-term horizon of two years. |
CPI |
Monetary policy can also play a role in
stabilizing output over the short term, as long as it is consistent with meeting the inflation target in the medium term. |
Other Major Countries |
Euro area |
As laid down in the Treaty establishing the European Community, to maintain price stability is the primary objective. The treaty does not give a precise definition of what is meant by price stability. The Governing council of the European Central Bank (ECB) has defined price stability as a year- on-year increase in the Harmonised Index of Consumer Prices (HICP) for the euro area of below 2%. |
HICP |
The ECB has also clarified that, in pursuit of price stability, it aims to maintain inflation rates below, but close to, 2% over the medium term. "Without prejudice to the primary objective of price stability", the Eurosystem will also "support the general economic policies in the Community, which include a "high level of employment" and "sustainable and non-inflationary growth." |
Japan |
The Bank of Japan Law states that the Bank's monetary policy should be "aimed at, through the pursuit of price stability, contributing to the sound development of the national economy." |
|
Monetary policy is implemented with the aim of maintaining price stability. Price denotes the overall level of prices of various goods and services. |
US |
The Federal Reserve Act says, "The Board of Governors of the Federal Reserve System and the Federal Open Market Committee shall maintain long run growth of the monetary and credit aggregates commensurate with the economy's long run potential to increase production, so as to promote effectively the goals of maximum employment, stable prices, and moderate long-term interest rates." |
Source : Websites of respective central banks. |
Global Commodity Prices
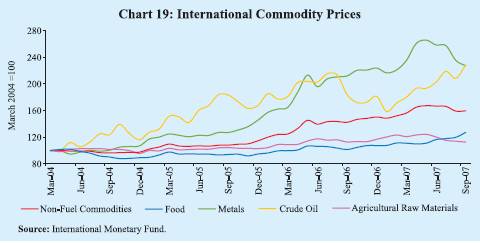
Commodity prices remained firm during the second quarter of 2007-08 led by food and crude oil prices, although there was some moderation in prices of metals (Table 30 and Chart 19).
International crude oil prices, represented by the West Texas Intermediate (WTI), rose further during the second quarter of 2007-08, reflecting limited spare capacity, fall in US crude inventories, fears about hurricanes in the US disrupting refining capacity and expectations about growing tightness in supply-demand balance during the high-demand winter seasons (Table 31). WTI prices crossed US $ 80 a barrel by mid-September 2007 and reached a historical peak on October 18, 2007 at US $ 89.5 a barrel, partly due to heightened geopolitical tensions in West Asia and the weakening of the US dollar. The decision by the Organisation of the Petroleum Exporting Countries (OPEC) to raise output by 0.5 million barrels per day (mb/d) effective November 1, 2007 also could not alleviate the pressures on oil prices due to the tight demand-supply conditions. The OPEC had earlier cut production during November 2006 (1.2 mb/d) and February 2007 (0.5 mb/d) to support prices. In the first quarter of 2007-08, the Indian basket price had temporarily exceeded the WTI prices, since UK Brent and Dubai crude prices
Table 30: International Commodity Prices |
|
Unit |
2004 |
Index |
Variation (per cent) |
Commodity |
|
|
2004 |
2005 |
2006 |
2007 |
Sept. 2007
over |
Sept. 2007
over |
|
|
|
|
|
|
Jan.-Sept. |
Mar. |
Jun. |
Sept. |
Mar. 2007 |
Sept. 2006 |
1 |
2 |
3 |
4 |
5 |
6 |
7 |
8 |
9 |
10 |
11 |
12 |
Energy |
|
|
|
|
|
|
|
|
|
|
|
Coal |
$/mt |
53.0 |
100 |
90 |
93 |
113 |
105 |
116 |
129 |
23.3 |
45.0 |
Crude oil (Average) |
$/bbl |
37.7 |
100 |
142 |
170 |
174 |
161 |
181 |
203 |
26.7 |
23.6 |
Non-Energy Commodities |
|
|
|
|
|
|
|
|
|
|
|
Palm oil |
$/mt |
471.3 |
100 |
90 |
102 |
155 |
132 |
171 |
176 |
33.2 |
66.7 |
Soybean oil |
$/mt |
616.0 |
100 |
88 |
97 |
131 |
117 |
135 |
158 |
35.2 |
61.3 |
Soybeans |
$/mt |
306.5 |
100 |
90 |
88 |
114 |
105 |
118 |
140 |
33.6 |
66.8 |
Rice |
$/mt |
237.7 |
100 |
120 |
128 |
135 |
134 |
136 |
137 |
2.0 |
5.1 |
Wheat |
$/mt |
156.9 |
100 |
97 |
122 |
144 |
127 |
142 |
208 |
64.0 |
66.6 |
Sugar |
c/kg |
15.8 |
100 |
138 |
206 |
140 |
146 |
130 |
136 |
-6.5 |
-19.2 |
Cotton A Index |
c/kg |
136.6 |
100 |
89 |
93 |
99 |
94 |
98 |
109 |
15.2 |
14.3 |
Aluminium |
$/mt |
1716.0 |
100 |
111 |
150 |
158 |
161 |
156 |
139 |
-13.4 |
-3.3 |
Copper |
$/mt |
2866.0 |
100 |
128 |
235 |
248 |
225 |
261 |
267 |
18.6 |
0.6 |
Gold |
$/toz |
409.2 |
100 |
109 |
148 |
163 |
160 |
160 |
174 |
8.8 |
19.1 |
Silver |
c/toz |
669.0 |
100 |
110 |
173 |
196 |
197 |
197 |
193 |
-1.7 |
11.5 |
Steel cold-rolled coil/sheet |
$/mt |
607.1 |
100 |
121 |
114 |
107 |
107 |
107 |
107 |
0.0 |
-7.1 |
Steel hot-rolled coil/sheet |
$/mt |
502.5 |
100 |
126 |
119 |
109 |
109 |
109 |
109 |
0.0 |
-8.3 |
Tin |
c/kg |
851.3 |
100 |
87 |
103 |
164 |
163 |
166 |
176 |
8.1 |
66.2 |
Zinc |
c/kg |
104.8 |
100 |
132 |
313 |
329 |
312 |
344 |
275 |
-11.9 |
-15.3 |
$: US dollar. c: US cent. bbl: barrel. mt: metric tonne. kg: Kilogram. toz: troy oz.
Source : Based on World Bank’s actual commodity price data.
The year 2004 has been taken as the base to better exhibit price trends over the relevant period. |
recorded higher increases vis-à-vis WTI crude prices. During July-September 2007, the Indian basket price, however, ruled below the WTI, reflecting the usual pattern. This was because the UK Brent prices fell below (by US $ 0.4 a barrel) the WTI, while the premium of the WTI over the Dubai variety increased significantly to US $ 5.5 a barrel. In contrast, during April-June 2007, Brent prices were US $ 3.8 a barrel above WTI prices while the premium of the WTI over the Dubai variety was only US $ 0.3 a barrel. Typically, WTI prices have been higher than other varieties.
Table 31: International Crude Oil Prices |
(US dollars per barrel) |
Year/Month |
Dubai Crude |
UK Brent |
US WTI |
Average
Crude Price |
Indian
Basket Price |
1 |
2 |
3 |
4 |
5 |
6 |
2001-02 |
21.8 |
23.2 |
24.1 |
23.0 |
22.4 |
2002-03 |
25.9 |
27.6 |
29.2 |
27.6 |
26.6 |
2003-04 |
26.9 |
29.0 |
31.4 |
29.1 |
27.8 |
2004-05 |
36.4 |
42.2 |
45.0 |
41.3 |
38.9 |
2005-06 |
53.4 |
58.0 |
59.9 |
57.1 |
55.4 |
2006-07 |
60.9 |
64.4 |
64.7 |
63.3 |
62.4 |
March 2004 |
30.5 |
33.8 |
36.7 |
33.7 |
31.9 |
March 2005 |
45.6 |
53.1 |
54.2 |
50.9 |
48.8 |
March 2006 |
57.7 |
62.3 |
62.9 |
60.9 |
59.6 |
March 2007 |
59.1 |
62.1 |
60.6 |
60.6 |
60.4 |
April 2007 |
63.8 |
67.4 |
63.9 |
65.1 |
65.3 |
May 2007 |
64.5 |
67.5 |
63.5 |
65.2 |
65.8 |
June 2007 |
65.8 |
71.3 |
67.5 |
68.2 |
68.1 |
July 2007 |
69.5 |
77.2 |
74.1 |
73.6 |
72.7 |
August 2007 |
67.2 |
70.8 |
72.4 |
70.1 |
68.7 |
September 2007 |
73.3 |
77.1 |
79.9 |
76.8 |
74.9 |
Source : International Monetary Fund and the World Bank. |
For instance, during the six-year period, 2001-02 to 2006-07, WTI prices, on average, were US $ 1.7 a barrel above Brent and US $ 4.8 a barrel above Dubai crude.
In view of the tight demand-supply balance, prices were expected to remain firm. According to the US Energy Information Administration (EIA), global demand was expected to remain 1.1 million barrels a day above the global supply during 2007 (Table 32). Notwithstanding the announced increase in OPEC supply, oil market fundamentals are likely to remain under pressure reflecting rising consumption, moderate growth in non-OPEC supply and falling inventories. Accordingly, the EIA expects WTI prices to average US $ 68.8 a barrel in the calendar year 2007, higher than that of US $ 66.0 during 2006. For 2008, the EIA expects prices to average US $ 73.5 a barrel.
Metal prices eased during the second quarter of 2007-08, reflecting lower import demand and some improvement in supply. Between June 2007 and September 2007, prices of nickel, zinc and aluminum fell by 29 per cent, 20 per cent and 11 per cent, respectively, reflecting lower Chinese demand. On the other hand, copper prices remained largely range bound, while lead prices increased by 33 per cent over the same period. As a result, the IMF’s metals price index declined by about 12 per cent between June-September 2007. On a year-on-year basis, in September 2007, while prices of lead (140 per cent) and tin (66 per cent) showed sharp increases, prices of other metals such as nickel, zinc and aluminium exhibited some decline. Steel prices have also declined, y-o-y, in September 2007, reflecting higher production in China and Brazil.
Food prices increased further during the second quarter of 2007-08 led by wheat and oilseeds/edible oils, reflecting a shortfall in global production, decline in stocks and rising demand for non-food uses (Chart 20). According to the assessment by the US Department of Agriculture (USDA) in October 2007, world
Table 32: World Supply-Demand Balance of Oil |
(Million barrels per day) |
Item |
2003 |
2004 |
2005 |
2006 |
2007 |
2008 |
2007 P |
|
|
|
|
|
(P) |
(P) |
Q1 |
Q2 |
Q3 |
Q4 |
1 |
2 |
3 |
4 |
5 |
6 |
7 |
8 |
9 |
10 |
11 |
Demand |
|
|
|
|
|
|
|
|
|
|
1. OECD |
48.7 |
49.5 |
49.6 |
49.2 |
49.3 |
49.4 |
49.5 |
48.1 |
49.1 |
50.3 |
2. Non-OECD |
31.2 |
33.0 |
34.4 |
35.4 |
36.5 |
37.8 |
36.0 |
36.4 |
36.5 |
37.1 |
of which: China |
5.6 |
6.5 |
6.9 |
7.3 |
7.7 |
8.2 |
7.4 |
7.6 |
7.7 |
8.0 |
3. Total (1+2) |
79.9 |
82.5 |
84.0 |
84.7 |
85.8 |
87.2 |
85.6 |
84.5 |
85.6 |
87.4 |
Supply |
|
|
|
|
|
|
|
|
|
|
4. Non-OPEC |
48.9 |
50.1 |
50.3 |
49.3 |
49.9 |
50.7 |
49.7 |
49.9 |
49.6 |
50.2 |
5. OPEC |
30.7 |
32.9 |
34.2 |
35.3 |
34.9 |
36.3 |
34.5 |
34.6 |
34.9 |
35.4 |
6. Total (4+5) |
79.6 |
83.1 |
84.5 |
84.6 |
84.7 |
87.1 |
84.3 |
84.5 |
84.5 |
85.6 |
Stock Changes |
0.3 |
-0.6 |
-0.5 |
0.1 |
1.1 |
0.1 |
1.3 |
0.0 |
1.1 |
1.8 |
P : Projections.
Source : US Energy Information Administration, October 9, 2007. |
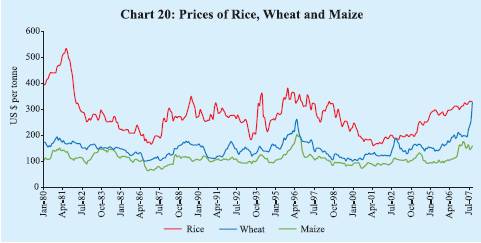
vegetable oils stocks fell by 16 per cent during 2006-07 and were expected to fall by an additional 9 per cent in 2007-08. Edible oil prices increased moderately during the second quarter; on a y-o-y basis, however, prices in September 2007 were higher in the range of 61-67 per cent. Prices had hardened by about 15-30 per cent between March 2007 and June 2007. Amongst other food items, prices of wheat rose by 46 per cent between June-September 2007 on top of 12 per cent increase during March-June 2007, taking the y-o-y rise in September 2007 to 67 per cent. According to the USDA, although global wheat production is expected to increase by about 1 per cent in 2007-08 (June-May), global wheat stocks are likely to decline further in 2007-08 to 107.0 million tonnes - their lowest levels since 1981-82. Rice prices also remained firm, reflecting low stocks. According to the USDA, rice stocks are expected to decline by about 8 per cent during 2007-08. The overall food price index compiled by the IMF increased by about 25 per cent in September 2007 (y-o-y) on top of an increase of 8 per cent a year ago. The IMF’s food price index in September 2007 has been the highest since early 1981.
International sugar prices increased by about 5 per cent during June-September 2007 in contrast to a decline of 11 per cent witnessed during March-June 2007 as the fall in domestic prices in exporter countries such as Brazil and India was offset by firm prices in importing countries of China and Russia. Prices in September 2007, however, were still 46 per cent lower than the recent peak touched in February 2006. According to the International Sugar Organisation, global sugar production is estimated to increase further by 4.1 million tonnes to 169.6 million tonnes during 2007-08 season, exceeding global consumption by 10.8 million tonnes. Global cotton prices increased by about 11 per cent during June-September 2007, reflecting shortfalls in production. According to the latest assessment by the International Cotton Advisory Committee (ICAC), the cotlook A index is expected to increase by about 20 per cent during 2007-08 due to an estimated decline in world cotton stocks by about 14 per cent to 10.8 million tonnes in 2007-08.
Inflation Conditions in India
The Annual Policy Statement for 2007-08 (April 2007) of the Reserve Bank had observed that the stance of monetary policy in 2007-08 would be conditioned by the patterns in which the global and, more particularly, the domestic environment unfolded. It had also reaffirmed the resolve to respond swiftly with all possible measures to developments impinging on inflation expectations and the growth momentum. Noting that the overarching policy challenge was to manage the transition to a higher growth path while containing inflationary pressures, the policy preference for the period ahead was indicated as strongly in favour of price stability and well-anchored inflation expectations with the endeavour being to contain inflation close to 5.0 per cent in 2007-08 and to the range of 4.0–4.5 per cent over the medium-term. This objective would be conducive for maintaining self-accelerating growth over the medium-term.
The First Quarter Review of Annual Statement on Monetary Policy for 2007-08 (July 2007) noted that there were indications that the combination of lagged and cumulative effects of monetary policy actions and fiscal and administrative measures for supply management have had a salutary effect on inflation expectations, and headline inflation had turned benign in sharp contrast to the last quarter of 2006-07. Going forward, the Review added that monetary management would need to be watchful of movements in commodity prices, particularly oil prices, the elevated levels of asset prices and the re-emergence of pricing power among producers as potential threats to inflation expectations. Assuming that aggregate supply management would continue to receive public policy attention and that a more active management of the capital account would be demonstrated, the outlook for inflation in 2007-08 was left unchanged in the Review.
Furthermore, the Reserve Bank reiterated its resolve to continue with its policy of active demand management of liquidity through the use of all the policy instruments at its disposal flexibly, as and when the situation warranted. On a review of the liquidity situation, it was announced to increase the cash reserve ratio (CRR) by another 50 basis points with effect from the fortnight beginning August 4, 2007 (Table 33). The CRR was earlier raised by 50 basis points in two stages of 25 basis points each effective April 14, 2007 and April 28, 2007.
Wholesale Price Inflation
Headline inflation, based on movement in the wholesale price index (WPI), eased further to 3.1 per cent (y-o-y) as on October 6, 2007 from 4.4 per cent at end-June 2007 and 5.4 per cent a year ago (it was 5.9 per cent at end-March
Table 33: Movement in Key Policy Rates and Inflation in India |
(Per cent) |
Effective since |
Reverse Repo Rate |
Repo Rate |
Cash Reserve Ratio |
WPI Inflation |
1 |
2 |
3 |
4 |
5 |
March 31, 2004 |
4.50 |
6.00 |
4.50 |
|
4.6 |
September 18, 2004 |
4.50 |
6.00 |
4.75 |
(+0.25) |
7.9 |
October 2, 2004 |
4.50 |
6.00 |
5.00 |
(+0.25) |
7.1 |
October 27, 2004 |
4.75 (+0.25) |
6.00 |
5.00 |
|
7.4 |
April 29, 2005 |
5.00 (+0.25) |
6.00 |
5.00 |
|
6.0 |
October 26, 2005 |
5.25 (+0.25) |
6.25 (+0.25) |
5.00 |
|
4.5 |
January 24, 2006 |
5.50 (+0.25) |
6.50 (+0.25) |
5.00 |
|
4.2 |
June 9, 2006 |
5.75 (+0.25) |
6.75 (+0.25) |
5.00 |
|
4.9 |
July 25, 2006 |
6.00 (+0.25) |
7.00 (+0.25) |
5.00 |
|
4.7 |
October 31, 2006 |
6.00 |
7.25 (+0.25) |
5.00 |
|
5.3 |
December 23, 2006 |
6.00 |
7.25 |
5.25 |
(+0.25) |
5.8 |
January 6, 2007 |
6.00 |
7.25 |
5.50 |
(+0.25) |
6.4 |
January 31, 2007 |
6.00 |
7.50 (+0.25) |
5.50 |
|
6.7 |
February 17, 2007 |
6.00 |
7.50 |
5.75 |
(+0.25) |
6.0 |
March 3, 2007 |
6.00 |
7.50 |
6.00 |
(+0.25) |
6.5 |
March 31, 2007 |
6.00 |
7.75 (+0.25) |
6.00 |
|
5.9 |
April 14, 2007 |
6.00 |
7.75 |
6.25 |
(+0.25) |
6.3 |
April 28, 2007 |
6.00 |
7.75 |
6.50 |
(+0.25) |
6.0 |
August 4, 2007 |
6.00 |
7.75 |
7.00 |
(+0.50) |
4.4 |
Note :
1. With effect from October 29, 2004, the nomenclature of repo and reverse repo was changed in
keeping with international usage.
Now, reverse repo indicates absorption of liquidity and repo signifies injection of liquidity.
Prior to October 29, 2004, repo indicated absorption of liquidity, while reverse repo meant injection of liquidity.
The nomenclature in this Report is based on the new usage of terms even for the period prior to October 29, 2004.
2. Figures in parentheses indicate change in policy rates. |
2007). The y-o-y inflation excluding fuel, at 4.6 per cent, was above the headline inflation rate (Chart 21 and Table 34). Headline inflation has moved in a range of
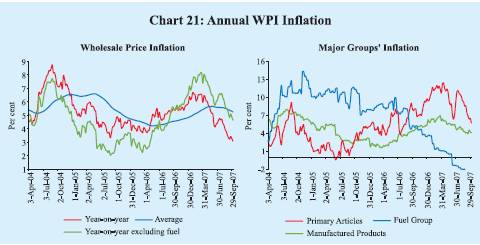
Table 34: Wholesale Price Inflation in India (year-on-year) |
(Per cent) |
Commodity |
2006-07 |
2006-07 |
2007-08 P |
|
(March 31) |
(October 7) |
(October 6) |
|
Weight |
Inflation |
WC |
Inflation |
WC |
Inflation |
WC |
1 |
2 |
3 |
4 |
5 |
6 |
7 |
8 |
All Commodities |
100.0 |
5.9 |
100.0 |
5.4 |
100.0 |
3.1 |
100.0 |
1. |
Primary Articles |
22.0 |
10.7 |
39.0 |
7.8 |
32.0 |
5.7 |
42.0 |
|
Food Articles |
15.4 |
8.0 |
20.8 |
8.7 |
25.1 |
3.7 |
19.3 |
|
i. |
Rice |
2.4 |
5.7 |
2.1 |
1.2 |
0.5 |
6.7 |
4.6 |
|
ii. |
Wheat |
1.4 |
7.3 |
1.8 |
18.3 |
4.5 |
1.7 |
0.8 |
|
iii. |
Pulses |
0.6 |
12.5 |
1.4 |
44.0 |
4.7 |
-10.7 |
-2.8 |
|
iv. |
Vegetables |
1.5 |
1.2 |
0.3 |
0.0 |
0.0 |
14.7 |
7.3 |
|
v. |
Fruits |
1.5 |
5.7 |
1.8 |
9.6 |
3.3 |
-8.7 |
-5.4 |
|
vi. |
Milk |
4.4 |
8.4 |
5.8 |
8.7 |
6.6 |
6.1 |
8.3 |
|
vii. |
Eggs, Fish and Meat |
2.2 |
9.4 |
3.8 |
0.5 |
0.2 |
5.7 |
4.3 |
|
Non-Food Articles |
6.1 |
17.2 |
15.6 |
3.4 |
3.6 |
12.7 |
22.7 |
|
i. |
Raw Cotton |
1.4 |
21.9 |
3.5 |
9.3 |
1.7 |
12.8 |
4.2 |
|
ii. |
Oilseeds |
2.7 |
31.6 |
11.0 |
-1.0 |
-0.5 |
26.9 |
19.2 |
|
iii. |
Sugarcane |
1.3 |
1.1 |
0.3 |
0.7 |
0.2 |
1.1 |
0.5 |
|
Minerals |
0.5 |
17.5 |
2.6 |
19.9 |
3.2 |
0.7 |
0.2 |
2. |
Fuel, Power, Light and Lubricants |
14.2 |
1.0 |
4.0 |
5.3 |
22.1 |
-2.3 |
-16.7 |
|
i. |
Mineral Oils |
7.0 |
0.5 |
1.1 |
5.7 |
14.0 |
-2.9 |
-12.5 |
|
ii. |
Electricity |
5.5 |
2.3 |
2.8 |
6.0 |
8.2 |
-1.8 |
-4.2 |
|
iii. |
Coal Mining |
1.8 |
0.0 |
0.0 |
0.0 |
0.0 |
0.0 |
0.0 |
3. |
Manufactured Products |
63.8 |
6.1 |
57.3 |
4.4 |
45.7 |
4.1 |
73.7 |
|
i. |
Food Products |
11.5 |
6.1 |
10.5 |
2.5 |
4.8 |
3.7 |
12.1 |
|
|
of which: Sugar |
3.6 |
-12.7 |
-6.6 |
2.5 |
1.4 |
-15.4 |
-14.5 |
|
|
Edible Oils |
2.8 |
14.1 |
4.7 |
5.4 |
2.1 |
11.1 |
7.4 |
|
ii. |
Cotton Textiles |
4.2 |
-1.0 |
-0.6 |
6.4 |
3.8 |
-0.5 |
-0.5 |
|
iii. |
Man Made Fibres |
4.4 |
3.9 |
1.3 |
5.2 |
2.0 |
-1.7 |
-1.2 |
|
iv. |
Chemicals and Chemical Products |
11.9 |
3.6 |
7.1 |
2.5 |
5.3 |
5.2 |
18.8 |
|
|
of which: Fertilisers |
3.7 |
1.8 |
1.0 |
2.1 |
1.3 |
0.7 |
0.7 |
|
v. |
Basic Metals, Alloys and Metal Products |
8.3 |
11.3 |
17.4 |
6.3 |
11.1 |
4.1 |
12.6 |
|
|
of which: Iron and Steel |
3.6 |
8.1 |
6.0 |
0.2 |
0.2 |
6.8 |
10.0 |
|
vi. |
Non-Metallic Mineral Products |
2.5 |
9.0 |
3.6 |
12.6 |
5.1 |
8.9 |
6.7 |
|
|
of which: Cement |
1.7 |
11.6 |
3.2 |
18.2 |
4.9 |
10.0 |
5.3 |
|
vii. |
Machinery and Machine Tools |
8.4 |
8.1 |
8.6 |
4.6 |
5.4 |
7.1 |
14.4 |
|
|
of which: Electrical Machinery |
5.0 |
12.9 |
6.7 |
8.0 |
4.5 |
12.8 |
12.9 |
|
viii. |
Transport Equipment and Parts |
4.3 |
2.0 |
1.2 |
2.2 |
1.4 |
1.3 |
1.5 |
|
Memo: |
|
Food Items (Composite) |
26.9 |
7.3 |
31.2 |
6.2 |
29.9 |
3.7 |
31.3 |
|
WPI Excluding Food |
73.1 |
5.5 |
68.8 |
5.1 |
70.1 |
2.9 |
68.7 |
|
WPI Excluding Fuel |
85.8 |
7.4 |
96.0 |
5.4 |
77.9 |
4.6 |
116.7 |
WC: Weighted Contribution. P : Provisional. |
3.1-6.4 per cent during 2007-08 so far. The annual average WPI inflation rate (average of 52 weeks) for the week ended October 6, 2007 eased to 5.2 per cent from 5.6 per cent at end-June 2007, but was higher compared with 4.6 per cent a year ago.
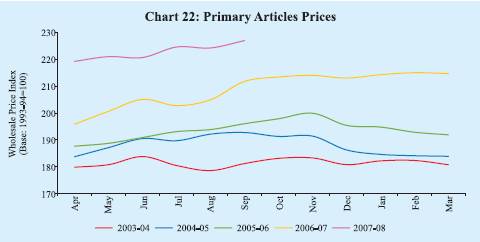
Primary articles’ inflation, y-o-y, eased to 5.7 per cent on October 6, 2007 from 9.3 per cent at end-June 2007 and 7.8 per cent a year ago (it was 10.7 per cent at end-March 2007). Primary articles’ inflation, y-o-y, was led by rice, vegetables, milk, oilseeds and raw cotton. Wheat prices increased marginally by 0.9 per cent between end-March 2007 and October 6, 2007, and were higher by 1.7 per cent on y-o-y basis (18.3 per cent a year ago). Prices of oilseeds increased by 26.9 per cent, y-o-y, as against a decline of 1.0 per cent a year ago, which could be attributed to lower domestic production as well as firm global prices. Raw cotton prices were 12.8 per cent higher, y-o-y, as on October 6, 2007 as compared with 9.3 per cent in the previous year (Chart 22).
Fuel group inflation, y-o-y, turned negative beginning the week ended June 9, 2007 and remained so (-2.3 per cent) on October 6, 2007, easing from 5.3 per cent a year ago, reflecting the cuts in domestic prices of petrol, diesel and other fuel products in November 2006 and February 2007. This has helped in moderating headline inflation. However, while domestic prices have remained unchanged since February 2007, international crude prices (WTI) have increased by almost 35 per cent over the same period up to September 2007. The Indian basket price of crude oil, which averaged US $ 57 a barrel in February 2007, increased to US $ 75 a barrel in September 2007. Thus, headline inflation has remained suppressed due to a halt in pass-through of higher international prices to domestic prices since February 2007.
Manufactured products inflation, y-o-y, eased to 4.1 per cent on October 6, 2007 from 4.9 per cent at end-June 2007 and 6.1 per cent at end-March 2007; it was 4.4 per cent a year ago. Manufactured products inflation was led by edible oils (increase of 11.1 per cent), oil cakes (34.6 per cent), chemicals (5.2 per
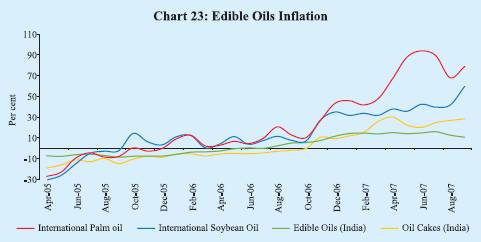
cent), cement (10.0 per cent), metals (4.1 per cent) and electrical machinery (12.8 per cent) (see Table 34). These commodities together contributed 71 per cent of the overall WPI inflation on October 6, 2007. Metals prices have remained broadly unchanged from end-June 2007 levels, although international prices, as mentioned earlier, have declined by about 12 per cent since end-June 2007. Higher prices of cement could be attributed largely to the strong demand from the construction sector and high capacity utilisation rates in the cement industry [94 per cent during 2007-08 (April-September) as compared with 90 per cent a year ago]. The hardening of electrical machinery prices reflected higher input prices as well as investment demand. The firming up of domestic edible oils and oil cakes prices reflected stagnant domestic production, increased demand and rise in international prices (Chart 23). Edible oils and oil cakes along with oilseeds accounted for 41 per cent of headline inflation on October 6, 2007. Sugar prices, however, declined by 15.4 per cent, y-o-y, and contributed negatively to manufacturing inflation.
In order to contain inflationary pressures, the Government initiated certain fiscal measures during 2007-08. On April 3, 2007, the Government decided to exempt import of portland cement from countervailing duty and special additional customs duty; it was earlier exempted from basic customs duty in January 2007. On July 23, 2007, the Government reduced the import duty on palm oils by five percentage points – from 50 per cent to 45 per cent in the case of crude palm oil and from 57.5 per cent to 52.5 per cent in the case of refined palm oil. As per the principle of equitable burden sharing among the different stakeholders, the Government, on October 11, 2007, decided to bear the burden to the extent of 42.7 per cent of the total under-recoveries in the retail sale of petroleum products
by oil marketing companies through issuance of oil bonds; the Government issued oil bonds worth Rs.24,121 crore during 2006-07.
Overall, manufactured products were the major driver of domestic inflation as on October 6, 2007 (with weighted contribution of 73.7 per cent) followed by primary articles (42.0 per cent) (Chart 24). The fuel group’s contribution to the y-o-y headline inflation, on the other hand, was negative at 16.7 per cent.
Consumer Price Inflation
Consumer price inflation remained firm during the second quarter of 2007-08, and also remained higher than WPI inflation. This could be attributed to the higher order of increases in food prices as well as the higher weight of food items in the CPI. Various measures of consumer price inflation were placed in the range of 5.7-7.9 per cent during August/September 2007 as compared with 5.7-7.8 per cent in June 2007 (and 6.7-9.5 per cent in March 2007). Disaggregated data show that food group inflation in various CPI measures hardened to 7.7-10.3 per cent in August/September 2007 from 7.7-8.8 per cent in June 2007; it was 10.9-12.2 per cent in March 2007 (Table 35).
Asset Prices
Domestic equity prices recorded further gains during the quarter ended September 2007, with intermittent corrections (see Chapter V). Bullion prices also firmed up during the second quarter in line with international trends. Domestic equity prices, represented by the BSE sensex, increased by 12 per cent to 16,046 in September 2007 from the level of 14,334 in June 2007, reflecting
Table 35: Consumer Price Inflation – Major Groups |
(Year-on-year variation in per cent) |
CPI Measure |
Weight |
March |
March |
March |
March |
March |
June |
August |
|
|
2003 |
2004 |
2005 |
2006 |
2007 |
2007 |
2007 |
1 |
2 |
3 |
4 |
5 |
6 |
7 |
8 |
9 |
CPI-IW (Base: 2001=100)# |
General |
100.0 |
4.1 |
3.5 |
4.2 |
4.9 |
6.7 |
5.7 |
7.3 |
Food Group |
46.2 |
3.7 |
3.1 |
1.6 |
4.9 |
12.2 |
8.1 |
9.6 |
Pan, Supari etc. |
2.3 |
1.9 |
4.2 |
2.1 |
3.1 |
4.4 |
9.6 |
10.3 |
Fuel and Light |
6.4 |
6.3 |
6.5 |
4.9 |
-2.9 |
3.2 |
1.6 |
0.8 |
Housing |
15.3 |
5.4 |
3.9 |
20.4 |
6.6 |
4.1 |
4.1 |
4.0 |
Clothing, Bedding etc. |
6.6 |
1.5 |
2.1 |
2.3 |
3.0 |
3.7 |
4.4 |
4.4 |
Miscellaneous |
23.3 |
5.3 |
3.2 |
3.9 |
4.6 |
3.3 |
4.0 |
3.2 |
CPI-UNME (Base: 1984-85=100) |
General |
100.0 |
3.8 |
3.4 |
4.0 |
5.0 |
7.6 |
6.1 |
5.7 * |
Food Group |
47.1 |
2.6 |
3.0 |
2.2 |
5.3 |
10.9 |
7.7 |
7.7 * |
Fuel and Light |
5.5 |
3.1 |
3.2 |
9.6 |
1.9 |
6.4 |
7.2 |
7.0 * |
Housing |
16.4 |
6.3 |
5.2 |
7.5 |
5.5 |
5.6 |
5.6 |
4.9 * |
Clothing, Bedding etc. |
7.0 |
2.6 |
2.6 |
2.0 |
2.9 |
3.6 |
4.3 |
4.0 * |
Miscellaneous |
24.0 |
6.0 |
2.8 |
4.4 |
5.1 |
4.4 |
3.7 |
3.2 * |
CPI-AL (Base: 1986-87=100) |
General |
100.0 |
4.9 |
2.5 |
2.4 |
5.3 |
9.5 |
7.8 |
7.9 * |
Food Group |
69.2 |
6.0 |
1.6 |
2.2 |
5.5 |
11.8 |
8.8 |
10.3 |
Pan, Supari etc. |
3.8 |
3.5 |
4.7 |
-1.3 |
6.6 |
5.7 |
9.1 |
10.9 |
Fuel and Light |
8.4 |
4.8 |
3.0 |
3.0 |
4.3 |
6.9 |
7.4 |
7.2 |
Clothing, Bedding etc. |
7.0 |
3.0 |
4.1 |
2.5 |
2.2 |
3.5 |
2.7 |
1.9 |
Miscellaneous |
11.7 |
3.1 |
2.7 |
5.5 |
5.5 |
6.8 |
6.7 |
5.6 |
CPI-RL (Base: 1986-87=100) |
General |
100.0 |
4.8 |
2.5 |
2.4 |
5.3 |
9.2 |
7.5 |
7.6 * |
Food Group |
66.8 |
5.6 |
1.9 |
1.9 |
5.8 |
11.5 |
8.5 |
10.0 |
Pan, Supari etc. |
3.7 |
3.5 |
4.7 |
-1.0 |
6.3 |
5.7 |
9.3 |
11.1 |
Fuel and Light |
7.9 |
4.8 |
3.0 |
2.9 |
4.0 |
6.9 |
7.4 |
7.0 |
Clothing, Bedding etc. |
9.8 |
3.3 |
3.4 |
2.8 |
2.7 |
3.1 |
2.6 |
2.3 |
Miscellaneous |
11.9 |
3.1 |
3.0 |
5.5 |
5.2 |
6.3 |
6.2 |
5.3 |
Memo: |
WPI Inflation (End of period) |
|
6.5 |
4.6 |
5.1 |
4.1 |
5.9 |
4.4 |
3.8 |
GDP Deflator based inflation @ |
|
3.9 |
3.7 |
4.2 |
4.4 |
5.3 |
5.2 |
– |
* : September 2007. @ : Data for March pertain to full year.
# : Data prior to January 2006 are based on the old series (Base: 1982=100).
IW : Industrial Workers.
UNME : Urban Non-Manual Employees.
AL : Agricultural Labourers.
RL : Rural Labourers. |
strong domestic growth, better corporate performance, liquidity support from FIIs and improved market sentiment following further easing of domestic inflation since June 2007 (Chart 25). Domestic gold prices have increased by about 7 per cent since June 2007 to around Rs.9,360 per 10 grams in September 2007 (these were Rs.9,369 per 10 grams in March 2007) in line with movement in international prices, which increased by about 9 per cent over the same period. International
gold prices firmed up to above US $ 700 per ounce during September 2007 and edged up further to reach a peak of US $ 764 per ounce on October 18, 2007, reflecting weakening of US dollar, hardening of oil prices and uncertainties surrounding the global financial markets.
|
 IST,
IST,


