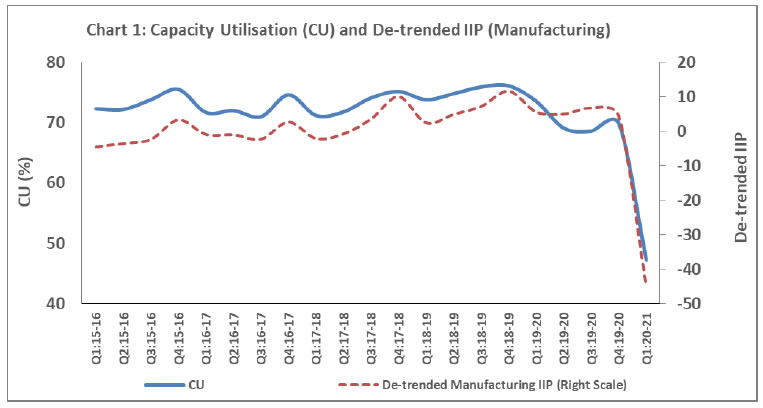
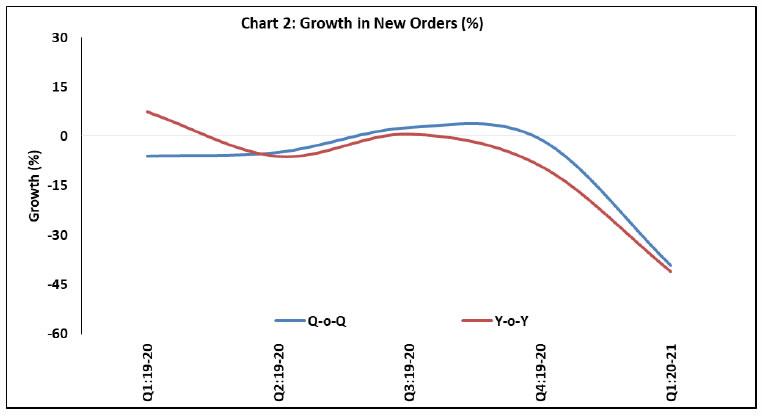
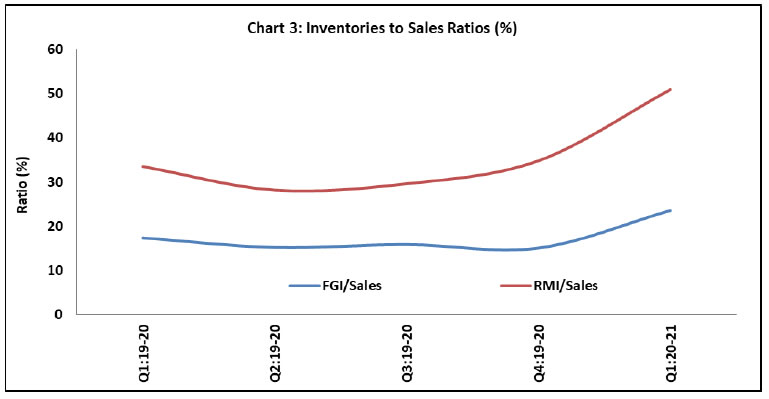
OBICUS Survey on the Manufacturing sector - Q1:2020-21
Today, the Reserve Bank released the results of the 50th round of the Order Books, Inventories and Capacity Utilisation Survey (OBICUS) for the quarter April-June 2020 covering 462 manufacturing companies. The survey provides a snapshot of demand conditions in India’s manufacturing sector1.
Highlights:
At the aggregate level, capacity utilisation (CU) fell sharply from 69.9 per cent in Q4:2019-20 to 47.3 per cent in Q1:2020-21, as domestic economic activity was impacted severely by lockdown imposed during the quarter to contain the spread of the COVID-19 pandemic. Seasonally adjusted CU also declined to 48.2 per cent in Q1:2020-21 from 68.2 per cent in the previous quarter.
Manufacturing companies received considerably lower orders during Q1:2020-21 when compared to that in the previous quarter as well as their levels a year ago (Chart 2).
Sales, raw material inventory (RMI) and finished goods inventory (FGI) declined during Q1:2020-21; the fall in sales was, however, sharper than that in RMI and FGI. As a result, the ratios of FGI and RMI to sales increased during the quarter (Chart 3).
Table 1.1: IIP*-Manufacturing and Capacity Utilisation (CU)
Quarter
Number of responding companies
Capacity Utilisation
IIP-Manufacturing (Quarterly Average)
De-trended Quarterly IIP-Manufacturing
Q1:2019-20
781
73.6
130.3
5.6
Q2:2019-20
819
69.1
129.4
5.0
Q3:2019-20
700
68.6
130.8
6.8
Q4:2019-20
349
69.9
127.9
4.3
Q1:2020-21
406
47.3
78.0
-45.1
*: Index of Industrial Production (Base: 2011-12)
Table 1.2: Order Books (Q1:2019-20 to Q1:2020-21) (Based on common set of 63 companies in 9 quarters)**
Quarter
Amount (₹ Crores)
Q-o-Q Growth (%)***
Y-o-Y Growth (%)
Average Backlog Orders
Average New Order Book
Average Pending Orders
Average Backlog Orders
Average New Order Book
Average Pending Orders
Average Backlog Orders
Average New Order Book
Average Pending Orders
Q1:2019-20
165.0
172.8
169.6
0.5
-6.0
2.6
0.6
7.5
9.1
Q2:2019-20
170.9
164.4
179.4
3.6
-4.9
5.8
10.0
-6.1
9.1
Q3:2019-20
179.4
168.8
186.5
5.0
2.7
4.0
9.0
0.7
13.7
Q4:2019-20
185.7
167.5
192.3
3.5
-0.8
3.1
13.1
-8.9
16.3
Q1:2020-21
192.2
101.9
99.1
3.5
-39.2
-48.4
16.5
-41.1
-41.5
**: As required for calculating growth rates in recent 5 quarters. ***: Not seasonally adjusted
Table 1.3: Average Sales and Inventories (Q1:2019-20 to Q1:2020-21) (Based on common set of 177 companies in 5 quarters)
Quarter
Amount (₹ Crores)
Ratio (per cent)
Average Sales
Average Total Inv
Average FG Inv
Average WiPInv
Average RM Inv
Total Inv/Sales
FG Inv/Sales
RMInv/Sales
Q1:2019-20
908.8
531.2
157.8
68.8
304.6
58.5
17.4
33.5
Q2:2019-20
919.8
464.2
139.8
65.2
259.2
50.5
15.2
28.2
Q3:2019-20
941.9
493.5
149.4
65.3
278.8
52.4
15.9
29.6
Q4:2019-20
882.5
482.4
133.0
42.4
307.1
54.7
15.1
34.8
Q1:2020-21
502.5
445.3
118.4
71.2
255.7
88.6
23.6
50.9
RM - Raw Material; WiP - Work in progress; FG - Finished Goods; Inv – Inventory.
1 The survey responses are voluntary. The 49th round of the OBICUS covering 364 manufacturing companies with reference period as January-March 2020 was released on the RBI website on August 06, 2020.
RbiTtsCommonUtility
PLAYING
LISTEN
LOADING...
0:062:49
Related Assets
RBI-Install-RBI-Content-Global
RbiSocialMediaUtility
Share this page:
Install the RBI mobile application and get quick access to the latest news!
RbiWasItHelpfulUtility
Was this page helpful?Thanks!
Would like to give more details?
Thank you for your feedback!Thank you for your feedback!