Order Books, Inventories and Capacity Utilisation Survey on the Manufacturing sector for Q2:2024-25
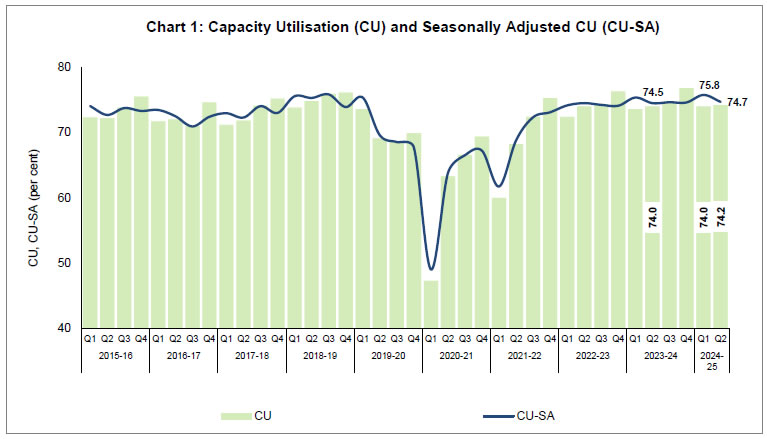
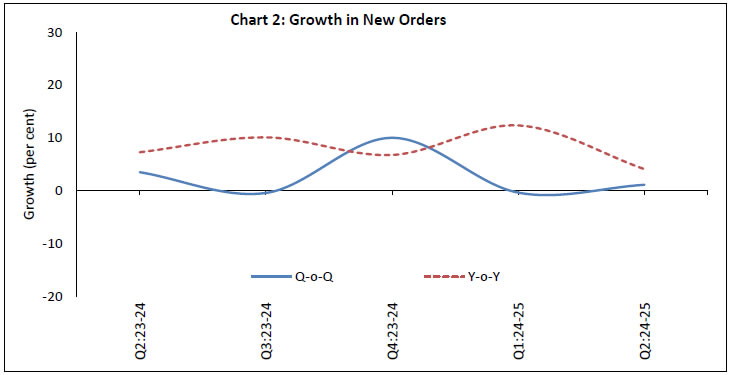
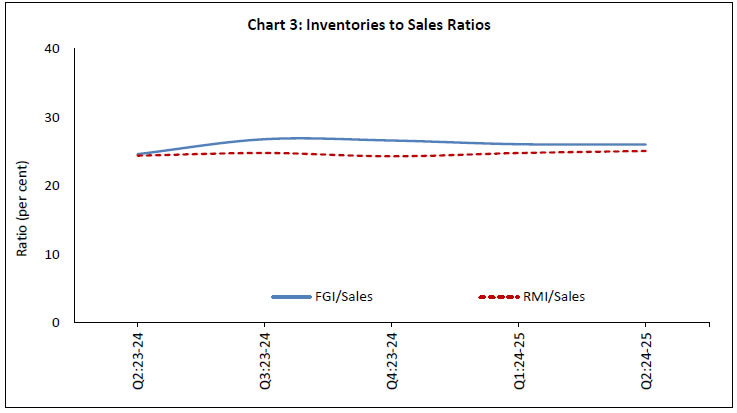
Today, the Reserve Bank released the results of its 67th round of the quarterly Order Books, Inventories, and Capacity Utilisation Survey (OBICUS), which was conducted during Q3:2024-25 and covered 1,008 manufacturing companies. The survey1 provides a snapshot of the demand conditions in India’s manufacturing sector during July-September 2024.
Highlights:
At the aggregate level, capacity utilisation (CU) in the manufacturing sector increased marginally to 74.2 per cent in Q2:2024-25, from 74.0 per cent in the previous quarter. The seasonally adjusted CU (CU-SA), however, declined by 110 basis points from the previous quarter and stands at 74.7 per cent in Q2:2024-25. Both CU and CU-SA for Q2:2024-05 are higher as compared with the corresponding quarter in the previous year (Chart 1 and Table 1).
Manufacturers reported higher sequential (q-o-q) growth in new orders during Q2:2024-25. On an annual (y-o-y) basis, however, new order growth moderated. (Chart 2 and Table 2A).
As a ratio to sales, both the finished goods inventory (FGI) and the raw material inventory2 (RMI) remained stable during Q2:2024-25 (Chart 3 and Table 3A).
Note: The Seasonally Adjusted Capacity Utilisation is calculated using X13-ARIMA-SEATS (Signal Extraction in ARIMA Time Series) taking the Covid-19 lockdown quarter Q1:2020-21 as an additive outlier.
Table 2A: Order Books Growth
Quarter
Number of companies
Q-o-Q Growth # (per cent)
Y-o-Y Growth # (per cent)
Backlog Orders
New Order Book
Pending Orders
Backlog Orders
New Order Book
Pending Orders
Q2:2023-24
245
3.1
3.5
5.6
24.1
7.3
15.7
Q3:2023-24
233
4.7
-0.4
4.1
13.7
10.1
19.0
Q4:2023-24
224
3.4
10.0
0.2
18.9
6.8
10.4
Q1:2024-25
238
2.0
-0.4
7.2
11.2
12.3
16.2
Q2:2024-25
315
7.2
1.1
2.8
9.8
4.1
9.9
#: Growth rates are calculated using common set of companies responding in three survey rounds, namely the current quarter, one quarter ago and the corresponding quarter a year ago.
Table 2B: Average Size of Order Books
Quarter
Number of companies
Average Amount (₹ crore)
Backlog Orders
New Order Book
Pending Orders
Q2:2023-24
245
227.7
248.6
240.4
Q3:2023-24
233
228.6
252.1
238.0
Q4:2023-24
224
221.6
267.2
222.2
Q1:2024-25
238
266.4
292.5
285.8
Q2:2024-25
315
257.8
309.0
291.9
Table 3A: Inventory to Sales Ratios
Quarter
Number of Companies
Ratio (per cent) ##
Total Inventory / Sales
Finished Goods Inventory / Sales
Raw Material Inventory / Sales
Q2:2023-24
688
65.9
24.6
24.4
Q3:2023-24
714
67.7
26.8
24.8
Q4:2023-24
803
65.4
26.6
24.3
Q1:2024-25
800
67.4
26.1
24.8
Q2:2024-25
927
69.3
26.0
25.1
##: Weighted average of industry level ratios using Gross Value Added as weights.
1 The survey responses are voluntary, and the results reflect the views of the respondents, which are not necessarily shared by the Reserve Bank. Results of the previous survey round were released on the Bank’s website on October 09, 2024.
2 The estimates of raw materials inventory (including stores and spares, loose tools, stock-in-trade, and other inventories) were arrived at by netting out finished goods inventory and work-in-progress inventory from total inventory. Since the 53rd round of the survey (i.e., Q4:2020−21), however, direct data on raw material inventory (excluding stores and spares, loose tools, stock-in-trade, and other inventories) are also being collected from survey respondents, in parallel. Estimates of raw materials inventory based on the additional reporting are presented here.
RbiTtsCommonUtility
PLAYING
LISTEN
LOADING...
0:062:49
Related Assets
RBI-Install-RBI-Content-Global
RbiSocialMediaUtility
Share this page:
Install the RBI mobile application and get quick access to the latest news!
RbiWasItHelpfulUtility
Was this page helpful?Thanks!
Would like to give more details?
Thank you for your feedback!Thank you for your feedback!