 IST,
IST,


Are Food Prices Spilling Over?
|
by Michael Debabrata Patra, Joice John and Asish Thomas George^ Persistence in food inflation has increased due to repeated climatic shocks of rising intensity. The increase in food inflation persistence is driven by the secular upward drift in its time varying trend, signifying rising expectations of higher food prices due to overlapping supply shocks. Empirical evidence points to spillovers to non-food components, which is being offset by disinflationary monetary policy. If high food inflation persists, however, a more cautious monetary policy approach is warranted to squelch the propagation of food inflation pressures into a more generalised inflation. Introduction In the January 2024 issue of this Bulletin, we asked: are food prices the ‘true’ core of India’s inflation? (Patra et al., 2024a). In the ensuing months, food price pressures have become unrelentingly persistent even as core inflation, traditionally defined as consumer price index (CPI) excluding food and fuel, has fallen to historic lows, steered by disinflationary monetary policy. This has brought to centre stage the issue of food inflation persistence, warranting a careful assessment of its sources and propagative power. Food inflation is impeding the alignment of headline inflation with its target in India and cannot be tolerated in setting monetary policy any longer. High food inflation is seeping into households’ inflation perceptions and expectations, with the potential for spillovers into non-food prices as demand for higher wages on cost of living considerations and rising input costs are eventually passed on as higher output prices, especially in a scenario of strengthening aggregate demand. As a result, there is a danger that the beneficial effects of lowering core inflation can be frittered away, with adverse implications for the disinflation process underway and for policy credibility. Against this backdrop, this article examines the food inflation process in terms of its persistence, its effects on expectations and the possibilities of wider spillovers. Section II evaluates the drivers of recent food price shocks and their durability or otherwise as well as possible generalisation. Section III attempts a formal decomposition of CPI food inflation into different components of persistence and stochastic shocks. Section IV analyses the impact of food price shocks on households’ expectations. Section V gauges the contribution of food price shocks to core inflation in a semi-structural macroeconomic model framework. Section VI concludes the paper. II. Why are Food Prices Sticky? Food inflation averaging 6.3 per cent1 during the 2020s is a stark contrast to the period 2016-2020 when it averaged just 2.9 per cent2. A key distinguishing factor in this sharp divergence has been the incidence of multiple overlapping supply shocks due to climate events in the more recent period that impacted the spatial and temporal distribution of monsoons, induced sharp increases in surface temperatures and caused unseasonal rainfall. Global climate systems, including triple dip La Nina event and El Nino3 conditions seen since 2020, also played a role. During the 2020s, monsoons have been by and large normal in terms of the average precipitation over the country as a whole. Their spatial and temporal distribution has, however, been highly skewed, with multiple instances of delayed onsets, dry weather conditions in peak monsoon months and in key agricultural crop production areas, and high unseasonal rainfall during harvest months, all of which have had a deleterious impact on production and yields of agricultural crops, especially during the kharif season (Chart 1). 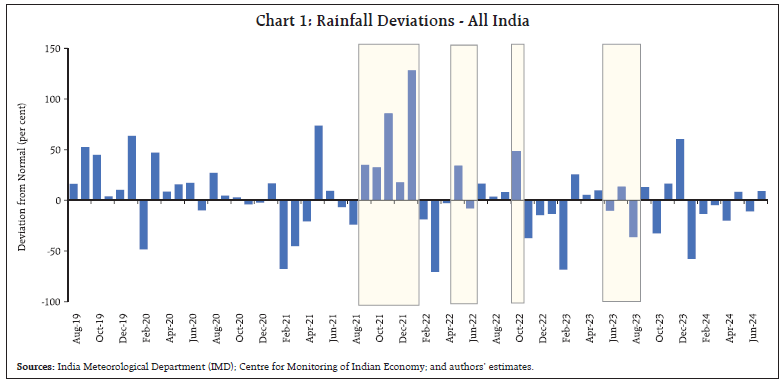 Since 2021, high variations in surface temperatures have also taken their toll on agricultural activity. Winter months have been experiencing substantially higher than normal temperature, while summers and their onset have been marked by heat waves. On the back of El Nino conditions, surface temperatures were persistently higher than normal levels since the second half of 2023-24 (Chart 2). These climate adversities have impacted yields of rabi season crops. 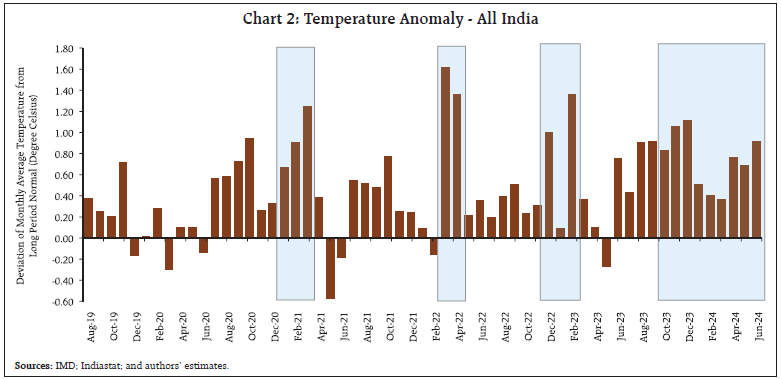 The broad-based and persistent food inflation that has taken hold during the last four years as a result, belies the conventional notion of food inflation pressures being sector or crop-specific localized factors and transitory. In fact, a deep dive into food inflation behaviour in the 2020s shows that high food inflation has become endemic (Table 1). This analysis reveals that in a staggering 57 per cent of months between June 2020 and June 2024, food inflation was at or above 6 per cent, with around 6 out of 12 food sub-groups experiencing 6 per cent and above inflation for 50 per cent or more of these months. This attests to the broad-based nature of high food inflation persistence. Barring sugar and confectionary, all other food sub-groups experienced high food inflation in more than one-third of the months considered. Furthermore, double digit food inflation was observed for an extended period of time in key food sub-groups. Vegetable price spikes are generally assumed to be transitory, but double digit inflation was experienced in this category in 22 out of the 49 months (in 45 per cent of the months) considered for the analysis, due to multiple and overlapping shocks. Double digit inflation has occurred for 24 months in respect of pulses and oils and fats (i.e., in 49 per cent of the months considered) and for 30 months in respect of prices of spices (in around 60 per cent of the months considered). Other key food sub-groups like cereals and eggs also experienced double digit inflation for about 15 months (in 31 per cent of the months considered). As pointed out earlier, adverse supply shocks to both kharif and rabi crops contributed to the high incidence of double digit inflation seen in these sub-groups. Extreme inflation pressures of 20 per cent or above have been observed in vegetables, oils and fats, and spices food sub-groups. In terms of perishables (weight of around 32 per cent in the overall CPI and around 71 per cent in the CPI food group) and semi-perishables/non-perishables (weight of around 13 per cent in overall CPI and around 29 per cent in the CPI food group)4 inflation rates showed distinctive trajectories as well as similarities. Perishables food inflation has been volatile in the 2020s, with an increase in the episodes of price spikes driven by supply shocks. Since November 2023, perishables inflation has remained persistently elevated, averaging 7.0 per cent and moving in a range of 6.5 per cent to 7.8 per cent. In case of semi/non-perishables, inflation has shown dramatic increases before becoming persistently elevated. Inflation in this category edged up from a low of 0.5 per cent in July 2021 to a high of 11.8 per cent in February 2023 and remained elevated thereafter, averaging around 10 per cent and moving in a narrow range of 9.6 per cent to 11.2 per cent (Chart 3). To sum up, by 2024 both perishables and semi/non-perishables food inflation has become sticky at highly elevated levels.  III. Decomposing Food Inflation Persistence In these unusual circumstances, standard estimation procedures employing autoregressive univariate methods capture only the backward-looking element in inflation persistence. With the multiplicity of factors driving the food inflation process in India, however, the estimation of drivers of inflation persistence in a structural framework is necessitated (Patra et al. 2014). Hence, the stickiness in food inflation is analysed in a time varying framework in which the parameters as well as the standard deviation of food price shocks are allowed to change over time (Stock and Watson, 2007; Cogley and Sbordone, 2008; Cogley et al., 2010). For this purpose, food inflation is decomposed into intrinsic persistence, extrinsic persistence, time varying trend and pure shocks. Intrinsic persistence represents the dependence of inflation on its own history of past experiences or its backward-lookingness and is measured by the coefficient of the lagged food inflation term. Extrinsic persistence is the stickiness due to demand conditions encapsulated in variations in the output gap. It captures the impact of the evolution of overall macro-conditions on food prices (Altissimo et al., 2006). When expectations relating to food inflation rise, this leads to their unanchoring and this pushes the trend food inflation higher. Thus, a rising food inflation trend can be treated as a measure of increasing expectations of food inflation by agents in any economy. This is somewhat different from intrinsic persistence, which is acquired solely from adaptive expectations. In this model, shocks denote pure transitory price changes due to variations in supply conditions. These shocks are essentially deviations of food inflation that are not accounted for by intrinsic persistence, extrinsic persistence and time varying trend. Considering the varying nature of the shocks, we assume that their volatility is stochastic in nature. 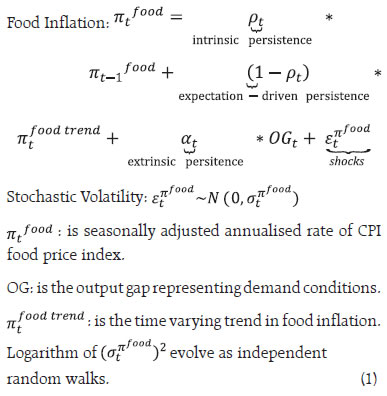 The time varying parameters are estimated by the Bayesian Markov Chain Monte Carlo (MCMC) method using the codes of Nakajima (2011)5 on monthly data from January 2011 to June 2024. The results indicate that food inflation has been rising since the second half of 2019, primarily driven by its time varying trend or the secular upward drift in expectations (Chart 4). Intrinsic persistence is also found to contribute significantly to the food inflation process during this period – past food inflation developments, especially the high inflation episodes, have a bearing in shaping current food inflation movements. Extrinsic persistence or demand conditions contributed negatively to food inflation between 2020 to H1:2023. Most importantly, unfavorable supply shocks contributed significantly to elevated food inflation in 4 out of 5 years, i.e., since 2019-20, invalidating the perception of these events being transitory in nature (Table 2). In every year since 2019-20 – except in 2021-226 – the Indian economy has faced adverse supply disruptions in agricultural conditions, in contrast to the previous five years when mostly favorable conditions prevailed. During 2019-24, agriculture production and supply chains were affected by multiple heat waves due to strong El Nino conditions; crop production shortfalls due to uneven south-west monsoons; La Nina conditions impacting rainfall patterns in the post-monsoon season; unseasonal rainfall and hailstorms; and temporal monsoon variability. These repetitive climate shocks pushed up food inflation as well. Measures taken for containment of specific idiosyncratic price pressures through pro-active supply management helped to minimise their unfavorable effects (Patra et al., 2024b). 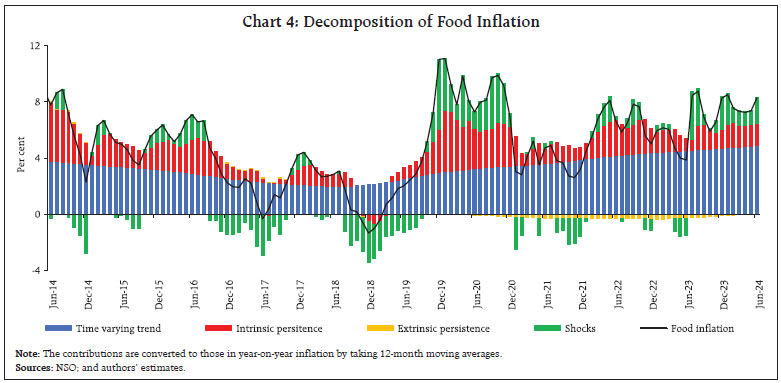 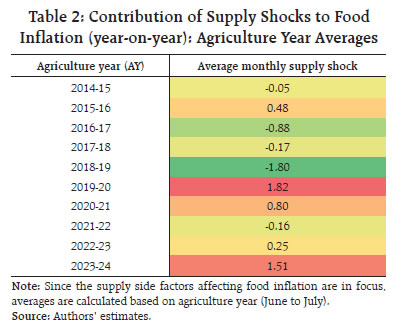 IV. Elevated Food Inflation and Inflation Expectations In this section we examine how elevated food inflation affects inflation expectation (IE) formation. We use inflation expectations collected through the Reserve Bank’s inflation expectation survey of households (IESH). IE is regressed on year-on-year food inflation, while also controlling for inflation target, which provides the nominal anchor for monetary policy, and the policy repo rate, i.e., its operationalization, using quarterly data from 2012-13 to Q1:2024-257. Food inflation has a statistically significant positive impact on inflation expectations, while monetary policy has a significant negative impact (Table 3). The long-run elasticity of food inflation on IE is 0.22. This shows that an increase in food inflation leads to unanchoring of IE. The dynamic multiplier8 suggests that an isolated food inflation shock impacts inflation expectation up to 2 quarters (Chart 5). The historical decomposition (HD) of inflation expectations (deviation from the average) derived from the regression equation suggests that the persistent and one-sided food inflation shocks that have been experienced in recent times are positively contributing to inflation expectations, but their impact has been largely offset by the restrictive monetary policy stance and supporting rate actions (Chart 6). The counterfactual is that the impact of food inflation shocks on expectations outcomes would have been substantially higher in the absence of disinflationary monetary policy. ![Chart 5: Dynamic Multiplier: [Shock: FoodInflation, Response: Inflation Expectation]](/documents/87730/28909807/02AR19082024_7.jpg) 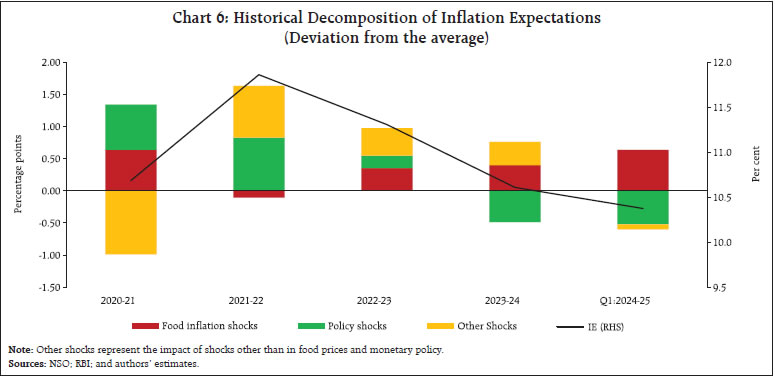 Spillovers of food price shocks to costs, service charges and output prices are evident in their statistically significant positive correlations with inflation expectations (Table 4). Positive correlation is also found between food inflation and input costs and output prices of manufacturing and services sectors embedded in purchasing mangers’ indices (PMIs) and an index of less-formal service charges compiled from the CPI data. Goods inflation seems to be more sensitive to the spillovers from food inflation shocks, as indicated by the significant and higher correlations of food inflation with manufacturing price expectations than with formal services sector’s expectations. Less-formal sector services charges have a much higher and statistically significant correlation with inflation expectations (0.68) and food inflation (0.38) than formal sectors, indicating their vulnerability to persistent food inflation shocks and spillovers. V. Food Price Spillovers in a Semi-structural Model The RBI’s Quarterly Projection Model (QPM) belongs in a genre of New-Keynesian open economy models and consists of six blocks viz., 1) an aggregate demand block; 2) an aggregate supply block; 3) a monetary policy rule; 4) an exchange rate block; 5) a fiscal block; and 6) the rest of the world block. It incorporates several India-centric features. The aggregate demand block has equations on output gap and bank lending conditions. The aggregate supply block separately models different components of inflation, viz., food, fuel and core. Food and fuel price spillovers to core inflation are modeled by using an expectations-augmented Phillips curve. The monetary policy interest rate function is a Taylor-type rule. The uncovered interest rate parity condition is modified to incorporate India-centric features like the effects of capital flows and the role of forex interventions (John et al., 2023). 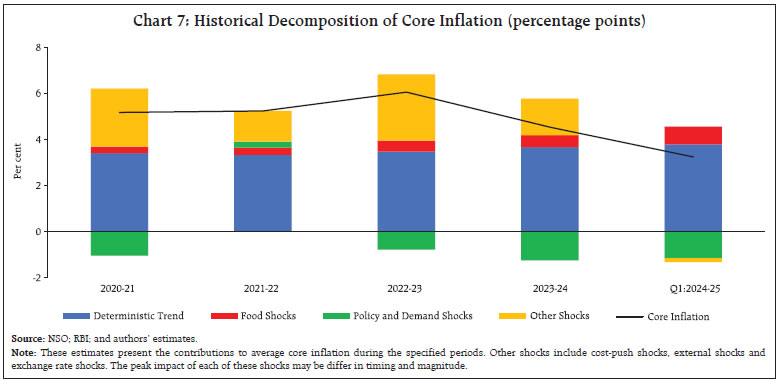 The QPM is used to estimate the HD of core inflation to evaluate the food price passthrough (Chart 7). Food price spill overs to core inflation have been increasing since 2022-23, with Q1:2024-25 registering a significant rise. Core inflation had been declining since 2022-23, mainly driven by monetary policy actions and stance and the waning of cost-push shocks. Food price shocks have been imposing upside pressures on core inflation throughout these years, but this has been offset by disinflationary monetary policy. Should this disinflationary force recede, upward pressures on core and headline inflation could get magnified and may run out of control, especially with aggregate demand picking up alongside cost-push risks looming in the wake of geo-political tensions. Monetary policy is the only active disinflationary agent in the economy. Going forward, therefore, if food price pressures persist and continue to spill over, a cautious monetary policy approach is warranted. The conventional treatment of food price perturbations as transitory in the setting of monetary policy is increasingly becoming untenable. A large part of this increase in persistence is driven by the secular upward drift in food inflation expectations. Past high food inflation episodes – intrinsic persistence – have a bearing in shaping these expectations. The inelasticity of the demand for food to price shocks makes food inflation persistence all the more worrying. With spillovers to costs, service charges and output prices, the danger of food inflation surfacing as a more generalised phenomenon has increased. Under these circumstances, the sources of food price shocks may lie outside the realm of monetary policy but when they result in food inflation acquiring persistence and spilling over into other components of inflation and into consumer behaviour, monetary policy must be disinflationary to quell these price pressures in order to achieve its mandate of price stability and thereby retain credibility. Failing to act against persistent food inflation risks expectations getting unanchored, generalisation of price pressures and loss of control over inflation, undermining of consumer and business confidence, and erosion of external sector sustainability and competitiveness, with deleterious consequences for growth prospects. References Altissimo, Filippo, Michael Ehrmann, and Frank Smets. (2006). “Inflation Persistence and Price-Setting Behaviour in the Euro Area: A Summary of the IPN Evidence”, ECB Occasional Paper Series, No. 46, June. Cogley, T., Primiceri, G. E., and Sargent, T. J. (2010), “Inflation-gap Persistence in the US”, American Economic Journal: Macroeconomics, Vol. 2(1), 43-69. Cogley, T., and Sbordone, A. M. (2008). Trend inflation, indexation, and inflation persistence in the New Keynesian Phillips curve. American Economic Review, 98(5), 2101-2126. John, J., Kumar, D. George, A. T., Mitra, P., Kapur, M., and Patra, M. D. (2023). A recalibrated quarterly projection model (QPM 2.0) for India. RBI Bulletin, February. Geweke, J. (1992). Evaluating the accuracy of samplingbased approaches to the calculations of posterior moments. Bayesian statistics, 4, 641-649. Nakajima, J. (2011), “Time-varying Parameter VAR Model with Stochastic Volatility: An Overview of Methodology and Empirical Applications”, Monetary and Economic Studies, November, 107-142. Patra, M., D. Khundrakpam, J. K, and George, A. T. (2014). “Post-Global Crisis Inflation Dynamics in India: What Has Changed?” India Policy Forum (10): 117-202. Patra, M. D. John, J. and George, A. T. (2024a). Are Food Prices the ‘True’ Core of India’s Inflation? RBI Bulletin, January. Patra, M. D. Bhattacharyya, I. and John, J. (2024b). Pushing Back Post-pandemic Price Pressures: A Monetary-Fiscal Symphony. Money, Banking and Finance, Economic and Political Weekly, Vol. 59, Issue No. 21, May. Stock, J. H., and Watson, M. W. (2007), “Why Has US Inflation Become Harder to Forecast?”, Journal of Money, Credit and Banking, Vol. 39, 3-33. ^ The authors are from the Reserve Bank of India. The views expressed in this article are those of the authors and do not represent the views of the Reserve Bank of India. 1 Average CPI food and beverages inflation for the period June 2020 to June 2024. 2 Average CPI food and beverages inflation for the period from September 2016 to March 2020. 3 El Nino and La Nina, the oceanic component, along with the Southern Oscillation, the atmospheric component, together constitutes the term El Nino/Southern Oscillation (ENSO). El Nino and La Nina which develops in in the Pacific Ocean affect rainfall patterns and surface temperatures across the world. El Nino can last up to 18 months and La Nina up to three years. The first “triple dip” La Nina of the 21st century began in September 2020 and continued till early 2023. In general, an inverse relationship exists between monsoon and ENSO, with the warm phase of ENSO (El Nino) generally associated with weaker than normal monsoon and vice versa, though there is no one-to-one correspondence between the two phenomena. (Sources: https://wmo.int/topics/el-nino-la-nina; https://oceanservice.noaa.gov/facts/ninonina.html; https://imdpune.gov.in/faq.php) 4 The CPI weighting diagrams for the 2012=100 base year series are based on the modified mixed reference period (MMRP) data of the 2011-12 Consumer-Expenditure Survey. Based on this, the items in food group can be classified into perishables (frequently purchased items, or items purchased in last 7 days) - like edible oil, eggs, fish, meat, vegetables, fruits, spices, beverages, processed foods, pan, tobacco and intoxicants - and semi-perishables/ non-perishables (items purchased in last 30 days) - like cereals, pulses, sugar and select processed food like jams, honey etc. 5 10,000 samples are drawn, after the initial 1000 samples are discarded. The draws look stable. The sample autocorrelations are low. The convergence diagnostics (CD) of Geweke (1992) suggest that, the null hypothesis of the convergence to the posterior distribution is not rejected. 6 Even though negative on an average, severe heat waves conditions in second half of AY 2021-22 had adversely impacted the output and yield of key rabi crops, driving food inflation high during H2 of the AY 2021-22. 7 All India CPI-Combined food and beverages inflation (year-on-year) data available from January 2012 onwards was used for the analysis. 8 Dynamic multiplier helps to understand the effect of changes in a shock variable on its response, over a period of time. |

Share this page:


Install the RBI mobile application and get quick access to the latest news!
Scan the QR code to install our app


Page Last Updated on:


