 IST,
IST,
Financial Stocks and Flow of Funds of the Indian Economy 2021-22
|
by Suraj S, Ishu Thakur and Mousumi Priyadarshini^ Sectoral financial trends during 2021-22 were shaped by the rebound in the domestic economy. India’s financial resource balance returned to the deficit territory from the transient net lender status in the preceding year which was, in turn, due to the pandemic-induced surge in household financial savings. Households and financial corporations remained as surplus sectors accommodating the deficits of general government and private non-financial corporations. Financial assets and liabilities of depository corporations, excluding the central bank, recorded the highest growth since 2013-14, driven by the banking sector. Amidst volatile global financial markets, growth of financial assets and liabilities of external sector moderated for the second year in 2021-22. Introduction The Indian economy rebounded in 2021-22 registering a growth of 9.7 per cent as against a 5.8 per cent contraction in 2020-21 in the aftermath of the Covid-19 outbreak. The recovery in domestic demand was supported by the pent-up demand which benefitted from the drawdown of precautionary savings, and congenial financial conditions engendered by prudent monetary, regulatory and fiscal measures (RBI, 2022). This article presents underlying trends in the financial stocks and flows (FSF) during 2021-22 across the institutional sectors of the Indian economy on a from-whom-to-whom (FWTW) basis. The analysis of financial flows provides insights into real economic activities and interconnections across sectors by tracking the sources and uses of funds alongside evolving macroeconomic trends. The FSF presentation adheres to the framework of financial accounts and institutional sectors1 as defined in the System of National Accounts (SNA) 2008. The non-consolidated detailed statements, based on the annual compilation cycle, are also being released as part of India’s G20 Data Gaps Initiative (DGI) commitment. Emphasising the significance of inter-sectoral relationships, the upcoming System of National Accounts (SNA) 2025 plans to feature a dedicated chapter on FWTW dimension of the sequence of accounts, providing an analytical tool to assess macroeconomic dynamics2. The compilation and availability of institutional and instrument-wise statistics are the most significant prerequisites for assessing the balance sheet of the economy and interconnectedness across sectors. With recovery in domestic demand, the economy returned to its net borrower status at (-) 0.8 per cent of the gross domestic product (GDP) in 2021-22, majorly on account of reduction in net resource flows from other depository corporations (ODCs) and other financial corporations (OFCs)3 and lower funding from households and private non-financial corporations. The ODCs experienced the highest growth in financial assets and liabilities since 2013-14. Deposits with ODCs grew robustly while credit growth was boosted by pent-up consumption demand. Resilient capital markets and strong retail participation contributed positively to the growth of assets under management (AUM) and net resource mobilisation of mutual funds, while insurance sector recorded a double-digit growth during the year. Sales and profits of the non-financial corporations (NFCs) improved during 2021-22, though the net financial wealth of the sector moderated. With recovery in consumption demand and gradual reduction in precautionary savings, household resource balance moderated to 7.5 per cent of GDP during 2021-22 from 11.9 per cent during 2020-21. As regards the external sector, foreign direct investment (FDI) flows and external commercial borrowings (ECBs) contributed to the accretion in foreign exchange reserves by USD 63.5 billion (RBI, 2022). The remaining part of the article is broadly structured as follows. Section II illustrates the sectoral and instrument-wise financial flows in the economy during the year under review. An assessment of the sectoral financial resource balance is presented in Section III. Section IV delves deeper into the financial trends observed for various institutional sectors. Section V concludes the article. II. Financial Flows: Sector and Instrument-Wise As per the sectoral balance sheets, HH and FCs remained as surplus sectors accommodating the deficits of the general government (GG) and private non-financial corporation (PvNFCs) [Chart 1]. HH with the highest net financial wealth, contributed 26.3 per cent to total financial assets as at end-March 2022. The share of GG, the largest net borrower, in total outstanding liabilities rose to 18.3 per cent from 18.0 per cent in 2020-21. PvNFCs recorded moderation both in financial assets and liabilities in 2021-22. Currency and deposits represented nearly a quarter of total assets and liabilities as at end-March 2022. Debt securities and loans and advances accounted for almost three-fourths of the total financial assets of FCs, while currency and deposits remained their major sources of funds. The liabilities of HH are mostly in the form of loans and borrowings, while their financial assets are mainly in the form of currency and deposits. Financial assets of RoW were majorly held as equity and investment funds, while among liabilities, debt securities continued to dominate, subscribed mostly by the central bank (Chart 2). 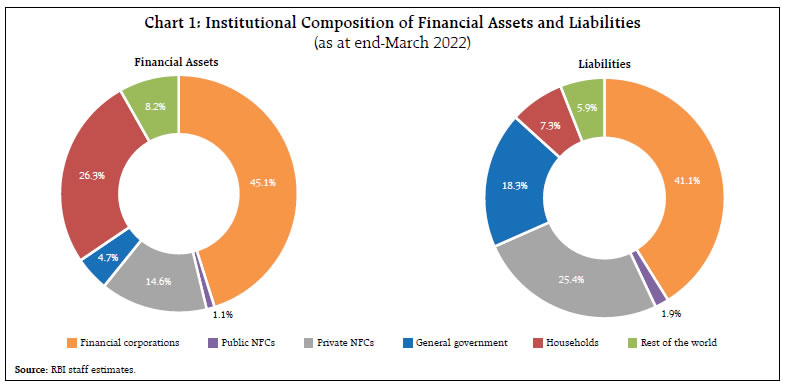 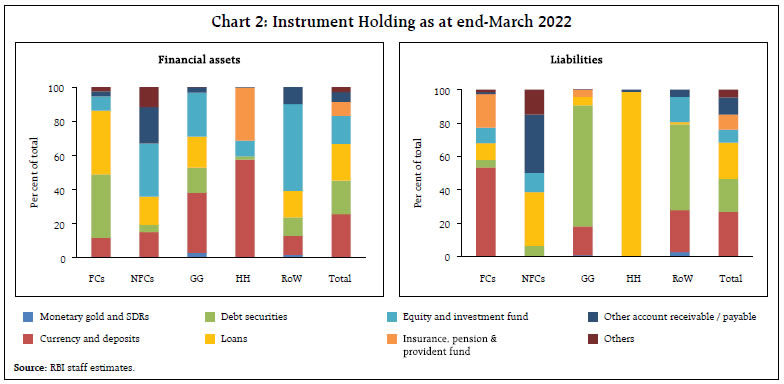 III. Financial Resource Balance Sectoral financial resource balance helps to identify the movement of funds between surplus and deficit sectors. In the Indian context, it is primarily from (i) private savings of households and financial corporations, and (ii) foreign sources (mirrored in the current account deficit [CAD]), bridging the requirements of GG and NFCs. With the recovery in economic activity during 2021-22 and the ebbing of the pandemic-induced restrictions on mobility and contact-intensive services, India’s financial resource balance returned to the negative trajectory at (-) 0.8 per cent of the GDP, in contrast to the preceding year, when a surge in household financial savings turned the economy into a net lender (Chart 3). 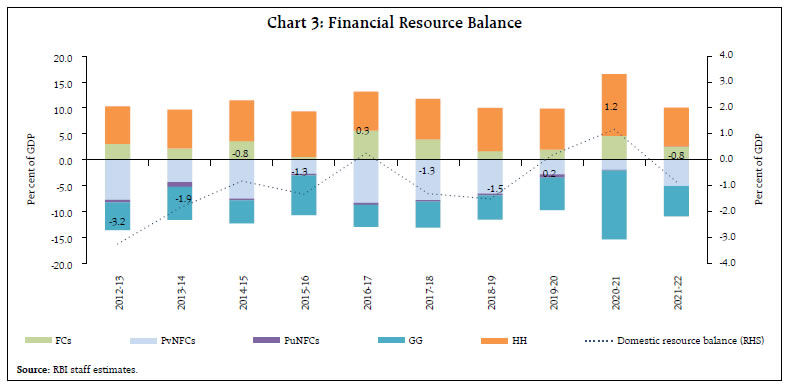 Net financial wealth4 (NFW) of all the domestic sectors at 29.8 per cent of GDP as at end-March 2022 was above its pre-pandemic level of 23.8 per cent in 2019-20 as well as 2018-19 (Table 1). Sector-wise, net financial wealth of all the domestic sectors, except GG and PuNFCs, fell during 2021-22 from the pandemic-led temporary jump seen in 2020-21. IV. Sectoral Financial Linkages Sectoral financial linkages capture interactions and interdependence of the various economic sectors. The directions of linkages of net flows (uses minus sources) during 2021-22 were broadly similar to those of the previous year as depicted in chord diagram (Chart 4). However, a shift in the weight in HH linkages with other sectors was visible during 2021-22. Net flows from HH to ODCs dropped in 2021-22 on account of revival of credit demand with the post pandemic normalisation of the economy. Net flows from ODCs to the central bank increased during 2021-22 reflecting policy measures by the Reserve Bank to absorb excess liquidity. These included the restoration of the cash reserve requirement (CRR) to its pre-pandemic level of 4.0 per cent of net demand and time liabilities (NDTL) in two phases of 0.5 percentage point each, effective the fortnights beginning March 27, 2021, and May 22, 2021. By end-March 2022, variable rate reverse repo (VRRR) auctions of varying maturities absorbed 70 per cent of the liquidity overhang (RBI, 2022). HH and PvNFCs provided relatively more funds to GG during 2021-22. In contrast to the previous year, PuNFCs turned net receiver of funds from GG during 2021-22 on account of capital infusion in the public sector. Sector-wise details are discussed in the following sub-sections. 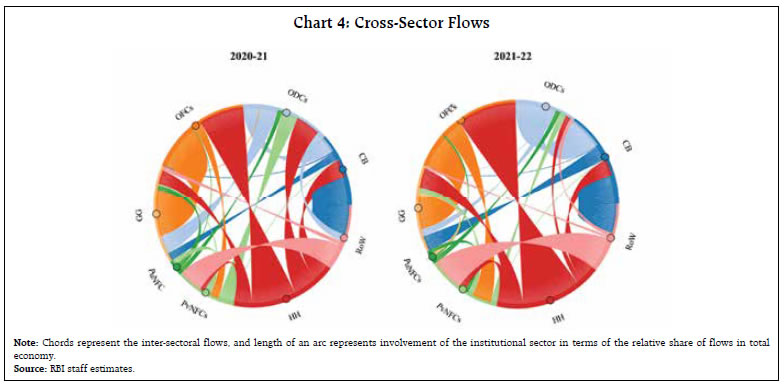 IV.1 Financial Corporations IV.1.1 Central Bank Globally, rising inflationary pressures and their persistence during 2021-22 compelled central banks to withdraw policy support extended during the pandemic, which was reflected in a reduction in their balance sheet size (as per cent to GDP) [Chart 5]. Growth in financial assets of the RBI decelerated to 8.4 per cent during 2021-22 from 15.3 per cent in the previous year. Financial assets and liabilities of RBI moderated to 26.2 per cent of GDP (from 28.7 per cent in 2020-21) and to 20.8 per cent (22.5 per cent in 2020-21), respectively. Resultantly, the NFW fell to 5.4 per cent in 2021-22 from 6.3 per cent in 2020-21. The increase in RBI’s financial assets in 2021-22 remained broad-based, with expansion in foreign investments, domestic investments, gold and loans and advances (RBI, 2022) [Chart 6]. Currency, the major liability for the RBI, increased by 9.9 per cent, while deposit liability increased by 16.1 per cent in 2021-22 on account of the rise in bank deposits along with the earlier noted normalisation of CRR. The category ‘others’, which include surplus payable to the central government, reduced in 2021-225 as compared to the previous year (Chart 7). IV.1.2 Other Depository Corporations The balance sheet of ODCs witnessed an accelerated expansion during 2021-22 with financial assets increasing by 9.8 per cent and liabilities by 10.0 per cent as economic activity picked up post-pandemic (Chart 8). 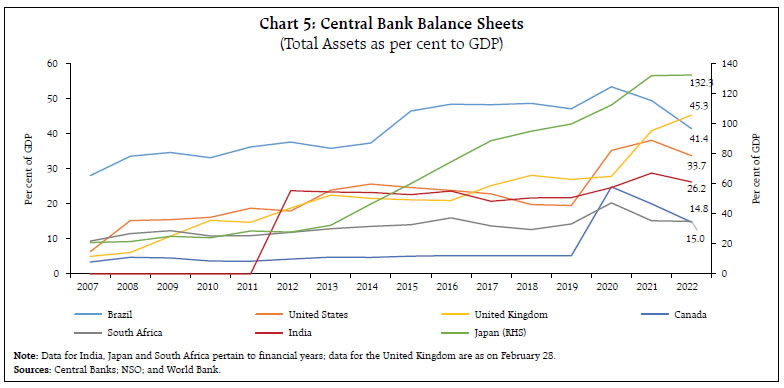 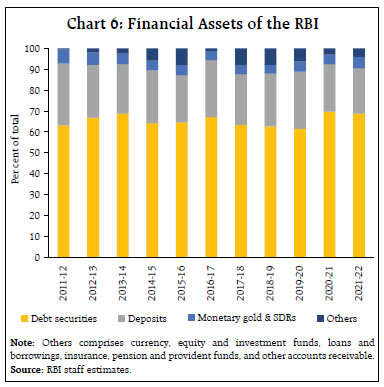 Deposits accounted for around 80.9 per cent of the total sources of funds for ODCs as at end-March 2022. Growth of deposits moderated in 2021-22, as households ran down excess pandemic-induced financial savings accumulated during 2020-21. On the asset side, credit offtake acceleration was led by services and retail loans during 2021-22. ODCs deployed more of their funds to meet the loan requirements of the private sector in 2021-22 in contrast to purchases of government securities during 2020-21 (Chart 9). 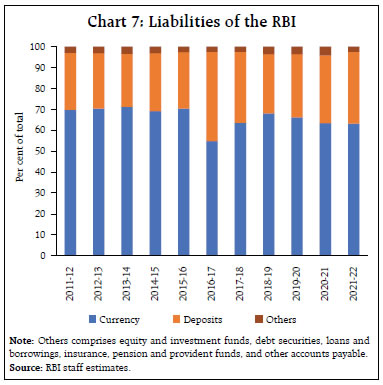 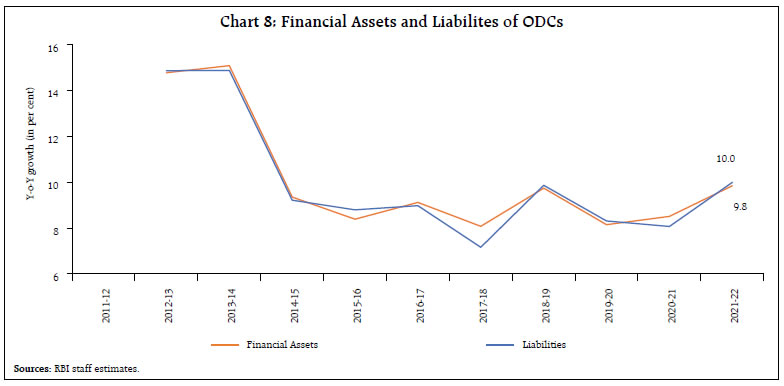 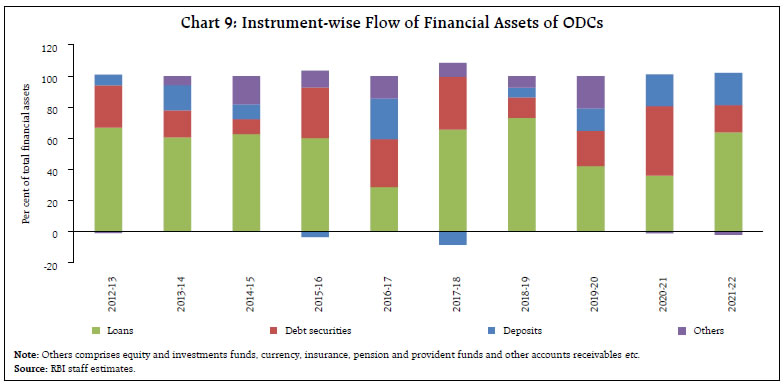 Asset creation by ODCs was more concentrated towards the household sector in 2021-22 as compared to general government in the previous year (Chart 10). IV.1.3 Other Financial Corporations6 Assets under management (AUM) as well as net resource mobilisation of the mutual funds (MFs) grew by 19.5 per cent and 14.9 per cent, respectively, during 2021-22, buoyed by resilient capital markets and robust retail participation with preference towards non-money market funds. The financial reach of MFs deepened accounting for 17.7 per cent of the total financial assets of the OFCs as at end-March 2022 as compared with 11.1 per cent as at end-March 2012 (Chart 11). 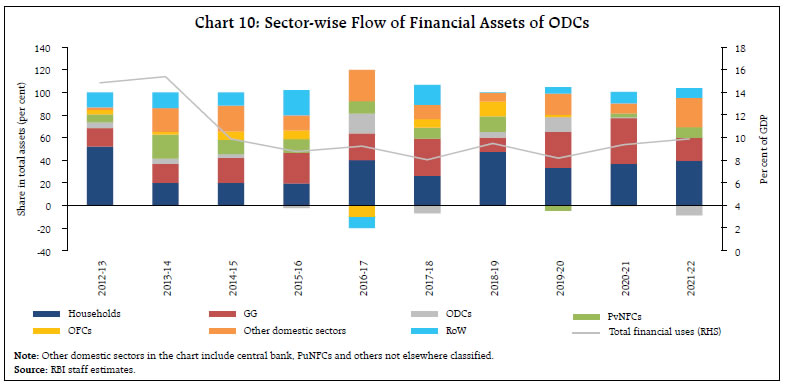 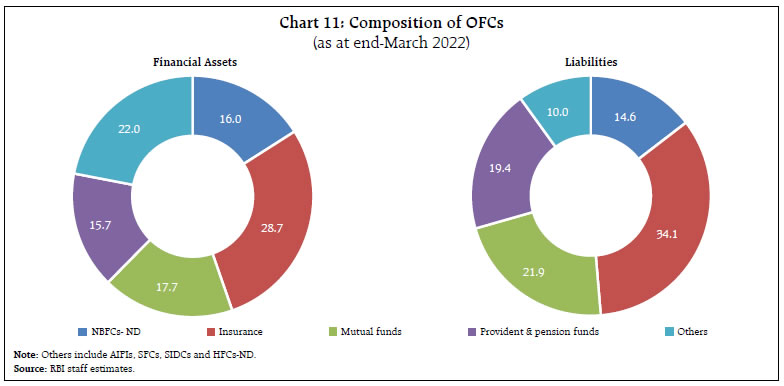 The insurance sector accounted for 28.7 per cent of total financial assets of OFCs as at end-March 2022. This sector plays a significant role in mobilising long-term capital, mainly from HH for lending to other sectors for infrastructure and related developments of the economy (Chart 12). 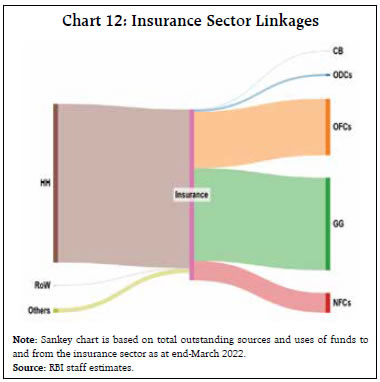 After clocking strong growth in the pandemic year7, the insurance sector maintained momentum during 2021-22, as financial assets and liabilities grew by 12.4 per cent each, with life insurance growing at a slightly higher pace. Heightened risk awareness post-pandemic contributed to increase in insurance density to US$ 91 in 2021-22 from US$ 78 in the previous year, while insurance penetration remained unchanged at 4.2 per cent8 (Chart 13). India is the 10th largest insurance market in the world with 1.9 per cent share in global insurance premium. India was one of the fastest growing markets in terms of premium paid in 2022 (Chart 14) [Swiss Re, 2023a]. Pension and provident funds’ balance sheet grew by 18.1 per cent in 2021-22 on top of 18.9 per cent increase in the previous year. Though equity investments by the pension and provident funds have gained traction recently, government securities remained the preferred investment avenue, reaching almost half of the total financial assets, and 60.3 per cent of total debt securities of the pension and provident funds as at end-March 2022 (Chart 15). 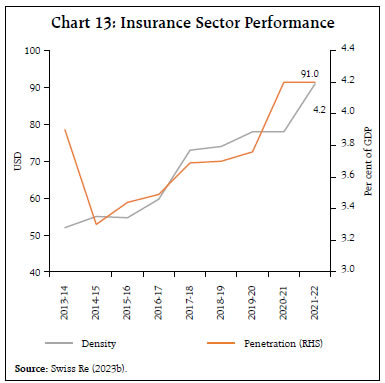 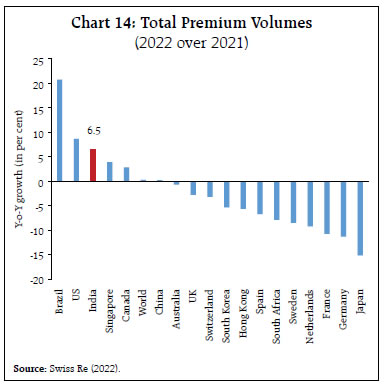 IV.2 Non-Financial Corporations The performance of NFCs improved during 2021-22, as benefitting from the economy moving towards normalcy. Notwithstanding the rise in expenses, growth in both before and after-tax profits of the private non-government non-financial (NGNF) sector accelerated9. The NFW of NFCs, after improving in 2020-21, however, declined marginally in 2021-22 on account of acceleration in the growth of net fixed assets (non-financial). 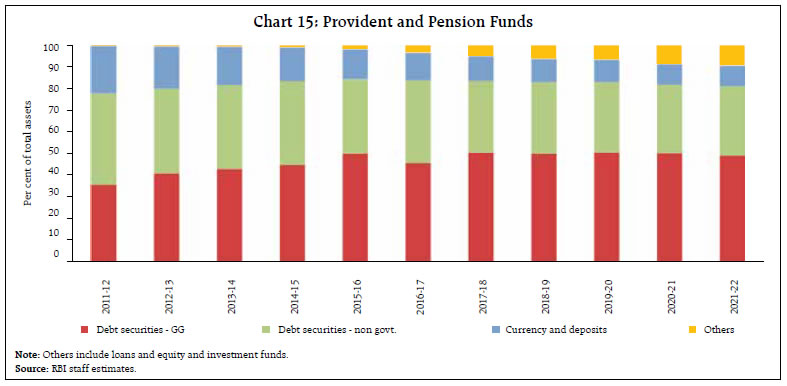 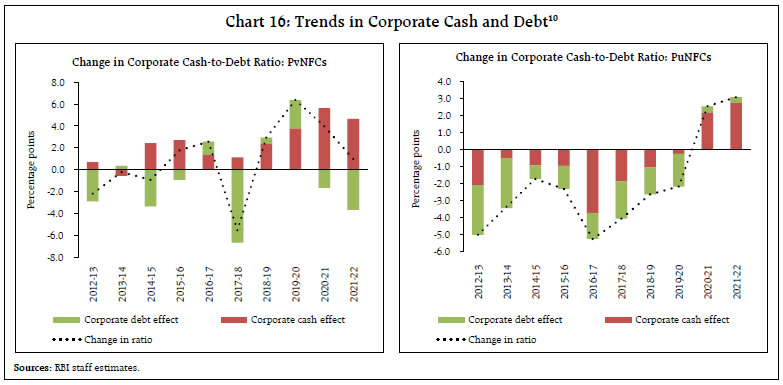 With sales increasing, the capital formation requirement (in terms of the net fixed assets) of NGNF companies also increased during 2021-22. Corporate cash-to-debt ratio11 increased further in 2021-22 on account of cash accumulation, with larger increment for PuNFCs (Chart 16). IV.3 General Government In line with the fiscal glide path envisioned by the Government of India (GoI), the fiscal deficit of the central government moderated to 6.8 per cent of GDP in 2021-22 from 9.2 per cent in the previous year. The consolidated gross fiscal deficit of states also fell to 2.8 per cent of GDP from 4.1 per cent in the preceding year due to higher revenue receipts with pick-up in economic activity post-pandemic (GoI 2022, RBI 2023). Accordingly, the financial resource gap of GG fell to 5.9 per cent of GDP and the government debt reduced to 86.8 per cent of GDP from 92.5 per cent in 2020-21 (Chart 17). Loans to OFCs and state governments as well as equity holdings make up the bulk of the central government’s assets. Equity investments of central government in statutory corporations (excluding FCI) and joint stock companies increased by 13.6 per cent during 2021-22. Out of the total commitment of infusing fresh equity of ₹5,000 crore in a phased manner, the central government injected ₹2,500 crore of equity capital and ₹5 crore capital into the Food Corporation of India (FCI) for godown constructions during 2021-22. India received an allocation of SDR 12.57 billion from the International Monetary Fund (IMF) in 2021-22, raising the SDR holdings of the central government along with a corresponding increase in liability towards the rest of the world.12 Debt securities issued by central government, contributing 76.4 per cent of total liabilities as of March 2022, rose by 11.3 per cent over the previous year. 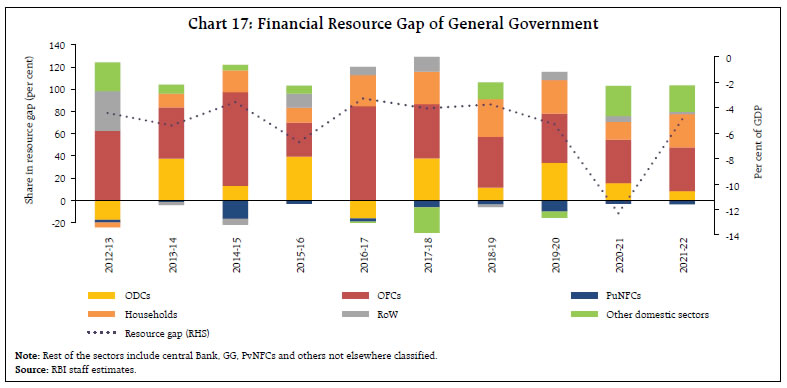 IV.4 Households (including NPISHs) The pandemic witnessed build-up of excess stock of financial savings13 by households at around 4.1 per cent of GDP as at end-March 2021 (RBI, 2024). With the release of pent-up demand, growth in financial assets dropped to 11.1 per cent in 2021-22 from 16.6 per cent in the previous year. Liabilities in the form of loans from the financial sector also picked-up, increasing by 11.2 per cent in 2021-22 as compared with an increase of 10.6 per cent in the previous year. With deceleration in the growth of financial assets on the one hand and the sustained increase in liabilities, the household resource balance moderated to 7.5 per cent of GDP during 2021-22 from 11.9 per cent in the previous year. Consequently, the NFW of households moderated to 93.5 per cent of GDP as at end-March 2022 from 100.0 per cent a year ago, but still well above the pre-pandemic NFW of 82.8 per cent in 2019-20. While ODCs remained the primary source of finance, lending from OFCs, notably NBFCs and HFCs, nearly doubled. Household debt declined to 38.5 per cent of GDP as at end-March 2022 from 41.2 per cent a year ago, reflecting nominal GDP growth effect as net credit effect remained almost stable (Chart 18)14. In terms of financial instruments, while currency holdings and deposits saw a moderate increase in 2021-22, household investments in mutual funds and small saving schemes witnessed significant growth, reflecting increased retail participation in the capital markets and other instruments for higher returns. Consequently, the flow of financial investments of households - referred to as gross financial savings - remained near the pre-COVID average15 at 11.4 per cent of GDP. 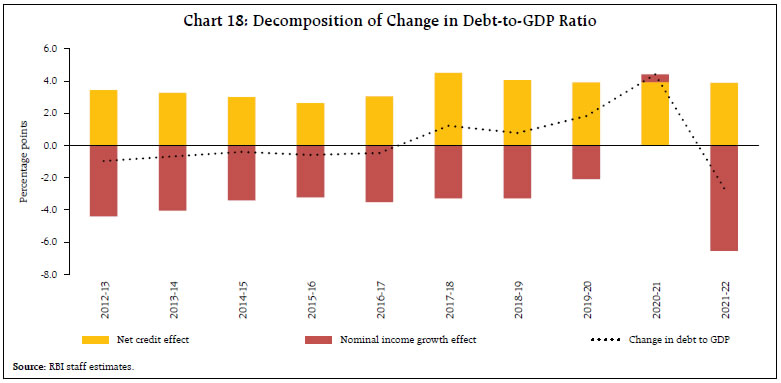 IV.5 Rest of the World In 2021-22, India returned to being a net borrower from RoW, with a modest current account deficit of 1.2 per cent of GDP. This was financed by net FDI and external commercial borrowings (ECBs), even as FPI flows witnessed reversals from the equity segment, especially in the second half of the year amidst global uncertainties. With overall capital flows in excess of current account deficit, there was an increase of USD 63.5 billion (excluding valuation changes) in foreign exchange reserves (RBI, 2022). Growth in liabilities of the RoW decelerated for the second consecutive year in 2021-22 (Chart 19). 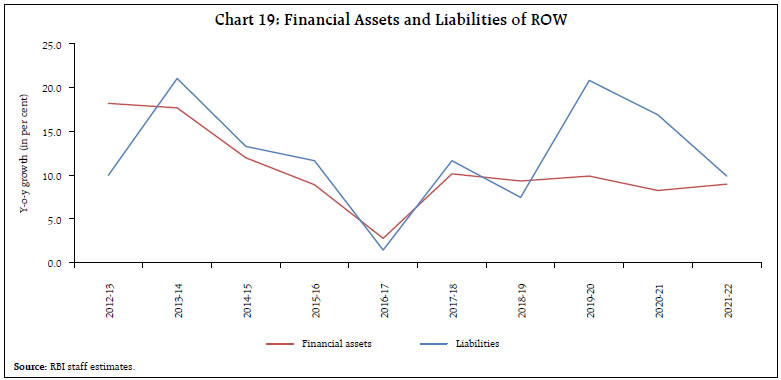 IV.6 Sector and Instrument-wise Heat Maps A snapshot of sectoral contribution to the total increase in financial assets and liabilities of the domestic sector is presented in tables 2 and 3, respectively. Financial assets of the domestic sector increased by 10.1 per cent during 2021-22, wherein HH made the largest contribution, followed by OFCs and ODCs. Instrument-wise, deposits contributed most to the increase, followed by loans and advances and debt securities. The increase in deposits was recorded across all the sectors with the maximum contribution by HH. Loans and advances were the second major contributor to the total domestic assets led by ODCs and OFCs. Equity investments saw a rise among OFCs, general government, and households. Furthermore, households as the sole contributor to assets of insurance, pension and provident fund witnessed an increase of 13.3 per cent during the year amidst Covid-19 uncertainties (Table 2). On the liability side, OFCs, ODCs and GG were the major drivers of the overall increase. Instrument-wise, loans and borrowing remained dominant, followed by deposits and debt securities. While loans and borrowings by the NFCs and households expanded in 2021-22, deposits held mainly with ODCs, GG and central bank increased during the year. Further, issuance of debt securities by general government and NFCs increased, but the same contracted by 5.9 per cent over the previous year in case of ODCs (Table 3). 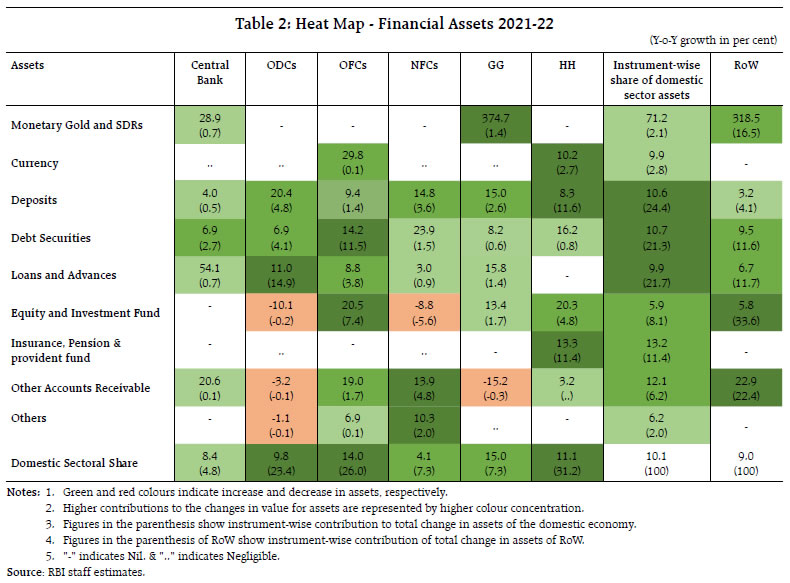 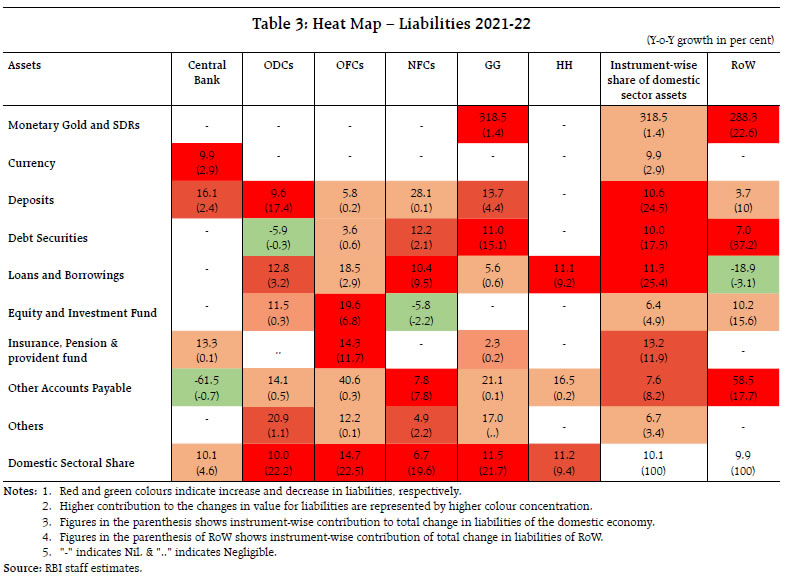 The sectoral analysis of financial stocks and flows (FSF) during 2021-22 indicates that households and financial corporations remained the surplus sectors accommodating the deficit of the general government and private non-financial corporations. As uses of funds outweighed sources across sectors, except general government (GG), net financial wealth of the domestic sector moderated to 29.8 percent of GDP at end-March 2022 relative to the previous year; however, it was well above the pre-pandemic position (23.8 per cent in 2019-20). The increase in corporate cash-to-debt ratio of NFCs and improvements in profitability provides headroom to the corporates for capital expenditure and capacity expansion. The net financial wealth (NFW) of households at 93.5 per cent of GDP as at end-March 2022, although lower than the preceding year, exceeded the pre-pandemic NFW of 82.8 per cent in 2019-20. References FSB (2022). G20 Data Gaps Initiative (DGI-2) Progress Achieved, Lessons Learned, and the Way Forward, June 2022. GoI (2022). Union Budget 2022-2023. Ministry of Finance. IRDAI. (2022). Handbook on Indian Insurance Statistics, Insurance Regulatory and Development Authority of India 2021-22. OECD (2017). Understanding Financial Accounts. Edited by Peter van de Ven, P. and D. Fano (eds.), OECD Publishing, Paris, https://doi.org/10.1787/9789264281288-en. Prakash, A., Sarkar, K.K., Thakur, I., Goel, S. (2023). Financial Stocks and Flow of Funds of the Indian Economy 2020-21. RBI Bulletin, March 2023. RBI (2022). Annual Report 2021-22. Reserve Bank of India. RBI (2023). State Finances: A Study of Budgets of 2022-23. Reserve Bank of India. RBI (2024). Annual Report 2023-24. Reserve Bank of India. SEBI (2022). Annual Report 2021-22. Securities and Exchange Board of India. Swiss Re. (2022). Sigma World Insurance: Inflation risks, front and centre. Swiss Re Institute. Swiss Re. (2023a). India’s insurance market: poised for rapid growth. Swiss Re Institute. Swiss Re. (2023b). Sigma World Insurance: Stirred and not shaken. Swiss Re Institute. ^ The authors are from the Department of Economic and Policy Research. The authors are thankful to Shri Anand Prakash and Dr. Anupam Prakash for their valuable suggestions and guidance. The views expressed in this article are those of the authors and do not represent the views of the Reserve Bank of India. 1 The institutional sectors include: (i) financial corporations (FCs); (ii) non-financial corporations (NFCs); (iii) general government (GG); (iv) households (HH) including non-profit institutions serving households (NPISHs). Rest of the world (RoW) is considered as a de facto sector because it only shows transactions of the domestic economy vis-a-vis non-residents and does not account for all the economic activities taking place abroad. 2 As per the annotated outlines prepared for the 2025 SNA chapters, from-whom-to-whom tables and related financial analysis form chapter 37. 3 ODCs include scheduled commercial banks (SCBs), regional rural banks (RRBs), co -operative banks, non-banking financial companies (NBFCs) - deposit taking, housing finance Companies (HFCs) - deposit taking, while OFCs include insurance corporations, pension and provident funds, mutual funds, NBFCs-non deposit taking, HFCs - non deposit taking, all India financial institutions (AIFIs), state finance corporations (SFCs) and state industrial development corporations (SIDCs). 4 NFW is the difference between stock of total financial assets and total liabilities (excluding equity and investment fund shares). 5 The Reserve Bank’s surplus payable to the central government for the year 2021-22 was ₹30,307 crore as compared with ₹99,122 for the previous year. 6 FSF compilation for 2021-22 also includes the fifth All India Financial Institution (AIFI) i.e., National Bank for Financial Infrastructure and Development (NaBFID), incorporated in April 2021. 7 Financial assets and liabilities of insurance sector grew by 21.7 per cent and 21.3 per cent during 2020-21, respectively. 8 Insurance density refers to the ratio of total insurance premiums (both life and non-life) to the total population, measuring the average insurance premium paid per person. Penetration measures the total insurance premiums as a percentage of GDP in the country. 9 Finances of Non-Government Non-Financial Private and Public Limited Companies, 2021-22, Reserve Bank of India.  11 Corporate cash includes ‘currency and deposits’ and ‘debt securities’ on the asset side reflecting the preference of corporates for holding liquid and safe assets. Debt comprises ‘debt securities’ and ‘loans and borrowing’. 12 As per the System of National Accounts 2008, SDRs issued by the IMF are treated as an asset of the country holding the SDR and a claim on the participants in the scheme collectively. 13 Flow of excess savings (savings rate minus trend savings rate) is accumulated to arrive at the stock of savings. Stock begins accumulating from 0 at t=-1, where t=0 is the first period of low growth due to COVID-19. Excess savings are calculated as deviation from the predicted savings rate using a Hamilton trend.  15 The average gross financial savings of households from 2012-13 to 2019-20 was 11.3 per cent of GDP. |
Page Last Updated on:


