 IST,
IST,


Government Finances 2024-25: A Half-Yearly Review
|
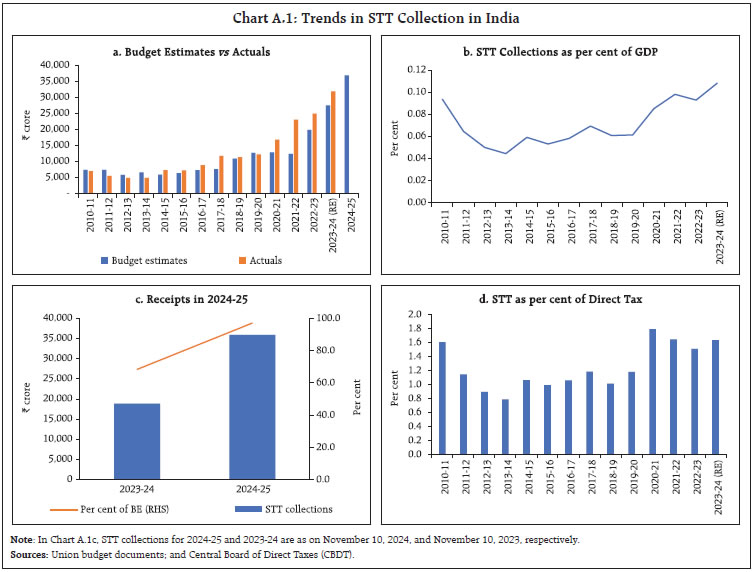
by Harshita Yadav, Aayushi Khandelwal, Kovuri Akash Yadav, Rachit Solanki, Anoop K Suresh, Samir Ranjan Behera and Atri Mukherjee^ The gross fiscal deficit as per cent of budget estimates moderated in H1:2024-25 over H1:2023-24 in case of both Centre and States, primarily on account of robust receipts, deceleration in their revenue expenditure growth and decline in capital expenditure. This provides fiscal room to them to boost capex in the latter half of 2024-25 which would aid in sustaining the post pandemic gains in expenditure quality and support medium-term growth prospects. Several States have announced sops in their 2024-25 Budgets; such spending may divert resources away from critical social and economic infrastructure development. Introduction The Union Budget 2024-25 chalked out a medium-term road map for Indian economy by presenting a detailed trajectory for the pursuit of Viksit Bharat. With its special focus on employment, skilling, micro, small and medium enterprises (MSMEs) and the middle class, the budget aimed at maintaining high growth rate while ensuring allocation of adequate resources for developmental needs. Continuing the thrust on infrastructure development, the Budget 2024-25 had provisioned ₹11.11 lakh crore (3.4 per cent of GDP) for capital expenditure which is higher than 3.2 per cent of GDP achieved in 2023-24 (provisional accounts, PA). On the other hand, revenue expenditure was budgeted to decline marginally from 11.8 per cent of GDP in 2023-24 (PA) to 11.4 per cent of GDP in 2024-25 (budget estimates, BE) thereby enhancing the overall quality of government expenditure. Further, towards incentivising States’ capital spending, allocation under the scheme – Special Assistance to States for Capital Investment - was enhanced. Overall, the Union Budget aimed at fiscal consolidation in 2024-25 in line with the medium-term target of GFD below 4.5 per cent of the GDP by 2025-26. The States too have endeavoured for fiscal consolidation in 2024-25, budgeting a consolidated GFD of 3.2 per cent of the GDP in 2024-25. The Centre’s revenue collections comprising both tax and non-tax sources were buoyant in H1:2024-25, primarily driven by income tax, goods and service tax (GST) and higher surplus transfer by the Reserve Bank. On account of robust receipts and relatively flat government spending, Centre’s GFD as per cent of BE during H1:2024-25 was the lowest in the last one decade. The growth in States’ revenue receipts during H1:2024-25 was driven by tax revenues, while there was a contraction in non-tax revenues and grants from the Centre. On the expenditure front, States sustained the pace of revenue expenditure during H1:2024-25, while their capital expenditure declined.1,2 The rest of the article is structured as follows: Section II analyses the receipt and expenditure of the Centre and States (at a quarterly frequency) for H1:2024-25. Section III deals with the outcomes in terms of key deficit indicators and their financing for the Centre as well as States. Section IV presents estimates on General government (Centre plus States) finances for H1 of 2024-25. Section V sets out concluding observations. II. Fiscal Outcomes in Q1 and Q2 During H1:2024-25, the Central government collected more than 50 per cent of its total budgeted receipts, in line with the trend witnessed during the recent past. On a year-on-year (y-o-y) basis, total receipts during H1:2024-25 rose by 15.5 per cent. On the other hand, the Centre’s total expenditure was contained below 50 per cent of the BE in H1:2024-25, in line with the pattern observed during the past three years (Chart 1a). States’ GFD stood at 43.9 per cent of the BE in H1:2024-25, marginally lower than the previous year mainly attributable to a slowdown in total expenditure as the States expended 39.8 per cent of BE vis-à-vis 40.1 per cent of BE in H1:2023-24 (Chart 1b). 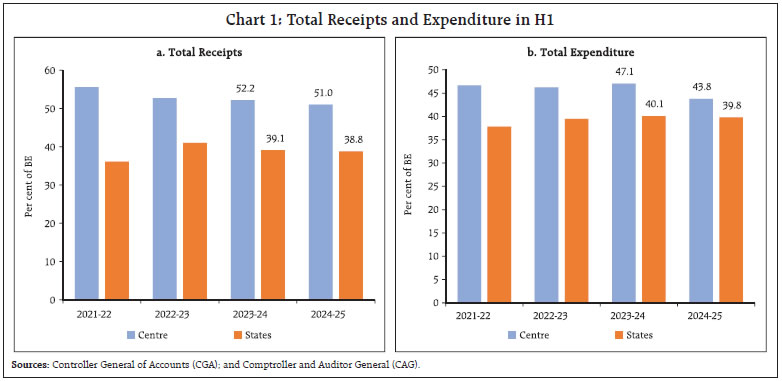 a. Receipts Revenue receipts of the Central government remained strong with a y-o-y growth of 16.1 per cent during H1:2024-25. In Q1:2024-25, the growth in the revenue receipts was 41.0 per cent on account of robust tax collections as well as the large surplus transfer of ₹2.1 lakh crore by the Reserve Bank. During Q2:2024-25, the revenue receipts contracted by 2.0 per cent, attributable to a fall in direct tax collections (Chart 2a). The performance of the non-debt capital receipts was subdued in Q1:2024-25, but recorded improvement in Q2:2024-25 (Chart 2b).3 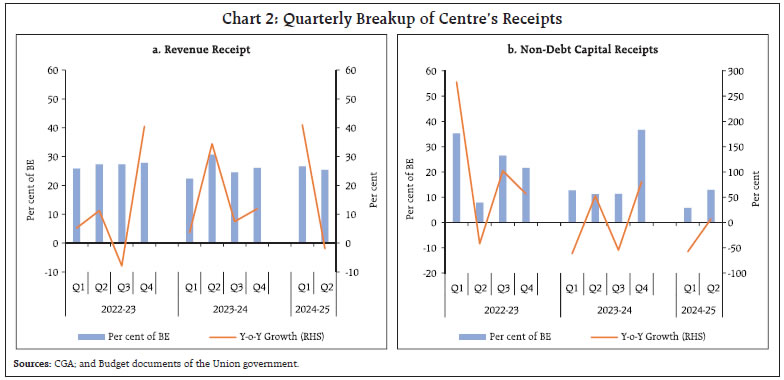 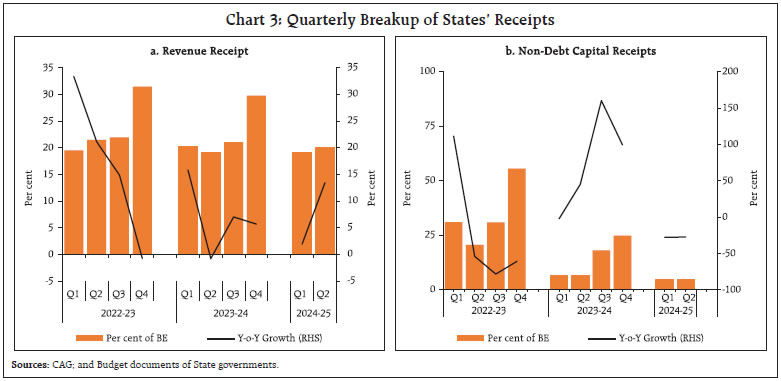 States’ revenue receipts clocked a y-o-y growth of 7.5 per cent in H1:2024-25 (7.1 per cent in H1:2023-24), with growth in Q1 and Q2 at 1.9 per cent and 13.4 per cent, respectively. Tax revenue, which accounted for 85.7 per cent of the revenue receipts during H1:2024-25, exhibited a growth of 16.4 per cent and 7.4 per cent in Q1:2024-25 and Q2:2024-25, respectively. States’ non-debt capital receipts4 contracted in both Q1 and Q2 of 2024-25 (Chart 3a and b). The Centre’s direct tax collection grew by 14.4 per cent on y-o-y basis in H1:2024-25, primarily led by a growth of 25.0 per cent in income tax collections with corporate tax collections registering a tepid growth of 2.3 per cent (Chart 4a). Similar to the pattern witnessed in H1:2023-24, income tax collections exceeded the corporate tax collections in H1:2024-25, reflecting, inter alia, measures towards improving taxpayers’ compliance and broadening the tax base. Moreover, within direct tax collection, receipts from security transaction tax have been robust in recent years with increased volume of trading in the Indian stock market (Box A).
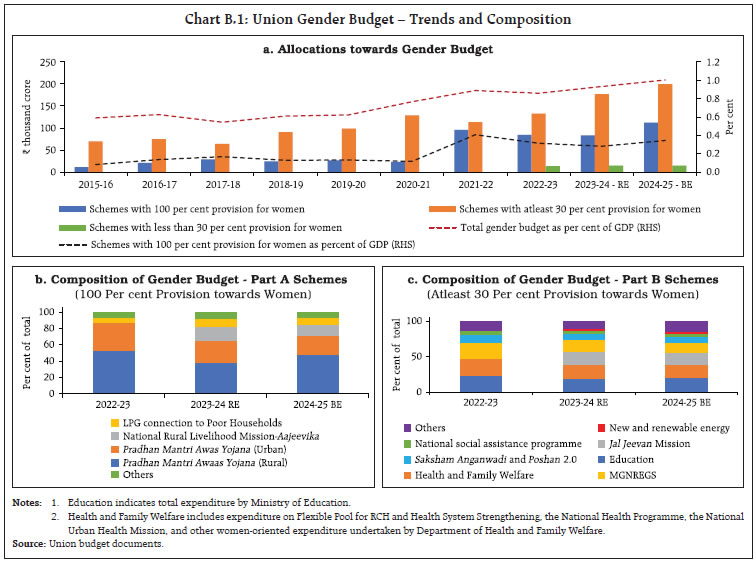
States’ own direct tax collection (comprising of land revenue and receipts from stamp duty and registration fees) performed well during H1:2024-25 with a growth of 13.2 per cent (12.2 per cent in Q1 and 14.2 per cent in Q2) (Chart 4b). 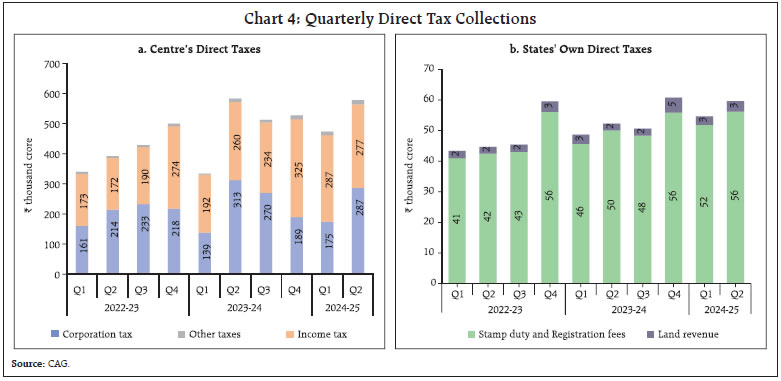 The Centre’s indirect tax collection grew by 8.9 per cent (y-o-y) in H1:2024-255, led by GST. During Q1:2024-25, the indirect tax collections grew by 5.6 per cent (8.9 per cent Q1:2023-24), supported by 9.1 per cent growth in GST collections (11.5 per cent growth during Q1:2023-24). On the other hand, customs and excise duty collections witnessed a contraction in Q1:2024-25. In Q2:2024-25, buoyed by the festive demand, GST collections posted a growth of 11.8 per cent (6.0 per cent a year ago). Customs and excise duty collections recovered in Q2 with a growth of 15.6 per cent and 5.7 per cent, respectively. The GST collection (Centre plus States) in H1:2024-25 amounted to ₹10.9 lakh crore, registering a y-o-y growth of 9.5 per cent (11.1 per cent growth recorded in H1:2023-24), with average monthly collections in Q1 and Q2 of ₹1.86 lakh crore and ₹1.77 lakh crore, respectively (Chart 5). In the case of States, the growth in tax revenues in H1:2024-25 was supported by States GST (SGST) and tax devolution from the Centre. Strong growth in SGST reflected rising demand, higher tax rates and greater compliance. In H1:2024-25, the assignment to States recorded a growth of 19.6 per cent over the corresponding period of the previous year (Chart 6a and b). Centre’s non-tax revenue witnessed a contraction of 5.7 per cent y-o-y in Q2:2024-25, as higher dividends and profits as well as interest receipts6 were offset by a fall in revenue from economic services.7 Disinvestment receipts remained muted in H1:2024-25 with 6.3 per cent of the budgeted amount being raised (11.4 per cent in H1:2023-24) (Chart 7).8 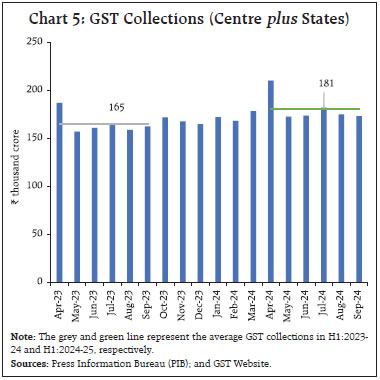 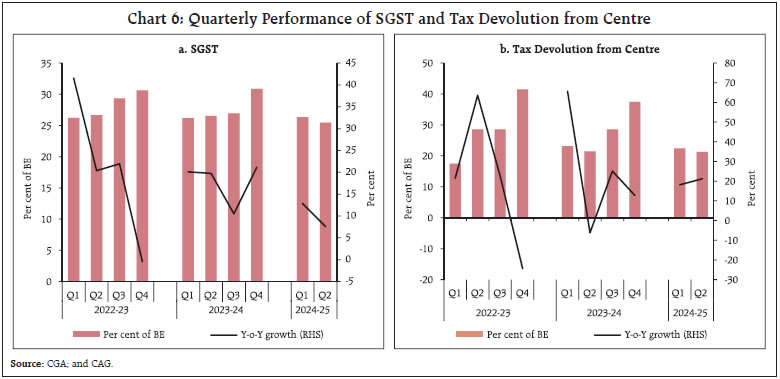 b. Expenditure In 2024-25 (BE), the total expenditure of the Central government has been budgeted to grow by 8.5 per cent over 2023-24 (PA), with revenue expenditure growth budgeted at 6.2 per cent and capital expenditure growth at 17.1 per cent.9 In H1:2024-25, revenue expenditure as per cent of BE remained broadly in line with previous years trends while capital expenditure registered moderation. The relatively lower share of budgeted expenditure realised during H1:2024-25 is, inter alia, attributable to the model code of conduct imposed during the general elections in Q1:2024-25 (Chart 8). 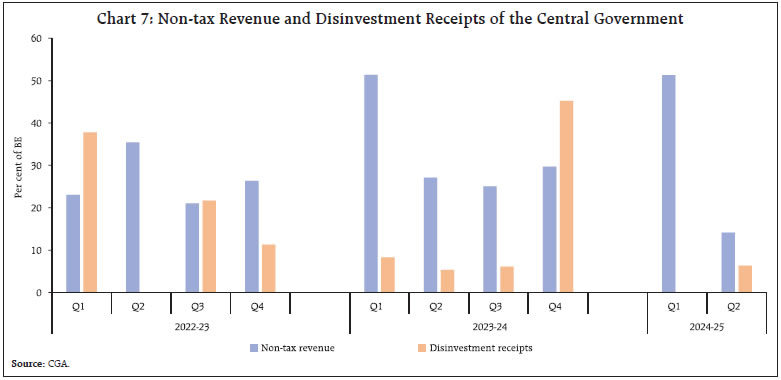 Capital expenditure of the top 6 ministries,10 which comprise 95 per cent of the total budgeted capex for 2024-25, fell to 37.3 per cent of BE during H1:2024-25 (vis-à-vis 51.8 per cent of BE in H1:2023-24) (Chart 9). Similarly, the expenditure under the scheme for ‘Special Assistance to States for Capital Investment’ fell to ₹30,040 crore during H1:2024-25 (vis-à-vis ₹53,541 crore during H1:2023-24).11 In September 2024, the Ministry of Finance (MoF), Government of India (GoI) eased the cash management guidelines which should boost public spending12 including capital expenditure in H2:2024-25. Further, the Union government had also proposed the first batch of supplementary demand for grants for 2024-25 during the winter session of parliament which involves a net cash outgo of ₹44,143 crore (Chart 10). 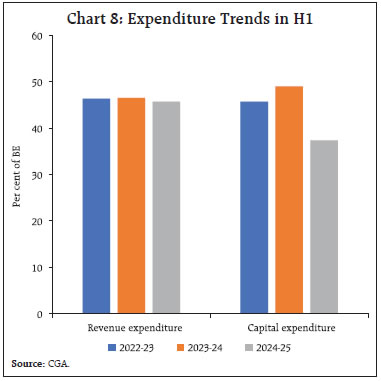 The outgo of the Central government on major subsidies, comprising food, fuel and fertilisers, moderated to 56.3 per cent of BE in H1:2024-25 from 55.1 per cent of BE in H1:2023-24, primarily attributable to lower y-o-y expenditure on nutrient based subsidy on account of a fall in international fertiliser prices (58.2 per cent of BE in H1:2024-25 vis-à-vis 95.9 per cent of BE in H1:2023-24). Food and fertiliser subsidies accounted for 56.6 per cent and 41.7 per cent of total outgo on major subsidies in H1:2024-25 vis-à-vis 46.1 per cent and 53.4 per cent, respectively, in the corresponding period of the previous year (Chart 11). 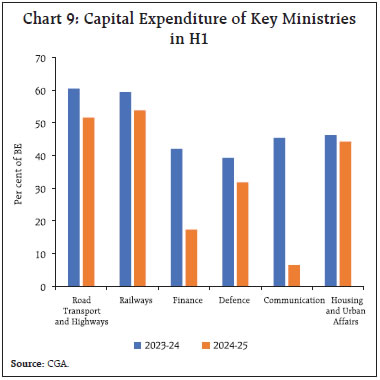 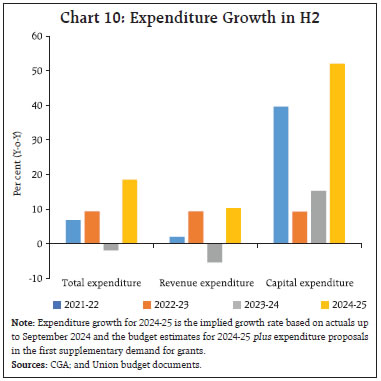 India is transitioning from women’s development to women led development.13 The Centre’s expenditure for schemes for the welfare of women and empowerment of women has grown from ₹81,249 crore in 2015-16 to ₹3,27,158 crore in 2024-25 (BE). The share of the gender budget in the total Union Budget has increased to 6.8 per cent in 2024-25 (BE), the highest since the introduction of gender budget statements (GBS) in 2005-06 (Box B). 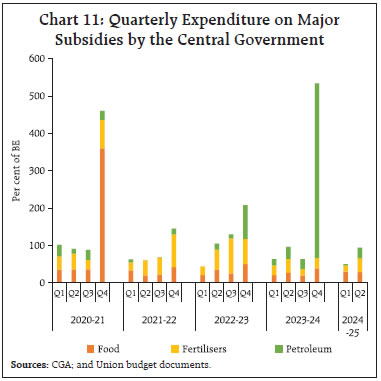
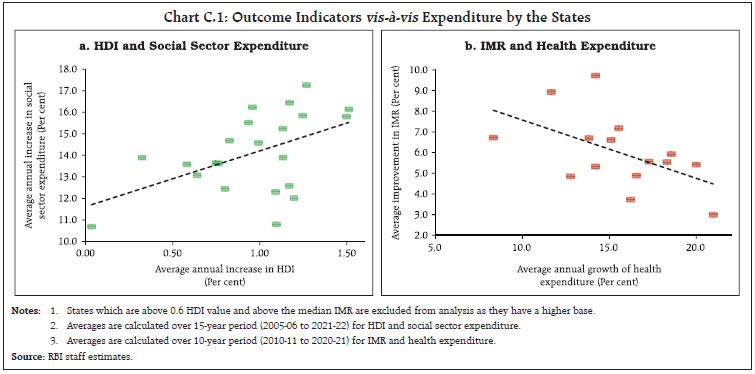
States’ revenue expenditure growth in Q1 and Q2 of 2024-25 at 8.9 per cent and 11.4 per cent, respectively, was higher than the growth registered in the corresponding quarters of 2023-24. States exhausted 41.6 per cent of their budgeted revenue expenditure in H1:2024-25 (41.3 per cent in H1:2023-24). On the other hand, their capital expenditure contracted by 6.9 per cent in H1:2024-25, with decline of 20.1 per cent in Q1:2024-25 and an increase of 1.8 per cent in Q2:2024-25 (Chart 12a and b). Greater focus on outcomes can enhance expenditure efficiency (Box C). 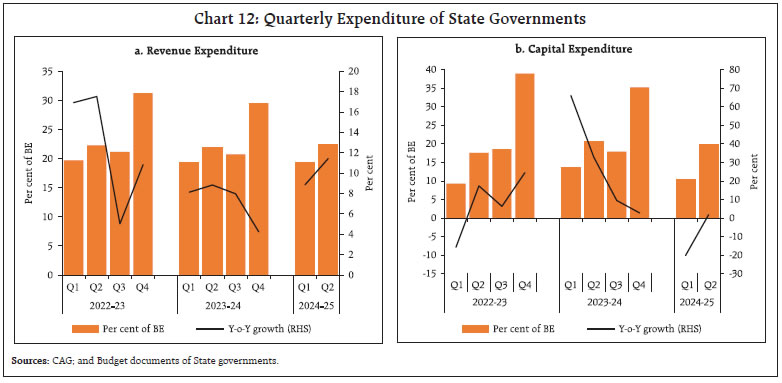
III. Fiscal Deficit and its Financing Central Government a. Fiscal Deficit The Union government budgeted for a GFD of 4.9 per cent of GDP in 2024-25 as compared with 5.6 per cent in 2023-24 (PA), in line with the glide path to achieve medium term GFD target of below 4.5 per cent of GDP by 2025-26. During H1:2024-25, GFD of the Union government stood at 29.4 per cent of the BE, down from 39.3 per cent during the corresponding period of 2023-24, and the proportion was at its lowest in a decade (Chart 13a and b). Similar reductions were seen in revenue deficit and primary deficit in H1:2024-25. b. Financing of GFD In H1:2024-25, the Union government completed 52.8 per cent of the budgeted market borrowings for 2024-25, which financed the major chunk of its GFD during the first half of the year. The government has decided to adhere to its borrowing target for H2:2024-25. 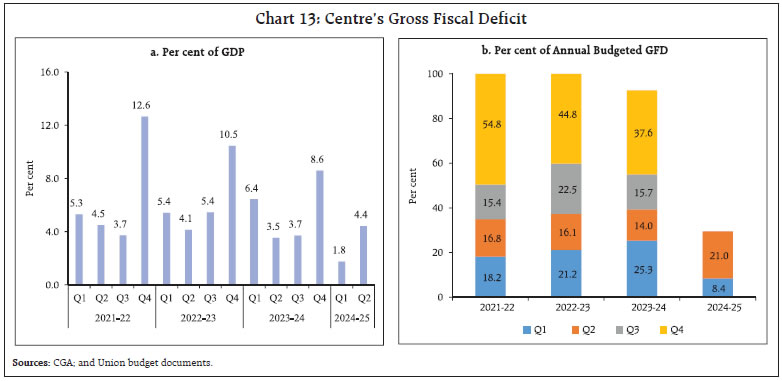 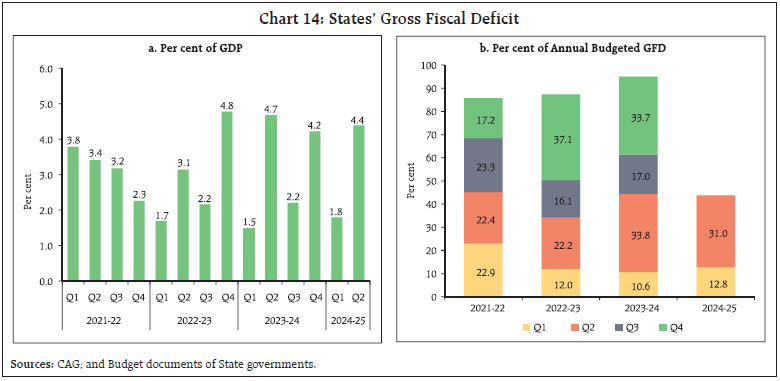 State Government a. Fiscal Deficit The States had budgeted a consolidated GFD of 3.2 per cent of GDP for 2024-25, as against 2.9 per cent in 2023-24 (PA). During 2024-25, the States have exhausted a lower proportion of their budgeted GFD in Q1 and Q2 compared to the previous year. Correspondingly, the fiscal space available to States in the latter half of 2024-25 is 56.1 per cent of their budgeted GFD, above 55.6 per cent for the corresponding period of the previous year (Chart 14a and b). The revenue expenditure to capital outlay (RECO) ratio of the Centre rose to 4.7 in H1:2024-25 from 3.9 a year ago, given the contraction in capital outlay. During the same period, the ratio for States also rose to 8.3 from 6.6 (Chart 15a and b). 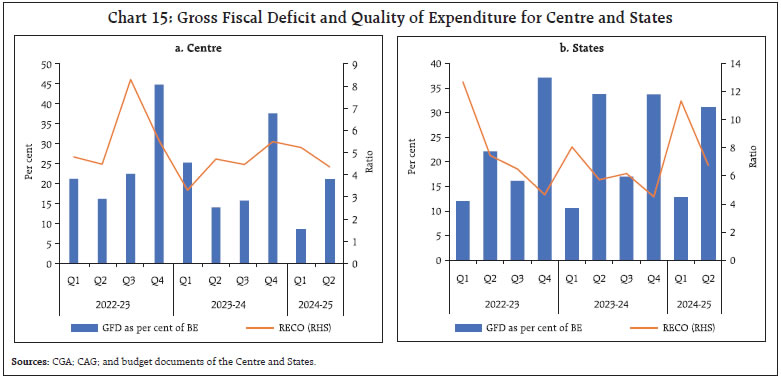 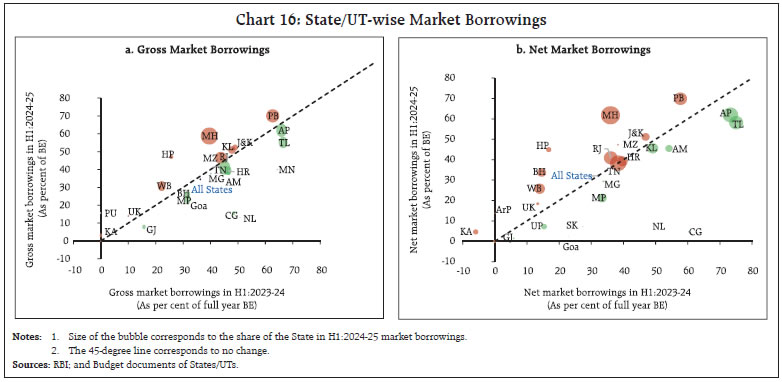 b. Financing of GFD The net market borrowings by States during H1:2024-25 registered a growth of 13.2 per cent over the same period in the previous year. During this period, States utilised 32.1 per cent of their budgeted net market borrowings (32.2 per cent in the corresponding period of 2023-24). Thirteen States utilised a higher proportion of their budgeted net borrowings compared to the same period in the previous year. Gross market borrowings increased by 7.7 per cent over the previous year, representing 34.5 per cent of the budgeted amount (Chart 16a and b). The financial accommodation availed by States through various facilities provided by the Reserve Bank increased by 36.6 per cent in H1:2024-25 over the corresponding period in the previous year. The ways and means advances (WMA) limits were revised effective July 1, 2024. The aggregate WMA limit for States/UTs now stands at ₹60,118 crore, an increase of 27.9 per cent over the earlier limit of ₹47,010 crore. Consequently, States utilised 9.6 per cent of the permissible WMA limit in Q1:2024-25 and 8.8 per cent in Q2. The average utilisation by States under WMA and the special drawing facility (SDF) rose by 21.9 per cent and 45.1 per cent, respectively, while the usage under the overdraft (OD) facility increased by 9.8 per cent in H1:2024-25 (Chart 17a and b). IV. General Government Finances The GFD for the general government (Centre and States combined) is budgeted lower at 7.6 per cent of the GDP in 2024-25 (BE) from 9.0 per cent of GDP in 2023-24 (RE). In Q1:2024-25, the GFD-GDP ratio was lower on account of muted growth in total expenditure of the Centre and States along with robust tax collection. As the expenditure of the Centre and States picked up in Q2:2024-25, the GFD-GDP ratio increased in line with its previous trends (Chart 18). 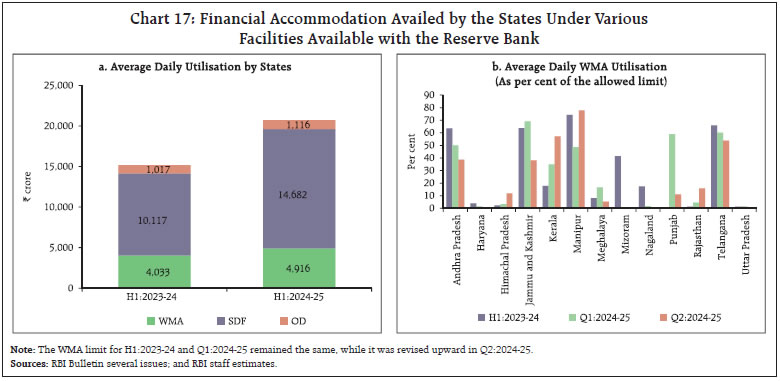 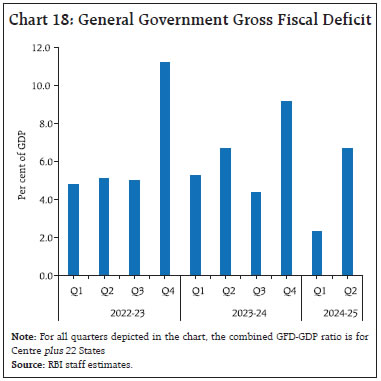 The Centre recorded higher tax collections, both direct and indirect, and the buoyancy is expected to continue. Non-tax revenues of the Centre were boosted by the large surplus transfer by the Reserve Bank. The government spending, both Centre and States, was dampened in H1:2024-25 reflecting, inter alia, the impact of model code of conduct for general elections and is expected to pick up pace in H2:2024-25. Overall, the Centre has achieved more than half of its budgeted revenue in H1:2024-25 while containing its expenditure to less than half of what it had projected for the entire financial year. This augurs well for the Centre to meet its GFD target of 4.9 per cent of GDP for 2024-25. Several States have announced sops in their 2024-25 Budgets including free electricity to agriculture and households, free transport, allowances to unemployed youth and monetary assistance to women. Such spending may divert resources away from critical social and economic infrastructure development.
^ This article is prepared under the overall guidance of Smt. Rekha Misra. The authors are from the Department of Economic and Policy Research (DEPR) of the Reserve Bank of India. The views expressed in this article are those of the authors and do not represent the views of the Reserve Bank of India. 1 The data pertain to 22 States for which the data for April-September 2024 are available. GFD-GDP ratio is estimated using GSDP data for the same 22 States. 2 Detailed statements on half yearly and quarterly financial position of the Centre as well as States are provided in Appendix Tables (I to IV). 3 Non-debt capital receipts include recoveries of loans and advances and miscellaneous capital receipts (viz., disinvestment and other receipts). 4 Non-debt capital receipts of the States comprise of recoveries of loans and advances disbursed by them to subordinate/parastatal entities and other miscellaneous capital receipts. 5 During H1:2023-24, Centre’s indirect tax collections grew by 6.5 per cent over H1:2022-23. 6 Non-tax revenue from ‘dividends and profits’ and ‘interest receipts’ accounts for 53.0 and 7.0 per cent of the budgeted non-tax revenue, respectively, in 2024-25. 7 Non-tax revenue from economic services includes agriculture and allied activities (receipts from agricultural farms, commercial crops, fees from agricultural education, fees for quality control and grading of agricultural products, etc.), irrigation and flood control (receipts of Central Water Commission and Central Water Power Research Station, Pune etc.), communication (includes license fees from telecom operators and receipts on account of spectrum usage charges) etc. Non-tax revenue from economic services accounts for 33.4 per cent of the budgeted non-tax revenues in 2024-25. 8 During H1:2024-25, the government mobilised ₹3,167 crore in the form of disinvestment receipts as compared with ₹6,949 crore during the corresponding period of the previous year. 9 Capital outlay (viz., capital expenditure excluding loans and advances) was budgeted to increase by 16.7 per cent in 2024-25 vis-à-vis an increase of 26.0 per cent in 2023-24 (PA). 10 Ministry of Road Transport and Highways, Ministry of Railways, Ministry of Finance, Ministry of Defence, Ministry of Communications and Ministry of Housing and Urban Affairs. 11 Monthly Summary Report, Department of Expenditure. 12 As per the office memorandum released by the Department of Economic Affairs (DEA) on September 4, 2024, the stipulations pertaining to the big releases (₹500 crore or more) will be relaxed until further notice to provide operational flexibility to execute the budget. The newly provided relaxations will remain subjected to the compliance guidelines of single nodal agency (SNA)/central nodal agency (CNA) and of monthly expenditure plan (MEP)/ quarterly expenditure plan (QEP). 14 Information Bulletin, Research and Information Division, Lok Sabha Secretariat, 2016. |
||||||||||||||||||||||||||||||||||||||||||||||||||||||||||||||||||||||||||||||||||||||||||||||||||||||||||||||||||||||||||||||||||||||||||||||||||||||||||||||||||||||||||||||||||||||||||||||||||||||||||||||||||||||||||||||||||||||||||||||||||||||||||||||||||||||||||||||||||||||||||||||||||||||||||||||||||||||||||||||||||||||||||||||||||||||||||||||||||||||||||||||||||||||||||||||||||||||||||||||||||||||||||||||||||||||||||||||||||||||||||||||||||||||||||||||||||||||||||||||||||||||||||||||||||||||||||||||||||||||||||||||||||||||||||||||||||||||||||||||||||||||||||||||||||||||||||||||||||||||||||||||||||||||||||||||||||||||||||||||||||||||||||||||||||||||||||||||||||||||||||||||||||||||||||||||||||||||||||||||||||||||||||||||||||||||||||||||||||||||||||||||||||||||||||||||||||||||||||||||||||||||||||||||||||||||||||||||||||||||||||||||||||||||||||||||||||||||||||||||||||||||||||||||||||||||||||||||||||||||||||||||||||||||||||||||||||

Share this page:


Install the RBI mobile application and get quick access to the latest news!
Scan the QR code to install our app


Page Last Updated on:


