 IST,
IST,
Performance of Private Corporate Business Sector during First Half of 2013-14
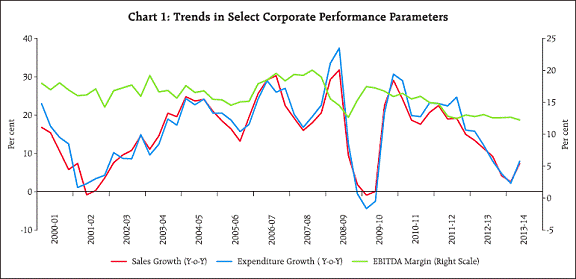
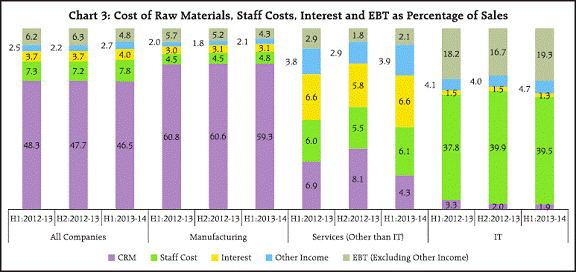
The aggregated sales growth of the private (non-financial) corporate business sector further moderated during H1:2013-14. However, an upturn is noticed during the second quarter of 2013-14 – reversing the trend of six previous quarters. This is primarily due to better performance of the large sized companies, while contraction in sales of small companies continued. The improvement in sales growth is not reflected in the profitability. Earnings Before Interest, Tax, Depreciation and Amortisation (EBITDA) and net profit margins remained low in Q2:2013-14 and dropped significantly during the first half of 2013-14. The article analyses the performance of the private (non-financial) corporate business sector during the first half (April- September) of 2013-14, based on earnings results of 2,731 listed companies. Besides analysing the aggregate performance, it provides a brief analysis by size and major industry groups. It also The article analyses the performance of the private (non-financial) corporate business sector during the first half (April- September) of 2013-14, based on earnings results of 2,731 listed companies. Besides analysing the aggregate performance, it provides a brief analysis by size and major industry groups. It also captures the trend in sales, expenditure and profit margins of the private corporate sector over a longer horizon. Detailed quarterly data has been made available periodically in the website of the Reserve Bank of India (Q2:2013-14 data released on 20th December 2013). 1. Moderation in Sales Growth and contraction in Net Profits at the aggregate level 1.1 Sales growth (Y-o-Y) of 2,731 listed companies of the private corporate sector continued to decelerate during H1:2013-14. This is the lowest growth rate observed in aggregate sales after the crisis period (Table 2). Expenditure on various heads also grew at lower rates during the first half of 2013-14 (Table 1). Cost of raw materials which stood at 48.3 per cent of total sales in H1:2012-13 declined to 46.5 per cent in H1:2013-14 (Chart 3). However staff costs and interest expenses increased as a proportion to sales, lowering further the profit margin. 1.2 EBITDA or operating profits and earnings before interest and tax (EBIT) remained nearly stagnant. Net profits contracted by 14.9 per cent (Y-o-Y) against a growth of 11.9 per cent observed in H2:2012-13. EBITDA and net profit margins recorded a significant drop in H1:2013-14, after remaining around the levels of 13 and 6.4 per cent respectively during 2012-13.
2. Performance of small companies further worsened 2.1 Small companies (annualised sales up to `1 billion) witnessed a persistent contraction in sales in the post crisis period. Sales growth of the medium sized companies (annualised sales between `1 billion to `10 billion) deteriorated between H1:2010-11 and H2: 2012-13 and improved slightly thereafter to 1.1 per cent in H1:2013-14. Large companies (annualised sales above `10 billion) also witnessed sharp moderation in sales growth since 2012-13. In H1:2013-14 a growth of 6.6 per cent was recorded, which is lowest after the crisis (Table 3).
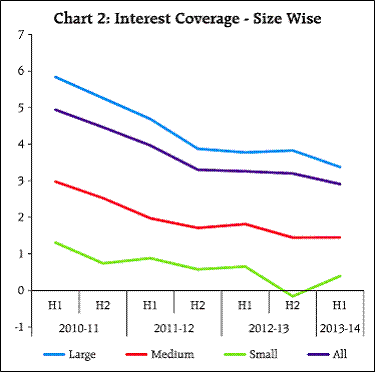
2.2 For the small sized companies, EBITDA has been contracting and net profits remained negative since H2:2010-11. For medium sized companies also, EBITDA and net profits contracted in the recent period. EBITDA growth of the large companies declined significantly during H1:2013-14 and net profits contracted. Profit margins in all size groups remained lower since 2011-12. 2.3 Interest coverage ratio (EBIT/Interest Expenses) continued to decline across size groups. However, the extent of decline slowed down at the aggregate level and for medium and large sized companies (Chart 2). 3. Performance worsened further in the Manufacturing and Services (other than IT) sectors; IT sector improved 3.1 Moderation in the sales growth was most evident in the manufacturing sector, which recorded lower sales growth for four consecutive half years now. The services (other than IT) sector also evidenced lower demand (Table 4). 3.2 EBITDA margin declined continuously since 2010-11 for manufacturing sector. For the services (other than IT) sector, EBITDA margin has remained lower since 2011-12. Net profit margin also declined for these two sectors. 3.3 IT sector continued to perform better among the three sectors with improvement in sales and EBITDA growth and better margins. 3.4 A closer look at the components of expenditure revealed that the share of CRM (cost of raw materials) as a percentage of sales declined in H1:2013-14 for the manufacturing companies across the different size groups (Statement 1). However, the increase in staff cost and interest expenses along with lower other income resulted in lower EBT margin at the aggregate level, while increase in staff cost and other expenses pulled the EBT margin of the manufacturing sector down (Chart 3). In the services (other than IT) sector, increases in shares of staff costs and interest expenses were noticeable (Statement 1). However, as share of other income in sales increased, it resulted in higher EBT margin.
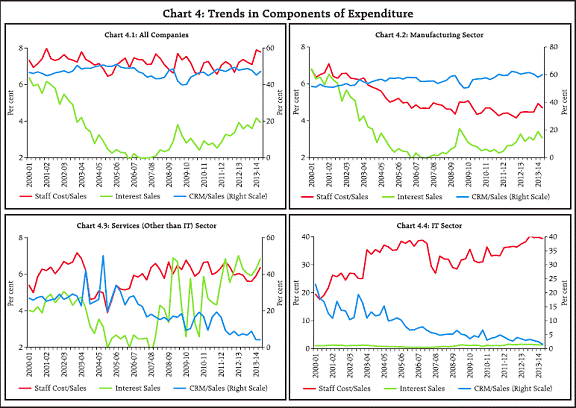
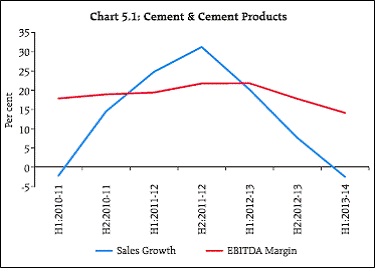
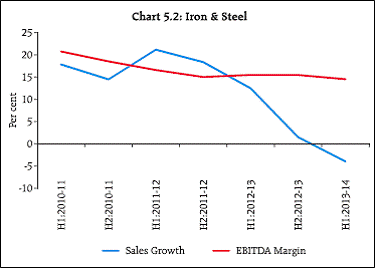
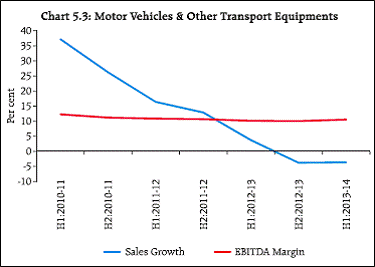
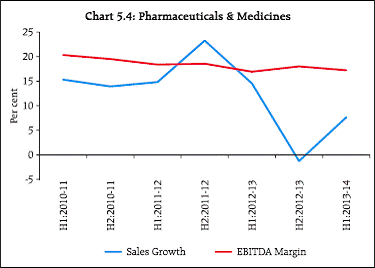
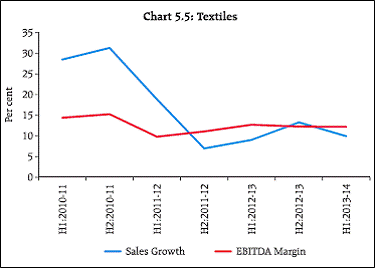
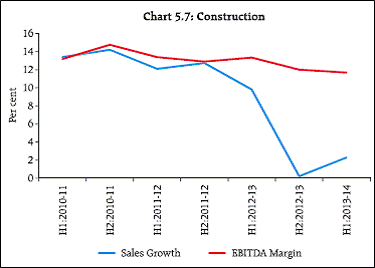
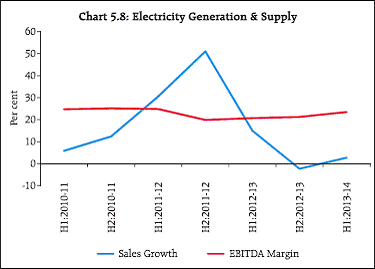
3.5 The long term trend since beginning of the last decade reveals that CRM and staff cost to sales ratio for the private corporate sector has remained fairly stable and range bound (Statement 1, Chart 4). Manufacturing sector showed an increase in CRM to sales ratio in the recent period while staff cost to sales ratio declined from the levels observed in 2000-01. Interest expenses have increased in the recent years. At the aggregate level and also for the manufacturing sector, however, interest to sales ratio has remained below the levels observed in 2000-01. 4. Sales growth was lower in most of the industries 4.1 In the basic goods sector, sales of iron & steel and cement industries contracted during H1:2013-14 (Chart 5.1, 5.2). Sales growth in these industries has been declining since 2011-12 and 2012-13 respectively. EBITDA margin also declined for both the industries. A size - wise analysis indicates a sales contraction in all the size groups with falling EBITDA and net profit margins (Statement 2). 4.2 In the consumer goods sector, motor vehicles industry suffered steady decline in sales growth with contraction since H2:2012-13 (Chart 5.3). For the pharmaceuticals industry, sales growth declined sharply in H2:2012-13 but an upturn was noticed in H1:2013-14. EBITDA margin remained flat during the period (Chart 5.4). Sales growth of the textile industry declined in H1:2013-14, after some recovery during 2012-13. EBITDA margin dropped in H2:2012-13 and remained the same in H1:2013-14 (Chart 5.5). 4.3 In the Capital Goods sector, machinery industry recorded declining sales growth since H1: 2012-13. Profit margin fell sharply in H1:2012-13 and has remained low (Chart 5.6). 4.4 Construction industry showed some improvement in sales growth in H1:2013-14 though profit margin continued to contract (Chart 5.7). Electricity generation and supply industry showed minor improvement in sales growth and EBITDA margins in H1: 2013-14 (Chart 5.8). 5. On a quarterly basis, sales growth improved, profit margin remained low 5.1 An analysis of the performance of NGNF listed companies over the quarter’s reveals that aggregate sales growth (Y-o-Y) improved in Q2:2013-14, after successive deceleration since Q3:2011-12 (Table 5, Chart 1). Y-o-Y growth in interest expenses increased in Q2:2013-14 across all sectors. Interest coverage ratio (EBIT/Interest expenses) was distinctly lower than the levels observed in Q2:2012-13; however, it remained at similar level when compared to the previous quarter. The improvement in sales growth was not reflected in profit margin; and pricing power remained low since Q2:2011-12 with further erosion in Q2:2013-14 (Chart 1). EBITDA margin declined at the aggregate level while net profit margin showed little change.
Annex Explanatory Notes 1. To compute the growth rates in any quarter, a common set of companies for the current and previous period is considered. 2. The classification of industries and sectors broadly follows the National Industrial Classification (NIC). The manufacturing sector consists of industries like Iron & Steel, Cement & Cement products, Machinery & Machine Tools, Motor Vehicles, Rubber, Paper, Food products etc. This does not include ‘Tea Plantations’ and ‘Mining & Quarrying’ industries. The services (other than IT) sector includes Real Estate, Wholesale & Retail Trade, Hotel & Restaurants, Transport, Storage and Communication industries. This does not include Construction and Electricity Generation & Supply Industries. 3. FOREX gain and loss are reported on net basis by companies and included in the net profit calculation. While net FOREX loss is considered as a part of the expenditure and thus included in EBITDA, net FOREX gain is considered as a part of other income and included in EBIT. 4. Other income includes various regular incomes like rents, dividends, royalties etc. and does not include extra-ordinary income/expenses. 5. Extra-ordinary income/expenses are included in EBT and net profit. As the name suggests, these income/ expenses can be very large for some of the companies in a particular quarter. 6. Some companies report interest on net basis. However, some companies include the interest expenses on gross basis, where, interest received is reported in other income. 7. The ratio / growth rate for which denominator is negative or negligible is not calculated, and is indicated as ‘$’.
* Prepared in the Corporate Studies Division of the Department of Statistics and Information Management. The previous study ‘Performance of Private Corporate Business Sector, during first half of 2012-13’ was published in the January 2013 issue of the RBI Bulletin. |
|||||||||||||||||||||||||||||||||||||||||||||||||||||||||||||||||||||||||||||||||||||||||||||||||||||||||||||||||||||||||||||||||||||||||||||||||||||||||||||||||||||||||||||||||||||||||||||||||||||||||||||||||||||||||||||||||||||||||||||||||||||||||||||||||||||||||||||||||||||||||||||||||||||||||||||||||||||||||||||||||||||||||||||||||||||||||||||||||||||||||||||||||||||||||||||||||||||||||||||||||||||||||||||||||||||||||||||||||||||||||||||||||||||||||||||||||||||||||||||||||||||||||||||||||||||||||||||||||||||||||||||||||||||||||||||||||||||||||||||||||||||||||||||||||||||||||||||||||||||||||||||||||||||||||||||||||||||||||||||||||||||||||
Page Last Updated on:


