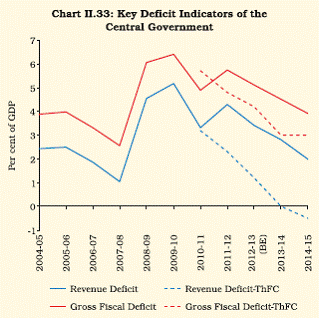
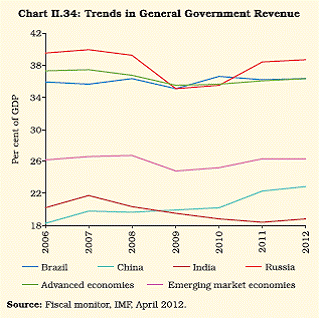
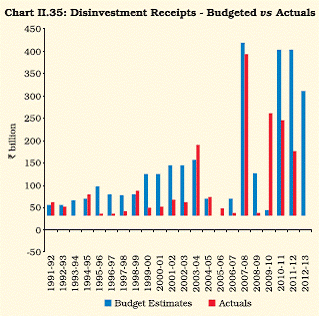
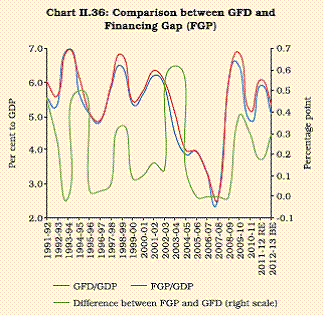
 IST,
IST,
II. Economic Review
For the Year July 1, 2011 to June 30, 2012 PART ONE: THE ECONOMY: REVIEW AND PROSPECTS II - ECONOMIC REVIEW The Indian economy’s performance in 2011-12 was marked by slowing growth, high inflation and widening fiscal and current account gaps. The economy grew at its slowest pace in nine years with mining, manufacturing and construction dragging growth down. Weakening of both domestic and external demand contributed to the slowdown. Importantly, in spite of slowing growth, inflation stayed high for larger part of the year. In response, the Reserve Bank persisted with tightening till October 2011 and paused before easing in April 2012. Slowing growth, high inflation and widening twin deficits, along with global flight to safety amidst a deepening euro area crisis put pressures on the financial markets and the exchange rate during the year. II.1.1 The Indian economy was one of the fastest growing economies in the post-crisis period. During 2011-12, however, there was continuous deceleration of economic activity in each of the four quarters which pushed the expansion of the economy to below potential, which is the maximum level of output that the economy can sustain without creating macroeconomic imbalances. There has been a deceleration in all sub-sectors of the economy, barring ‘electricity, gas and water supply’ and ‘community, social and personal services’. II.1.2 Growth slowed down due to multiple factors. One of the reasons was the persistence of inflation at a much higher level than the threshold for two successive years. Persistent and high inflation necessitated continued tightening of monetary policy. Recent research suggests that real interest (lending) rates explain only about one-third of GDP growth. As of March 2012, real weighted average lending rates, that have an inverse relationship with investment activity, were lower than they were in the pre-crisis period between 2003-04 and 2007-08, when investment boomed. II.1.3 This suggests that non-monetary factors played a bigger role and accentuated the slowdown to beyond what was anticipated while tightening the monetary policy. Recession in the euro area and general uncertainty regarding the global economic climate chipped the external demand as well. Domestic policy uncertainties, governance and corruption issues amidst lack of political consensus on reforms led to a sharp deterioration in investment climate. Structural constraints emerged in key investment drivers in the infrastructure space – telecom, roads and power – which increased the disinflationary costs. High inflation kept aggregate demand and business confidence subdued. II. THE REAL ECONOMY Growth falters in 2011-12 after a sharp recovery in the previous two years II.1.4 After a sharp recovery from the global financial crisis and two successive years of robust growth of 8.4 per cent, GDP growth decelerated sharply to a nine-year low of 6.5 per cent during 2011-12 (Appendix Table 1). The slowdown was reflected in all sectors of the economy but the industrial sector suffered the sharpest deceleration (Appendix Table 2 and Chart II.1 a).
II.1.5 The slowdown in agriculture sector growth was on account of the base effect which dragged down its contribution to GDP growth by half (Chart II.1 b). In the case of industry, the sharp moderation in manufacturing sector growth along with decline in mining and quarrying output offset the improvement in ‘electricity, gas and water supply’ growth. The industrial sector’s weighted percentage contribution to economic growth dropped to single digits, the first time in ten years. The moderation in services sector growth was led by sharp deceleration in ‘construction’ and ‘trade, hotels, transport and communication’. Despite the moderation, the predominance of the services sector remains a unique feature of the overall growth story and the process of structural change in India (Box II.1). Box II.1 Structural transformation of an economy is considered to be both an outcome of as well as a pre-requisite for economic development. The most commonly observed structural change across countries, in line with increases in their real incomes over time, is the decline in the share of agriculture in GDP and corresponding increases in the shares of industry and then in services. The trend in the share of industry has, however, been observed to follow an inverted-U path particularly in developed countries, with a declining share observed in most countries around the middle of the twentieth century, irrespective of their initial conditions. Consequently, in the recent period, the share of the industrial sector in many countries has been found to be close to the level nearly two centuries earlier. The trend in the shares of agriculture and services has generally been monotonic. The factors underlying structural change in economies operate both on the demand and the supply sides. The income elasticity of demand is the highest for services, followed by industrial products and agricultural goods. Hence, progressive increases in GDP typically result in the tapering of demand for agricultural products and increase in the demand for industrial goods and services. On the supply side, agricultural production faces constraints on account of a fixed factor of production (land) and consequently, the law of diminishing marginal returns sets in earlier and results in progressively lower contribution in GDP. In contrast, the greater scope for the use of capital and technology in the industrial and services sectors facilitates increased production in these sectors over time. Structural Change Indices The extent of structural change in economies could be measured using Structural Change Indices (SCIs). One such SCI, the Norm of Absolute Values (NAV), also known as the Michaely Index or Stoikov-Index (Cortuk and Singh, 2010), is: The SCI is bound between zero and 100, with zero representing no structural change and 100 indicating a complete reversal of structure. SCIs are sensitive to three important factors – the level of classification of the sectors (greater the granularity, higher would the index), the time period of the analysis (since the SCI compares sectoral shares at two time points), the price measure of output (current prices capture both price and volume changes over time). Cross-country Perspective In order to measure the changing structural dynamics, the SCI is estimated for selected advanced and emerging market/ developing countries for the period 1990 to 2009 using annual GDP data (Table 1).
No clear pattern between SCI and level of development across countries is evident from Table 1. The extent of structural change in India over the period is similar to that in developed countries such as Australia, Japan and the UK, and to some extent, Korea. Countries such as Brazil, China and Sri Lanka had higher SCIs than India. Structural change in Russia was clearly substantially higher than that in any of the other economies. Using the Central Statistics Office (CSO) data and the same methodology, the extent of structural change in India was found to be not very different in the pre-reform (1968-71 to 1987-90) and post-reform (1990-92 to 2009-11) periods. The SCIs were 13.6 and 13.2, respectively. References: Cortuk, O. and Nirvikar Singh (2011), “Structural Change and Growth in India”, Economics Letters, March. Kuznets, S. (1971), “Economic Growth of Nations: Total Output and Production Structure”, Cambridge, Harvard University Press. Papola, T.S. (2005), “Emerging Structure of Indian Economy: Implications of Growing Inter-sectoral Imbalances”, Presidential Address, 88th Conference of the Indian Economic Association, December. Productivity Commission (1998), “Aspects of Structural Change in Australia”, Research Report, Government of Australia. Investment downturn accentuates demand slowdown1 II.1.6 There was a sharp moderation in the growth rate of GDP at market prices from 9.6 per cent in 2010-11 to 6.9 per cent in 2011-12 on account of all-round deceleration in demand – consumption (both private and government), investment and external (net exports) (Chart II.2a). II.1.7 Expenditure-side GDP data for Q4 of 2011- 12 suggests that growth was 5.6 per cent and investment improved sequentially. The expenditureside GDP data, however, have well known limitations that are also evident from the large and volatile pattern of discrepancies in the data. The contribution of ‘statistical discrepancy’ (i.e., the difference between the estimates of GDP from the supply side and the sum of the estimates of the components of the expenditure side, adjusted for net indirect taxes) to the overall growth sharply increased to around 42 per cent in 2011-12 and exceeded the contribution of gross fixed capital formation (Chart II.2b). II.1.8 The large and volatile discrepancies in the expenditure side GDP data co-exist with unreliable data on various components of aggregate demand. For instance, there is an incorrect representation of external demand as Q4 data estimates net exports as a positive figure. This is in contrast to the record current account deficit (CAD) posted during the quarter, as per data released by the Reserve Bank. Also, sufficient supplementary evidence exists to suggest that investment has slowed down. Information collected from phasing details of corporate projects sanctioned financial assistance suggests that corporate fixed planned investment dropped sharply in H2 of 2010-11 and declined further in 2011-12. Anecdotal evidence supplements this view.
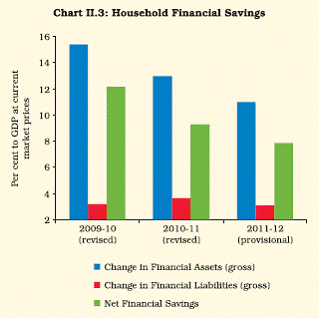
II.1.9 Capital goods production also contracted sharply, though this was partly on account of substitution by imported capital goods. Hence, investment decelerated faster than other components of domestic demand. Global uncertainties further worsened the investment climate and also slowed down growth through the net export channel. Falling saving and investment rates may impact potential growth II.1.10 There has been a decline in the average saving rate since 2008-09, led by a sharp decline in public sector saving rate that has not been offset by private savings (Appendix Table 3 and Table II.1). The reduction in the average public sector savings rate in the post-global crisis period largely reflects the impact of fiscal stimulus measures as well as the decline in the contribution of non-departmental enterprises. Average investment rate has also declined in the post-crisis period. II.1.11 Preliminary estimates show that the net financial saving of the household sector declined further to 7.8 per cent of GDP at current market prices in 2011-12 from 9.3 per cent in the previous year and 12.2 per cent in 2009-10 (Chart II.3 and Appendix Table 4). The moderation in the net financial saving rate of the household sector during the year mainly reflected an absolute decline in small savings and slower growth in households’ holdings of bank deposits, currency as well as life funds. At the same time, the persistence of inflation at a high average rate of about 9 per cent during 2011-12 further atrophied financial saving, as households attempted to stave off the downward pressure on their real consumption/lifestyle.
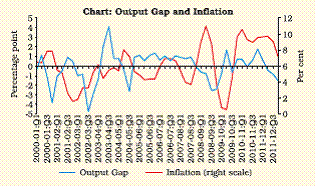
II.1.12 Furthermore, with real interest rates on bank deposits and instruments such as small savings remaining relatively low on account of the persistent high inflation, and the stock market adversely impacted by global developments, households seemed to have favoured investment in valuables, such as gold. In the post-global crisis period, valuables have increased from 1.3 per cent of GDP at current market prices in 2008-09 to 2.8 per cent in 2011-12; the share of valuables in investment (gross capital formation) has also increased from 3.7 per cent to 7.9 per cent, over this period. The apparent proclivity of households towards investment in valuables such as gold could have also impacted the pace of their investment in physical assets such as housing in 2011-12. II.1.13 The trend of falling savings rate, particularly that of public sector savings, needs to be reversed for adequate resources to be available to support a high growth trajectory during the Twelfth Plan. II.1.14 The rate of gross fixed capital formation (investment) has declined persistently from a peak of 32.9 per cent in 2007-08 to 30.4 per cent in 2010-11. The slackening of overall fixed investment was largely reflected in the private corporate sector as a result of both monetary and non-monetary factors. Sluggish growth rate of capital raised through initial public offerings (IPOs) during 2011-12 further impacted investment. The correlation between IPOs as a ratio to GDP and the fixed investment rate between 2000-01 and 2011-12 was 0.71. II.1.15 Persistent decline in investment rates tend to adversely impact potential output. There has been a decline in potential output over the previous two years as a result of structural impediments and high inflation. On current assessment the potential output growth is around 7.5 per cent and the actual output growth is lower, resulting in a negative output gap. Going by the positive yet lagged relationship between output gap and inflation, the positive output gap during 2009-10 and 2010-11 cast some downward stickiness to the inflation rate (Box II.2). Agricultural growth moderates on high base II.1.16 Agricultural sector grew around trend level during 2011-12 on top of a good performance in 2010-11 (Appendix Table 5). The south-west monsoon in 2011 was normal, but the north-east monsoon was deficient by 48 per cent. Nevertheless, the trend level growth in agriculture was maintained. As per the Fourth Advance Estimates for 2011-12, production of foodgrains in general and rice and wheat in particular, is estimated to be the highest ever. II.1.17 In 2012-13, however, the south-west monsoon is likely to be deficient with cumulative rainfall (up to August 16, 2012) for the country as a whole being 16 per cent below the LPA. The deficiency as measured by the Reserve Bank’s production-weighted rainfall (PRN) index is even higher at 21 per cent. The deficiency is highest for north-west India with the rainfall being 25 per cent below LPA with scanty rainfall in Punjab and Haryana. Overall, 47 per cent of the geographical area of the country, including Gujarat, west Rajasthan, parts of Maharashtra and Karnataka received scanty/deficient rainfall. Box II.2 The output gap is defined as the gap between the actual and the potential output, where potential output is the maximum possible level of output that is consistent with a stable and low rate of inflation. In a traditional Phillips curve framework, a positive (negative) output gap, signifying excess aggregate demand (supply), results in an increase (decline) in the inflation rate. The impact of the output gap on inflation could be instantaneous or could occur with a lag. Several other factors could, of course, impact inflation such as lagged inflation, the exchange rate and the indirect tax rate. Apart from the level, a change in the output gap – termed as the ‘speed limit’ effect – could also impact inflation. This reflects the emergence of temporary supply bottlenecks when the pace of increase in demand outstrips the build-up of new capacity, even though the level of the output gap may still be negative. Empirical studies have found evidence of asymmetries/non-linearities in the relationship between output gap/growth and inflation for India (Mohanty et al, 2011). Against this backdrop, the trends in output gap (with the potential output based on the H-P filter) and WPI inflation in India over the period 2000-01:Q1 to 2011-12:Q4 were studied (Chart). It was found that the output gap Granger caused WPI inflation at one lag, corroborating the leading indicator properties of the output gap. Simple linear regressions of the WPI inflation rate on its own lags, output gap and a dummy variable (for period-specific outliers) for the period 2000-01:Q1 to 2011-12:Q4 yield statistically significant coefficients (Table). Inflation up to two lags is significant. While the positive sign of the first lag of inflation reflects inflation persistence say, through inflationary expectations or actual price rigidities, the negative sign of the second lag of inflation possibly shows that the inflation series is mean-reverting or stationary. Output gap is positive and significant at the first and third lags. In effect, a one percentage point increase in the output gap resulted in 0.2 and 0.3 percentage point increase in the WPI inflation rate after one and three quarters, respectively. The simple linear formulation did not detect any speed limit effects.
Normalised impulse response functions of a bi-variate VAR model consisting of output gap and the WPI inflation rate (alternatively, headline and core) show that a one standard deviation shock to output gap results in an increase in both headline and core inflation, which reaches a maximum after three quarters and the impact wears off after 6-8 quarters or around 2 years. Given that growth has slowed down significantly in the recent period, these results thus indicate that inflation, especially core, could moderate with a lag. However, the pace and extent of moderation could be conditional on other determinants of inflation such as supply shocks from food, global commodity price movements and exchange rate pass-through as well as the overall fiscal position. Currently most of these pressures persist, which partly explains the stickiness in inflation despite growth slowing down. References: Baghli, M., Christophe Cahn and Henri Fraisse (2006), “Is the Inflation-Output Nexus Asymmetric in the Euro Area?” Banque de France Working Paper No.140, April. Dwyer, A, Katherine Lam and Andrew Gurney (2010), “Inflation and the Output Gap in the UK”, Treasury Economic Working Paper No.6, March Meier, A. (2010), “Still Minding the Gaps – Inflation Dynamics during Episodes of Persistently Large Output Gaps”, IMF Working Paper WP/10/189, August. Mohanty, D., A.B. Chakraborty, Abhiman Das and Joice John (2011), “Inflation Threshold in India: An Empirical Investigation”, Reserve Bank of India Working Papers, October. II.1.18 This has affected the kharif sowing in 2012- 13. The sown area as of August 17, 2012 is greater than the normal for this period of the year for rice and non-foodgrains such as sugarcane, cotton and jute and mesta. The total deviation from normal is 4 per cent for foodgrains led by decline in sown area in relation to the normal of 16 per cent and 12 per cent for coarse cereals and pulses, respectively. Notwithstanding some improvement in monsoon in August 2012, the gap in area sown for coarse cereals and pulses is likely to persist. While this could have an adverse effect on agricultural output in 2012-13, the situation during the year so far (up to August 16, 2012) seems better than what was seen in the comparable period of the drought year of 2009-10 (Chart II.4). II.1.19 The India Meteorological Department (IMD) has pegged the probability of El Nino conditions emerging in the later part of the season at 65 per cent. Deficient rainfall has also affected the level of water in the 84 reservoirs under the Central Water Commission (CWC). If September rains are not good, it would impact the soil moisture and reservoir levels and thus put the rabi output also at risk. II.1.20 Even as the dependence of Indian agriculture on rainfall has reduced over the years, it remains predominantly rain-fed. About 16 per cent of the country’s geographical area is drought prone. This is mostly in the arid, semi-arid and sub-humid areas. Rain-fed agriculture accounts for around 56 per cent of the total cropped area, with 77 per cent of pulses, 66 per cent of oilseeds and 45 per cent of cereals grown under rain-fed conditions. The dependence of agriculture on rainfall is manifested by decline in kharif output in 2008-09 and 2009-10, when the south-west monsoon was acutely deficient. Deficient north-east monsoons in the recent past adversely affected the production of rabi crops such as oilseeds, pulses and rice. On the contrary, during 2010-11, when both summer and winter rainfalls were above normal, production of most kharif and rabi crops increased significantly. II.1.21 The government has prepared contingency plans which entails ensuring sufficient availability of all seeds, fodder, power and diesel, additional wage allocation under Mahatma Gandhi National Rural Employment Guarantee Act (MGNREGA) and sufficient funds under the National Disaster Relief Fund. An inter-Ministerial Group has been constituted to review the situation on a weekly basis. Contingency plans such as production of fodder, short duration pulses and conservation of moisture for early planting of rabi crops such as toria, sorghum and gram are being implemented. Food security challenges would require further policy/ operational changes II.1.22 Foodgrain stocks in India are currently at very high levels (76.2 million tonnes in July 2012), thus providing some insulation from weather shock in the current year (Appendix Table 6). However, availability of pulses, groundnut and coarse cereals may be constrained. Extremely dry and hot weather conditions during May-June 2012 in countries such as the US, China, and Russia affected crop conditions. Therefore, domestic shortages may not be readily covered by imports.
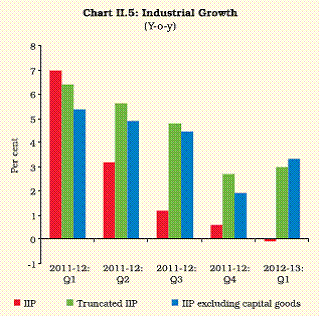
II.1.23 In spite of the record level of foodgrain stocks, food security concern persists. The food security issues in respect of foodgrains persist more in terms of likely increased entitlements (under the proposed National Food Security Bill 2011) and lack of storage capacity. However, given the changing food habits a greater emphasis is necessary to augment supply of protein-rich items, vegetable and fruits, where demand-supply gaps are putting a pressure on prices. II.1.24 In recent years, per capita availability of food items such as foodgrains and pulses has shown a declining trend. Compared with the 1990s, production of foodgrains and horticultural crops grew at a slower pace during the 2000s despite increasing diversification of the consumption basket. Rising expenditure on high value foods, namely, fruits, vegetables, milk, eggs, meat and fish has reduced the dominance of cereals in the consumption basket, as confirmed by the consumer expenditure survey of 2009-10 conducted by the National Sample Survey Office (NSSO). Increase in income will lead to further increase in demand for these food items, which will eventually have a bearing on the overall food and nutrition security preparedness of the country. Raising the growth rate of agricultural production, including foodgrains, to levels above the growth rate of population, therefore, is crucial for long-term food security. The country has large import dependence for items such as pulses and oilseeds. According to the working group for the 12th Five Year Plan (2012-17) constituted by the Planning Commission, demand for pulses and oilseeds could exceed the domestic supply by 1-4 million tonnes and 18-26 million tonnes, respectively, by 2016-17. II.1.25 Further, the distribution and delivery mechanism under the existing Targeted Public Distribution System (TPDS) suffers from inefficiency and leakages. The existing storage facilities are already stretched to their limits, often leading to wastage. Thus, scaling up the coverage and entitlement under TPDS would require an overhaul in the entire chain of food management systems. Measures such as augmenting storage capacity and reducing leakages apart from exploring the possibilities of introducing cash transfer, food coupon systems and digitalisation of TPDS are expected to help solve the problems facing the sector to a large extent. Technological breakthrough, investments in protein – key to higher agriculture growth II.1.26 Technology breakthroughs, especially in dry land farming as also investment for augmenting supply of vegetables, fruits, eggs, fish, meat and milk are key to addressing the supply constraints in agriculture which is necessary to tame inflation. As per the approach paper for the 12th Five Year Plan, achieving at least 4 per cent agricultural growth in the coming years is crucial not only for sustaining overall growth of the economy but also for a more equitable growth. This would require a quantum increase in productivity from the current levels. This, in turn, requires technological breakthrough given the limited supply of land, water and other structural constraints such as low level of mechanisation, shortage of irrigation facilities and power, and inefficient communication and extension services. II.1.27 Frontier technologies such as biotechnology, information and communication technology (ICT), renewable energy technologies, space applications and nanotechnology; and organic farming along with Low External Input Sustainable Agriculture (LEISA) techniques, if promoted with Integrated Natural Resource Management (INRM) and Integrated Pest Management (IPM) techniques, can help improve productivity in a sustainable manner without ecological distress. Technology can also help ensure sustainability of natural resources, enhance efficiency of public investment, and diversify agriculture towards higher value crops and livestock. II.1.28 Success in bridging productivity gap in terms of yield vis-à-vis world average and the gap within states/regions in the country can contribute significantly to higher production. An effort in this direction which has yielded favourable result is the assigning of mission mode status to the objective of extending Green Revolution to the eastern region. During 2011-12, West Bengal, Bihar and Jharkhand registered significant increase in yield, production and cultivated area under rice with West Bengal emerging as the highest producer of rice in the country. Initiatives with respect to pulses and oilseeds are also yielding favourable results. II.1.29 Improving protein supplies requires spread of appropriate technologies and larger investments in poultry, fisheries and dairy farming. Though there has been rapid growth in poultry output, demand has grown faster. There is, therefore, a need for encouraging rearing of hybrid birds and poultrylayer farming, investment in improved feed conversion, poultry vaccines and medicines, veterinary services as also poultry equipment. Specific pathogen free egg production needs to be stepped up. Higher investment is also needed in fisheries covering deep sea, coastal and inland fisheries such as aquaculture in ponds, tanks and reservoirs. Private investment should be enabled in tuna processing and fish drying centres through public policy support. Industrial growth moderates amidst deteriorating investment climate, softer demand II.1.30 Industrial growth, as measured by the index of industrial production (IIP), decelerated to 2.9 per cent during 2011-12 from 8.2 per cent in the previous year (Appendix Table 7). While the IIP maintained a moderate growth of 5.1 per cent during the first half of 2011-12, growth took a plunge in the second half to 0.9 per cent. The slowdown was on account of moderation in demand, both domestic and external, hardening of interest rates, slowdown in consumption expenditure, especially in interest-rate sensitive commodities, subdued business confidence and global economic uncertainty. II.1.31 The slowdown in industrial growth was exacerbated by the volatility in the production of capital goods. Truncated IIP, constructed by the Reserve Bank by excluding item groups (out of 399) which fall in the top 2 per cent growing and bottom 2 per cent declining blocks and has a weight of 96.0 per cent in total IIP, grew 4.8 per cent in 2011-12 showing a better performance than the overall IIP. Nevertheless, a significant moderation in growth is evident even for truncated IIP in successive quarters of 2011-12 (Chart II.5). In Q1 of 2012-13, IIP declined by 0.1 per cent mainly due to a 20 per cent decline in output of capital goods. Growth in truncated IIP and IIP excluding capital goods was better than in Q4 of 2011-12. II.1.32 The slowdown in industrial production was reflected across all sub-sectors in 2011-12, except electricity. In the manufacturing sub-sector, while 6 industry groups showed a decline in production, 6 registered growth in excess of 10.0 per cent. The mining sub-sector declined by 2.0 per cent during 2011-12. This was mainly due to regulatory and environmental issues affecting coal mining and low output of natural gas from the Krishna-Godavari basin. However, electricity sector performed better during 2011-12 recording 8.2 per cent growth supported by higher hydro power generation aided by a normal south-west monsoon (Chart II.6 a).
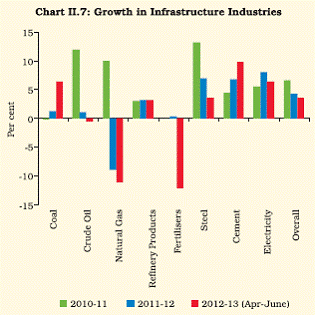
II.1.33 Capital and intermediate goods growth declined during the year reflecting dampening of investment climate. In general, the import-intensity of domestic capital goods is high, and empirical tests confirm the integral link of imports as inputs to capital goods production. In 2011-12, however, even as production of capital goods declined, imports remained high. This could be indicative of gradual loss of comparative advantage in production of capital goods. The growth of consumer durables decelerated sharply due to interest rate sensitivity (Chart II.6 b). Basic goods2 made the highest contribution to industrial growth at 75 per cent during 2011-12. Global factors impinge on domestic industrial growth II.1.34 As noted earlier, the slowdown in overall growth of the economy during 2011-12 is mainly attributable to weak industrial performance. This, in turn, can be ascribed to both international and domestic factors. The current slowdown, that started in early 2010-11 coincided with the fragile economic conditions in the US and European countries. As during 2008-09, global factors are a part of the reason for the industrial slowdown. These include the financial crisis in the euro zone, sluggish growth in other industrialised countries and elevated crude oil prices. Among emerging market economies, countries such as Malaysia, South Korea and Brazil also witnessed weak industrial performance during the period. II.1.35 An empirical assessment of the impact of monetary policy and global growth on industrial output suggests that a percentage point increase in real weighted average lending rate for industry in the base period results in a decline in IIP growth, on an average, by 0.6 percentage point over a one year horizon. On the other hand, a one percentage point increase in global GDP growth in the base period stimulates domestic IIP growth, on an average, by about 0.7 percentage point over the same horizon. These estimates indicate that both monetary policy actions and global growth dynamics affect the growth of domestic industry. Removing bottlenecks facing core industries crucial to reviving industrial growth II.1.36 Structural bottlenecks in critical sectors such as coal and natural gas affected the overall performance of industrial sector during 2011-12. Contraction in natural gas output and slowdown in coal, fertiliser and crude oil output led to deceleration in growth of core industries to 4.4 per cent during 2011-12 compared with 6.6 per cent in the previous year (Chart II.7). There was contraction in fertilisers, natural gas and crude oil and deceleration in steel, refinery products and electricity during April-June 2012.
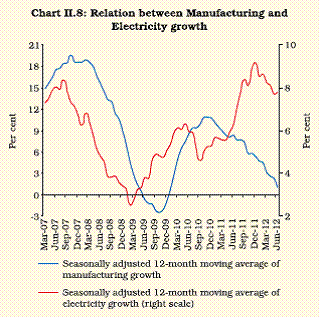
II.1.37 Manufacturing growth depends crucially on the inputs provided by core industries, especially, electricity which has a weight of 10.3 per cent in the IIP. An empirical assessment of the dependence of manufacturing growth, inter alia, on electricity availability indicates that a one percentage point increase in annual growth in electricity increases the growth rate of manufacturing by 0.4 percentage point. This has been reflected in the co-movement of growth rates of manufacturing and electricity indices (Chart II.8). However, there was a divergence between the two since June 2010 because even as there was significant deceleration in the growth of manufacturing sector, the growth in electricity continued to remain buoyant due to the substitution of petroleum products, especially diesel, with electricity in other sectors of the economy. This was reflected in the deceleration in the growth of diesel consumption. The increased electricity generation also partly helped in reducing the power deficit in the country from 10.1 per cent in 2009-10 to 8.5 per cent in 2011-12 in spite of increased demand from household segment.
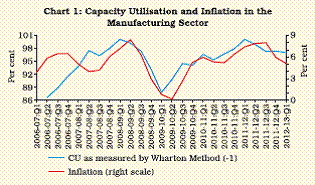
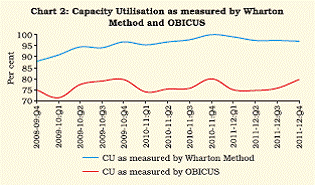
II.1.38 The gap between domestic demand and supply of core industrial inputs has widened in recent years. For coal, the gap has increased from around 50 million tonnes in 2007-08 to 114 million tonnes in 2011-12. The projected gap by the terminal year of the 12th Five Year Plan (2016-17) is expected to be 185 million tonnes. The policy of captive mining, which was introduced to augment production, has not helped the sector to the desired extent. However, measures taken by the government recently to ensure adequate coal supply to power plants has helped improve coal output with average growth during November-March 2011-12 rising to 8.5 per cent as against (-) 5.6 per cent during April- October 2011-12. The coal sector grew by 6.4 per cent in April-June 2012. Measures such as import of coal and acquisition of coal assets abroad are expected to help reduce the demand-supply gap. It is important to ensure smooth shipments, port handling and transportation of the coal imports to quickly bridge any supply shortages for the power plants. II.1.39 The government has initiated several steps to augment the production of core sector in the recent period. Augmenting resources for exploration and mining through private sector participation has yielded favourable results. The union budget for 2012-13 gave full exemption from basic customs duty to fuels such as natural gas, liquefied natural gas, steam coal and uranium concentrate imported for power generation. To facilitate the development of necessary infrastructure, viability gap funding has been extended to capital investment in fertiliser industry, oil and gas storage and pipeline facilities for supporting the scheme of public private partnership (PPP). II.1.40 The industrial sector, in particular, manufacturing, is an important driver of growth and source of employment. Though there is no official estimate of capacity utilisation for the sector, given the modest share of the sector in GDP, it is likely that if enabling business environment and the required infrastructure are provided, capacity utilisation in the sector can be improved significantly (Box II.3). Box II.3 Capacity utilisation (CU), if properly assessed, could provide a reliable indication of incipient inflationary pressure in an economy. A realistic assessment of CU encapsulates the demand pressure in an economy such that if market demand grows, CU tends to rise, and if demand weakens, CU tends to slacken. Therefore, higher CU is associated with higher inflation. Concept and Measurement CU can be defined as the percentage of total productive potential that is actually being utilised in a given period. CU serves as an important indicator, reflecting the business cycles as well as policy changes. Measures of CU are extensively relied upon to help explain the changes in the rate of investment, labour productivity and inflation. There is no unique method for measurement of CU. CU can be measured for an economy, industry or firm through survey methods or use of production data. One important method of measuring CU is the Wharton Method wherein capacity is defined as the peak output achieved in each business cycle. An implicit assumption of this method is that all short run peaks in output represent 100 per cent CU. An alternative method of tracking CU is through economic surveys of operating metrics. However, the surveys generally offer a subjective measure as they do not specify any explicit definition of capacity. An alternative method of measuring CU is the production frontier approach where the maximum possible output (i.e., capacity output) for given input levels is estimated. Measurement of CU in India: Current Practices In India, there is no single official estimate of CU. At present, the Central Statistics Office in its monthly ‘Capsule Report on Infrastructure Sector Performance’ provides some estimates of CU in the core industries. The Reserve Bank in its quarterly ‘Order Books, Inventories and Capacity Utilisation Survey’ (OBICUS) provides estimates of the level of CU in the Indian manufacturing sector. The level of CU is derived from the data provided by companies as per the selected methodology. The survey is canvassed among 2,500 public and private limited companies in the manufacturing sector with a good size/ industry representation. Trend analysis is done to study the movements in CU based on a common set of companies in each round to facilitate better comparability of data over the reference quarters. The results of the 17th round of the survey, done for Q4 of 2011-12, were disseminated to the public in July 2012. The Federation of Indian Chambers of Commerce and Industry in its quarterly ‘Business Confidence Survey’ and ‘Survey on Indian Manufacturing Sector’ provides assessment of CU in the industrial sector. The National Council of Applied Economic Research in its quarterly ‘Business Expectation Survey’ also provides information on CU in Indian industries. Thus, most of the estimates of CU in the Indian context are based on survey methods. This is in line with the practice followed by other countries as well. However, an attempt has been made to measure CU in Indian industry using the Wharton Method. The Wharton Method offers certain advantages over the other traditional time series methods due to its success in tracking demand pressures in the economy. High CU rates are indicative of higher demand pressure in an economy, and consequently higher inflation rates. The CU rate in the Indian manufacturing sector measured by Wharton School method has generally acted as a lead indicator of inflationary pressure, which is consistent with the theoretical expectation. Inflation in manufactured products has a significant positive correlation of 0.54 with one period lagged value of CU (Chart 1). Also, the broad trend in CU as estimated by the Wharton method and OBICUS is the same (Chart 2).
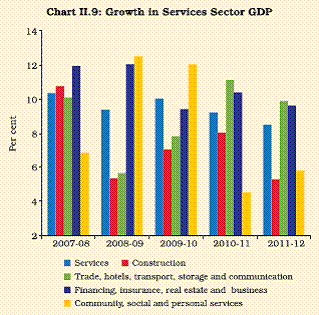
In practice, survey methods are preferred over time series methods for estimating CU as the latter suffers from a number of limitations. These include differing estimates obtained from alternative methods, assumptions implying that the entire capital stock available to the industrial sector has been used with highest allocative efficiency (which is generally not the case), the selection of peak output over a relatively short time horizon of one year, the end point specification problem and difficulties in specifying the exact form of the production function for each firm. Major disadvantage of the time series method arises from the revision of the base year as also the variability of provisional data. For example, with the change in base year of IIP to 2004-05 from 1993-94, the growth in IIP has changed by as much as +/- 11 per cent in the new series. Thus, any method used to estimate CU should be based on the exploration of competing methods emphasising on conceptual suitability of alternative measures of capacity/ potential output, assessment of existing data gaps, and interpretation and usage of different measures. References Mukherjee, A. and Rekha Misra (2012), “Estimation of Capacity Utilisation in Indian Industries: Issues and Challenges”, Reserve Bank of India Working Papers, May Donde, K. and Mridul Saggar (1999), “Potential Output and Output Gap: A Review”, Reserve Bank of India Occasional Papers, Vol. 20, No. 3, Winter. II.1.41 In countries such as China and some East Asian economies, the share of manufacturing sector in GDP ranges between 30-40 per cent. In India, the share of manufacturing, has been around 14-16 per cent during the post-reform period. In this regard, the National Manufacturing Policy, which aims to increase the share of manufacturing sector to 25 per cent of GDP by enhancing value addition and improving competitiveness along with the creation of 100 million jobs in the sector by 2022 is expected to provide a major impetus to the manufacturing sector. Some moderation evident in services sector growth II.1.42 Much of India’s growth performance in the recent years has been contributed by the services sector which showed considerable resilience during the global economic crisis. However, some deceleration is apparent in services sector recently with growth slowing down to 8.5 per cent during 2011-12 compared to 9.2 per cent in the previous year (Chart II.9). The slowdown was mainly on account of deceleration in construction which grew by 5.3 per cent compared with 8.0 per cent in the previous year. The deceleration in services sector is on account of both weakening demand as well as inter-linkages with the industrial sector.
II.1.43 Construction activity slowed down as housing inventories rose with price rigidities observed in the industry to protect high profit margins. With record road tendering in 2011-12, construction activity could receive support in the coming years. However, newer constraints for road projects have emerged lately, reflected in sharp drop in tendering during Q1 of 2012-13 (Chart II.10). II.1.44 In 2001-12, ‘trade, hotels, transport and communication’ also slowed given its strong linkage with industrial activity. Slowdown in transportation is also mirrored in deceleration in production of commercial motor vehicles. Telecom industry slowed down along with moderation in the number of new cell phone connections, reflecting in part imposition of regulatory penalties and in part plateauing of penetration levels after a period of extra-ordinary growth. II.1.45 The outlook for the services sector depends to a large extent on the revival of industrial growth given the dependence of sub-sectors such as trade and transport on industrial production. Prospects of the sector also depend on the developments in the global economic situation (Box II.4). Continued fragility in economic conditions in the advanced economies may have adverse impact on Indian services exports. Structural shift in employment evident in recent years II.1.46 In general, as economies grow there is a shift in employment pattern away from agriculture into manufacturing and then into service sector. In India, the pace of transformation in the structure of employment has been slow. Agriculture employed 53.2 per cent of the total work force in 2009-10, while contributing around 14.7 per cent of GDP. On the other hand, industry and services sector contributed 20.2 per cent and 65.1 per cent, respectively of GDP while employing only 11.9 per cent and 35.0 per cent, respectively, of the work force. II.1.47 In recent years, there has been a shift in employment away from agriculture and manufacturing in favour of construction, transport and communication (Chart II.11). Employment in the construction sector increased by 62 per cent between 2004-05 and 2009-10, accounting for most of the employment generated during the period. As regards the nature of employment, casual labour accounted for most of the increase in overall employment during this period, suggesting that the employment generated may not be permanent. II.1.48 During the period 2004-05 to 2009-10, decline in employment is observed with respect to youth and women. Employment among young males in the age group of 15-19 years declined by 12 per cent during this period. This was mainly due to increased enrolment rate in educational institutions. Males in the 15-19 age-group who reported attending educational institutions as their primary activity increased from 51 per cent in 2004-05 to 63 per cent during 2009-10. As regards women, there was a withdrawal from the labour force reflected in the decline in the work participation rate (WPR) among women across all age groups. As a consequence, the proportion of women engaged in domestic duties increased from 31.6 per cent in 2004-05 to 37.8 per cent in 2009-10.
Box II.4 India’s growth since the late 1980s has been driven by services sector. The growth rates of almost all components of the services sector picked up during the late 1980s and increased significantly during 2005-08 (Table). Within services sector, the expansion has been particularly strong for communication and banking and insurance. The growth rates of most of the sub-sectors, notably ‘communications’ continued to remain high even after the onset of the global financial crisis, reflecting the resilience of the services sector. The composition of the services sector shows that while ‘trade’ continues to remain the predominant sub-sector with a share of around 24 per cent, the shares of both ‘banking and insurance’ and ‘communications’ have registered sharp increases over the years. The shares of ‘real estate, ownership of dwellings and business services’ that includes IT services and ‘construction’ have also remained high even though these have declined somewhat in the post-crisis period. Services sector growth benefitted not only from liberalisation after the initiation of structural reforms and the sharp increase in per capita incomes but also from the inherent linkages with the industrial sector. The trade, telecommunications, banking and business services (including IT services) sectors have particularly gained in this regard. The fairly robust growth of the construction and real estate sectors is reflective of rapid urbanisation. In order to distill the impact of different factors, a linear regression of services sector growth was run based on annual data for the period 1980-81 to 2010-11. Dummy variables were incorporated to take cognisance of the initiation of structural reforms in 1991-92 (DREF), apart from a few outliers (DYRS). The explanatory variables were the call rate (CR) {as a monetary policy stance indicator}, WPI inflation (INF), industrial sector growth (IND) and world GDP growth (WG). The results of the estimation are set out below: SER = 7.23 – 0.20 CR(-1) – 0.18 INF + 0.12 IND + 0.41
WG(-1) + 1.93 DREF + 2.29 DYRS
All the coefficients are statistically significant at 1 per cent, except IND which is significant at 5 per cent. The coefficients also have expected signs. The results show that a one percentage point increase in the call rate reduces services sector growth by around 0.2 percentage point one period ahead, largely reflecting the impact of an increase in the cost of funds. The impact of a percentage point increase in the inflation rate on services sector growth is nearly similar, though contemporaneous. Robust industrial sector growth provides support to the services sector. On the other hand, lagged world GDP growth is an important factor for services sector growth with coefficient of 0.41. References: Banga, R. and Bishwanath Goldar (2004), “Contribution of Services to Output Growth and Productivity in Indian Manufacturing: Pre and Post Reforms” ICRIER Working Paper, No.139, July. Eichengreen, B. and Poonam Gupta (2011), “The Service Sector as India’s Road to Economic Growth”, NBER Working Paper, No. 16757, February. Gordon, J. and Poonam Gupta (2004), “Understanding India’s Services Revolution” IMF Working Paper, WP/04/171, September. Kaur, G., Sanjob Bordoloi and Raj Rajesh (2009), “An Empirical Investigation of the Inter-Sectoral Linkages in India”, Reserve Bank of India Occasional Paper, Vol. 30, No. 1, Summer.
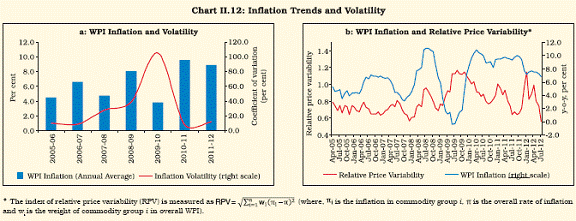
II.1.49 Along with the lower growth in employment, increase in real wages has also been significant in the recent period. Reduction in WPR has resulted in labour market tightening which could have partly contributed to rising real wages. Also, the introduction of the MGNREGA which resulted in eight-fold increase in public works since 2004-05 along with increase in higher minimum wage for public works could also have contributed to rising real wages. However, the public works accounted for less than 2 per cent of total person-days of rural employment in 2009-10. Moreover, increase in wages for public works has been lower than increase in wages for casual laboureres engaged in non-public sector works as well as regular/salaried employees. II.1.50 Overall, the sharp deceleration in growth in 2011-12 was on account of both cyclical and structural factors. After a firm recovery in 2010-11, a cyclical downturn set in, induced by global factors and high inflation. The slowdown was exacerbated by the structural rigidities in the economy. As these structural rigidities are yet to be addressed, growth may stay low in the near term. The constraints are particularly severe in the infrastructure, mining and metal space. Investment demand could revive gradually once these are addressed. II.2 PRICE SITUATION Inflation remained high for the second year in a row II.2.1 The high inflation phase that started in the last quarter of 2009-10 persisted and became generalised over two consecutive years. Inflation remained elevated at over 9 per cent in the first eight months of 2011-12, before softening moderately in December. It has since remained sticky in the range of 6.9-7.7 per cent. Non-food manufactured products inflation remained over 5 per cent for 23 consecutive months, but moderated from a high of 8.4 per cent in November 2011 to below 5 per cent by March 2012 with significant moderation in investment demand and weaker growth momentum. Sustained input cost pressures, however, imparted downward rigidity to non-food manufactured products inflation since then, even though pricing power weakened, resulting in pressures on corporate earnings. The weakening pricing power on the back of slowing growth and monetary tightening, along with favourable base effects and transitory softening of food prices, especially vegetables, contributed to the moderation in inflation. II.2.2 Notwithstanding the moderation, inflation remained high with headline WPI inflation remaining at 6.9 per cent in July 2012 and retail price inflation as per new Consumer Price Index (CPI) remaining near double digits. Inflation prevailed above the threshold level at which growth-inflation trade off stops working and high inflation turns inimical to growth and growth sustainability (see Box II.4 of the Annual Report 2010-11). II.2.3 The monetary policy response of the Reserve Bank during the year was based on the assessment of drivers of inflation, particularly the changing role of aggregate demand relative to other determinants of inflation and time-varying multiple risk factors. Monetary policy was continuously tightened up to October 2011 given the high and persistent generalised inflation. Subsequently, amplified risks to growth and some moderation in inflation warranted a shift in the balance of weight in the conduct, stance and guidance on monetary policy (for details, see Chapter III). Generalisation of price pressures persisted despite softening of growth momentum II.2.4 The persistent nature of inflation during recent years can be gauged from the trends in the average rate of inflation during the past few years along with trends in volatility (as measured by the coefficient of variation of monthly inflation during the year). While the average rate of inflation increased significantly during 2010-11 and 2011- 12, inflation volatility declined considerably (Chart II.12a). Lower volatility at a high level indicates the persistence of generalised high inflation and at the same time reflects the impact of tighter monetary policy in containing it from spiralling up further. Also, inflation across different commodity groups within WPI indicate that its variability declined for most of the period since the second half of 2009-10 indicating generalisation of price pressures (Chart II.12b). The decline in overall inflation during October 2011-January 2012 was marked by increasing variability as only few items contributed to the moderation in inflation. Since January 2012, the variability has come down indicating that the decline in inflation has spread to a number of commodities. II.2.5 Since 1970s, there have been seven episodes of high and persistent inflation in India where the headline WPI inflation was above 8 per cent for more than six months on a sustained basis (Table II.2). Most of these episodes resulted in high inflation persisting for about 2-3 years. Even though these high inflation periods had different drivers like oil shocks, drought and currency devaluation, persistence of inflation seems to be a common pattern when inflation turns high.
II.2.6 Nonetheless, the current high inflation phase is one of the longest phases of high inflation since the mid-1990s. Why inflation has been so persistent even in the wake of a growth slowdown has become an important issue for monetary policy. It may be noted that all three major drivers of inflation, viz., food, fuel and core have been significantly contributing to the high and persistent inflation. While food inflation has generally been volatile with large swings in the prices of certain food items like vegetables, the major driver of food inflation has been protein-rich items whose prices continue to grow at a faster pace. Both increased demand on account of structural changes in dietary patterns and rising input costs driven by increases in wages have contributed to the increase in protein inflation. II.2.7 Even though fuel inflation remains suppressed due to the administered price mechanism, increases in fuel prices had kept fuel inflation in double digits for more than two years (Appendix Table 8). However, fuel inflation moderated to 6.0 per cent in July 2012 as domestic prices of administered fuel products have not been raised in past one year. Pressure on core inflation was visible from rising input costs- raw materials, fuel and staff costs. So, apart from demand pressures, cost pressures were also reflected in core inflation. II.2.8 The WPI exhibited a sustained increase during 2011-12, even though the pace of increase somewhat slowed down during the latter half of the year (Chart II.13). The increase in the WPI during the initial months of the year was driven by a host of factors that included an increase in food prices, a revision in the administered prices of fuel as well as an increase in manufactured product prices in the wake of significant pressure from high input costs as well as strong demand and pricing power. The decline in growth during 2011-12 was expected to ease the pressure on core inflation. However, the extent of moderation was constrained by further pressure from rupee depreciation and high global commodity prices. II.2.9 The phase of softening of inflation was marked by a decline in the contribution of food, which again increased from February 2012 as prices increased sharply after the seasonal decline. The contribution of non-food manufactured products remained strong despite the deceleration in growth momentum (Chart II.14). The contribution of fuel group to overall inflation remained high and significant throughout the year despite suppressed inflation from the administered prices of some petro-products, coal and electricity.
Food inflation rebounded after declining during the year II.2.10 India had a normal south-west monsoon during 2011, which had a moderating impact on the prices of select food items, especially cereals and pulses, for which the average inflation during the year was moderate at 3.6 per cent. However, food inflation driven by non-cereal items, whose output is less responsive to monsoon in the shortrun, remained high (Chart II.15). There is some evidence that rising per-capita incomes and changes in dietary patterns led to increase in demand for protein-rich items. Input cost pressures have also been significant in recent years, with significant increases in wages. Besides weak supply responses, input cost pressures sustained the food inflation at a high level, except for occasional seasonal declines. Primary food articles inflation declined sharply during November 2011– January 2012, from above 10 per cent to negative territory, largely reflecting a seasonal decline in the prices of vegetables and a favourable base effect. However, prices rebounded significantly subsequently, resulting in food inflation reverting to double-digit levels by April 2012. The prices of protein-based food articles have remained persistently high since October 2011. II.2.11 Managing food inflation requires measures to augment supply since demand management through monetary policy to contain food inflation has its own limits and costs in terms of growth sacrifice. Food inflation has not only exhibited greater volatility at higher average levels, but there is also increasing divergence between prices at the wholesale and retail levels. This points to the role of rigidities in the supply chain. Effective policy interventions in this regard need to take into account several institutional factors (Box II.5).
Box II.5
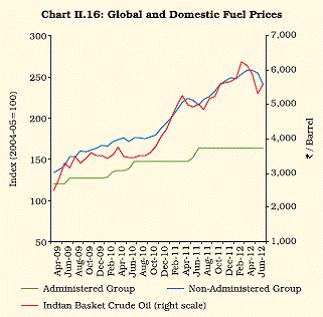
The marketing channels for various commodities are distinguished from each other based on the market functionaries involved in carrying the produce from the farmers to the ultimate consumers. The length of the marketing channel depends on the size of the market, the nature of the commodity and the pattern of demand at the consumer level. These channels as identified in micro level studies can be classified into (i) Producer-Consumer, (ii) Producer-Retailer- Consumer, (iii) Producer-Wholesaler-Retailer-Consumer, (iv) Producer-Commission agent-Wholesaler-Retailer- Consumer and (v) Producer-Village Merchant-Wholesaler- Retailer-Consumer. As mentioned by Balappa and Hugar (2003) while Channels (i) and (ii) are slowly emerging, other channels are well established, with the farmers preferring shorter supply chain channels among them. Gupta and Sharma (2009) found that farmers are not solely guided by the marketing efficiency of the channel (which secures the maximum producer’s share in the consumer’s rupee), but also seek to market their produce through channels that serve retail markets with the capability to absorb larger supplies. Finally, intermediaries in the value chain of several commodities exist to tap the scale economies associated with services like transportation (Saraswat, 2009). The three major challenges in the supply chain environment are: 1) improving the accessibility of regulated markets, 2) promoting greater competitiveness by suitable amendments to Agricultural Produce Market Committee (APMC) Act and 3) facilitating the emergence of a nationwide common market. Although the ideal density of regulated markets could be 15,000 to 18,000 ha of gross cropped area as mentioned in the Report of the ‘Working Group on Agricultural Marketing Infrastructure and Policy Required for Internal and External Trade for the Eleventh Five-Year Plan’, it varies between 13,580 ha in West Bengal to 37,050 ha in Madhya Pradesh. Suggestions have also been made to reform the APMC Act to address the perceived concerns regarding mandi governance (Economic Survey, 2011-12) and monopolistic tendencies (Inter-Ministerial Group on Inflation). The different rates of entry tax/octroi tax and sales tax that vary across states as well as across commodities prevent the emergence of a nationwide common market for agricultural produce. Moreover, restrictions on the movement of goods under the Essential Commodities Act remain in place in various states. The suggestions from various policy documents to strengthen the supply chain can be classified as: 1) enhancing the capabilities of farmers, 2) strengthening infrastructure, and 3) legislative interventions. By encouraging farmers to organise themselves into groups – growers’ groups, cooperatives, self-help groups and producer companies – supply chains can be streamlined as well as made more egalitarian. Also, investments across the entire agri-value chain spectrum, such as creation of cold chains, rural godowns, new agricultural marketing infrastructure, and modernisation of existing markets could be promoted by providing them with tax holidays and suitable exemptions. As suggested by the Inter-Ministerial Group on Inflation, perishables could be taken out of the ambit of the APMC Act to encourage arbitrage activity by small traders and farmers by allowing them to freely trade perishables through buying where it is cheap and selling where it is expensive. Similarly from the long-term perspective of inflation management, it is crucial to improve mandi governance by holding regular elections of agricultural produce market committees as well as to bring professionalism into the functioning of the existing regulated markets through public private partnership. References Balappa, S.R. and L. B. Hugar (2003), ‘An Economic Evaluation of Onion Production and its Marketing System in Karnataka’, Agricultural Marketing, Vol.XLVI (2), July- September. Gokarn, Subir (2011), “Striking a Balance between Growth and Inflation in India” presentation at Brookings Institution June 27, 2011. Gupta, M. and K.D. Sharma (2009), ‘Production and Marketing of Ginger in Himachal Pradesh’ Agricultural Situation in India, Vol. LXVI(13), 681-686. Saraswat, S.P. (2009), ‘Understanding the apple marketing system of Himachal Pradesh with reference to Kiari village of Shimla’ Agricultural Situation in India, Vol. LXVI(4), July, 187-190. Suppressed fuel inflation through administered pricing continued II.2.12 Pressure from the sustained increase in global oil prices continued during 2011-12. Global crude oil prices (Indian Basket), which averaged US$85 per barrel during 2010-11 increased by about 31 per cent to US$112 per barrel during 2011-12. The increase in domestic mineral oil prices, however, was much lower, by about 17 per cent (Chart II.16). Freely priced product prices moved in line with the changes in international prices while administered fuel prices were revised in June 2011. Despite the revision in administered prices of fuel, the suppressed inflation in the energy segment remains significant. This has resulted in under-recoveries to the amount of `1.38 trillion during 2011-12, with the bulk of under-recoveries (about 59 per cent) coming from diesel. This would entail higher subsidies to the oil marketing companies with its attendant fiscal pressure on inflation. II.2.13 Among the other major items in the fuel group, one major pressure on overall inflation has been the changes in the prices of coal. In January 2012, the price of non-coking coal was increased by 33 per cent, contributing thereby to an increase in the overall WPI by 0.34 per cent in terms of the direct impact. Given that coal is an input for many industries, including electricity generation, changes in coal prices do transmit to generalised inflation. Recent emerging trends in the coal sector indicate the need to address basic issues in this sector (Box II.6). Also, electricity price increases in the past have been much lower than the increase in input costs, which has also severely impacted the finances of state-run electricity boards.
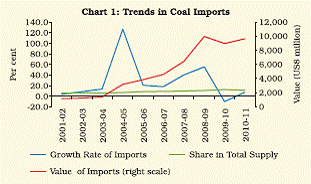
Box II.6 Coal is one of the world’s most important sources of energy, fuelling around 42 per cent of electricity generation worldwide and also meeting about 30 per cent of global primary energy needs. In India, two-third of the country’s electricity generation is based on coal. India’s coal reserves have been assessed at about 286 billion tonnes as on April 1, 2011, of which 114 billion tonnes (or 40 per cent of total reserves) are proven reserves according to the Geological Survey of India (GSI). At the current level of production of around 540 million tonnes per annum in 2011-12, the coal reserves in the country are expected to last for more than 100 years. Despite being the third largest producer of coal in the world, India is a significant net importer of coal as the country’s domestic production is insufficient to meet the large and growing needs of power companies, steel mills and cement producers (Chart 1). According to the Ministry of Coal, the gap in demand and domestic supply of coal has increased to 161 million tonnes (MT) in 2011-12 from about 43.4 MT in 2006-07. According to the revised estimates of the Ministry of Coal, the demand is projected to increase to 980 million tonnes in the terminal year (2016-17) of the 12th Five-Year Plan, against which indigenous availability is projected to be 795 million tonnes. Therefore, the gap between demand and domestic availability is projected to be 185 million tonnes which needs to be bridged by importing coal.
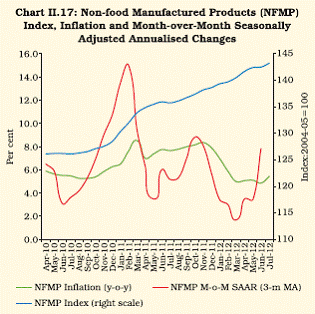
The shortage of coal is affecting electricity generation in different power plants. According to the Central Electricity Authority, power generation utilities have already reported a production loss of 8.7 billion units during 2011-12 (up to February 2012) on top of an 8.4 billion unit loss in 2010-11 and a 14.5 billion unit loss in 2009-10 on account of coal shortage. The Ministry of Coal pointed out that coal shortage has resulted in a significant increase in coal imports, from 43.1 MT in 2006-07 to 98.9 MT in 2011-12. Higher import dependence calls for parity between domestic and international prices, given the known adverse implications of administered pricing of petroleum products for domestic imbalances. International coal prices have been higher than domestic coal prices even when adjusted for quality and the divergence has persisted for some time, despite the fact that domestic coal prices were completely de-regulated in 2000. Coal India Limited (CIL), that provides 80 per cent of the domestic supplies, periodically fixes the price of coal in line with market prices. Thus, a combination of higher import dependence and elevated international prices of coal has the potential to impact key macro indicators like inflation, growth, fiscal deficit and current account deficit, as witnessed in the case of oil imports, although the magnitude may differ. A revision in the coal pricing formula was contemplated in January 2012 to bring domestic coal prices in line with international prices. However, the increase was rolled back subsequently as the overall coal price increase on account of the new pricing was substantial. This would have increased the input costs for power generation and the steel and cement industries which would have been inflationary. According to the New Coal Distribution Policy (NCDP), coal supplies are governed by legally enforceable agreements between the seller (coal companies) and the consumer under specific terms and conditions. Various model Fuel Supply Agreements (FSAs) exist for different categories of consumers. The Government recently decided that CIL would sign FSAs with power plants that have entered into long-term Power Purchase Agreements (PPAs) with distribution companies (DISCOMs) and have been commissioned/would get commissioned on or before March 31, 2015. In this context, CIL has proposed a new FSA assuring coal supply at 80 per cent of the annual contracted quantity with a penalty of 0.01 per cent in case of shortfall in supply, operative after a period of three years after signing of FSA. These terms are not acceptable to the power sector. In this backdrop, a large part of the new capacities in power sector are at risk due to coal shortages. These, in part, would have to be met by imported coal at higher cost. As such, pooled coal prices would need to go up. Even in case of the FSAs, the domestic price of coal may see upward revisions in the coming years as the FSAs assure coal supplies at the notified prices, which are subject to revision from time to time. Inflationary pressures on core component eased in the latter half of the year II.2.14 Non-food manufactured products inflation, which remained at or above 7 per cent during February–December 2011, moderated significantly to below 5 per cent by March 2012. The high inflation in this segment during the initial part of the year was on account of the sharp increase in input cost pressures, which the firms could pass on in the presence of buoyant demand. As growth decelerated, the pricing power of firms weakened, which led to a decline in the inflation momentum in this category on a sustained basis in the second half of the year. During Q1 of 2012-13, non-food manufactured products inflation ruled at for 5.0 per cent before rising to 5.4 per cent in July 2012 (Chart II.17).
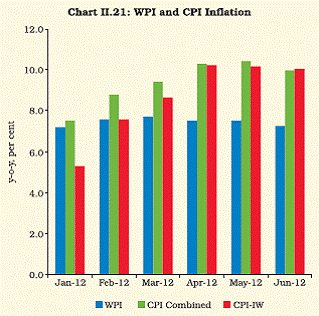
Global commodity prices generally moderated, with some hardening in the latter half of the year II.2.15 Global commodity prices exhibited a contrarian trend relative to domestic inflation during 2011-12. Commodity prices trended downwards for the larger part of the year, factoring in deepening euro area debt problems, risks to global growth, easing of geo-political tensions in the Middle East and improved supply prospects in key commodities, including agricultural commodities (Chart II.18). During the last quarter of 2011-12, however, commodity prices, especially crude oil, increased significantly, following geo-political tensions in Iran and improved growth prospects for the US. Although commodity prices moderated significantly since March 2012, tight demand-supply conditions in key commodities along with the presence of large liquidity in the global market keep commodity prices highly vulnerable to shocks. This is evident from the recent reversal in energy prices as well as increase in global food prices as drought in US and unfavourable weather conditions in Europe and other major producers impacted on supplies. Exchange rate movements impacted the inflation trajectory II.2.16 Apart from trends in commodity prices, exchange rate movements also impacted the overall inflation path. The pass-through of depreciation of the rupee since August 2011 has often either amplified or dampened the impact of commodity prices, depending on the direction and magnitude of commodity price changes. Empirical estimates in the Indian case indicate that the pass-through has declined over time (Box II.7). However, given the magnitude of depreciation of the rupee since August 2011, the exchange rate became a source of pressure on inflation. Widening fiscal gap poses threat to inflation moderation II.2.17 Although the government had envisaged a path for fiscal consolidation during 2011-12, the shortfall on achieving the target on key deficit indicators emerged as a major issue in inflation management. The shortfall in revenue partly on account of the growth slowdown and the increase in the subsidy burden, particularly in fuel and fertilisers, contributed to the widening of the deficit (for details, see Section II.5: Government Finances). Though fiscal intervention in terms of administered prices kept part of the inflation suppressed in the near-term, overshooting of expenditure increases aggregate demand and leads to medium-term risk to price stability. Wage pressures on inflation remained significant II.2.18 High inflation, through its impact on inflation expectations, could influence wage-setting behaviour and thereby generate a wage-price spiral. Available empirical evidence in the recent period indicates that wages both in rural areas and in the manufacturing sector, have been growing at a rate faster than inflation (Chart II.19). There is significant divergence in wage-price relationship in rural areas across different states which point towards the role of state specific factors in conditioning the overall wage-inflation dynamics (Chart II.20). Increases in real wages indicate that inflation is not always a tax on the working population, particularly when the wage increase is in excess of productivity growth. The pressure on inflation from wages has become more visible in the post Mahatma Gandhi National Rural Employment Guarantee Scheme (MGNREGS) period, as MGNREGS provides a floor to wages in rural areas, which are also indexed to inflation (Box II.8).
Box II.7 Exchange rate pass-through (ERPT) reflects the percentage change in local currency import prices following a one per cent change in the exchange rate between importing and exporting countries. Pass-through of depreciation of exchange rate to domestic consumer price inflation seems to have declined across several countries over time, partly reflecting the result of a switchover to inflation-focused monetary policy frameworks and the success of monetary policy in anchoring inflation expectations (Mishkin, 2008). When commitment of monetary policy to inflation is strong and credible and inflation expectations remain well-anchored, the impact of shocks – whether from aggregate demand, energy prices or the exchange rate – on inflation expectations and trend inflation may be weaker. Monetary policy performance in anchoring inflation expectations, however, is only one among several determinants of pass-through. Other determinants of pass-through include: (a) inflation persistence, (b) pricing to market behaviour, (c) price elasticity of demand in the importing country, (d) share of local distribution and marketing costs in the final retail price, (e) size of a country, (f) degree of openness, (g) exchange rate volatility and persistence of exchange rate shocks, and most importantly (h) domestic demand conditions at the time of the depreciation of the exchange rate. Pricing-to-market behaviour may indicate that exporters from the rest of the world are partially absorbing the impact of the depreciation in the importing country. If domestic manufactures of import substitutes keep their prices unchanged, it also weakens pass-through. Disaggregated commodity-wise analysis could suggest that price elasticity of demand for certain items – like gold and oil – may be low, which in turn would imply higher pass-through in such items. At times, however, because of suppressed inflation reflecting fiscal policy interventions in the pricing of imported items, passthrough may remain depressed. With rising openness, higher import penetration may also increase pass-through. If depreciation is perceived to be short-lived and not permanent, pass-through may not be high. Misalignment of the exchange rate, in terms of the behaviour of the Real Effective Exchange Rate (REER), could often be a lead indicator of how the market perceives depreciation. An important determinant of pass-through could be domestic demand conditions, which is an indicator of pricing power. In items that are price elastic, weak domestic demand would significantly limit the pricing power of firms. As a result, both exporting firms from the rest of the world and the importing firm in the country of depreciation may have to adjust their profit margins resulting in lower pass-through. In India, monetary policy over time has established greater commitment to the inflation objective despite a multi-objective and multi-indicator approach to policy. However, because of successive supply shocks, in recent years inflation persistence, often at elevated levels, has been experienced. Large misalignments in exchange rate have been generally non-existent, and the Reserve Bank’s emphasis on containing volatility in the exchange rate has ensured stability. India’s openness, in terms of share of imports in GDP, however, has increased but suppressed inflation in petroleum products continues, despite the importance of market-based pricing to improve the fiscal position. Empirical evidence on ERPT in India finds overwhelming evidence for an incomplete pass-through even though there is varied evidence on the quantum of pass-through. Khundrakpam (2007) found that there was no clear-cut evidence of a fall in exchange rate pass-through to domestic prices after the 1991 reforms. Further, there was asymmetry in pass-through between appreciation and depreciation, and between sizes of the exchange rate change. Bhattacharya et al. (2008) found that a one per cent change in the exchange rate causes a 0.04–0.17 per cent change in the CPI level and a 0.29 per cent change in the WPI level in the long run. Mallick and Marques (2008) found that the pass-through remained incomplete in the 1990s but exceeded the tariff rate pass-through. ERPT, in recent years, has been low, perhaps due to significant suppressed inflation in petroleum products. It is also possible that exporters from the rest of the world might have absorbed part of the impact in order to retain their market share in India, which in turn would have led to a somewhat lower pass-through. Given the depressed global demand conditions, pricing-to-market behaviour of exporters from the rest of the world might have contributed to the decline in the estimated pass-through impact on inflation. Reference Khundrakpam, Jeevan Kumar (2007), “Economic reforms and exchange rate pass-through to domestic prices in India”, BIS Working Paper No.225. Bhattacharya, Rudrani, Ila Pattnaik and Ajay Shah (2008), “Exchange rate pass-through in India”, available at http://macrofinance.nipfp.org.in/PDF/BPS2008_erpt.pdf. Mallick, Sushanta and Helena Marques (2008), “Passthrough of exchange rate and tariffs into import prices of India: currency depreciation versus import liberalisation”, Review of International Economics, 16(4): 765-782. New CPI suggests higher inflation in the ‘non-food non-oil category’, with much of the pressures visible in services. II.2.19 While the Reserve Bank continued to present its inflation outlook in terms of WPI inflation for the conduct of its monetary policy, inflation assessment has always been based on both WPI and different measures of CPI. The greater reliance on WPI for monetary policy in contrast with a reliance on CPI for most other countries reflected better data quality arising from more frequent data availability (until the weekly series was discontinued), the shorter lags with which data is available, a wider basket of commodities and a more up-to-date base year. From January 2012, inflation numbers based on the new CPI with a more recent base (year 2010=100) became available. The new series has, however, shown significant divergence relative to WPI and other CPI measures, both in terms of level and the overall trend (Chart II.21). While a certain degree of divergence was expected because of the difference in coverage, weights and price quotes of different indices, a rising inflation path in an environment of softening growth momentum has raised the question of whether price rigidities are more at the retail level as compared to the wholesale level. Even when the volatile components are removed to make an assessment of the behaviour of the price situation relative to demand conditions, the ‘non-food non-oil’ CPI-All India inflation remains above ‘non-food non-oil’ inflation in WPI (Table II.3). The inclusion of services and rent as also the collection of price quotes at the retail level explain part of the divergence. Higher CPI inflation suggests that the cost of inflation from the standpoint of consumer welfare has been much higher than appears from trends in WPI. However, until data on the new CPI over a longer time period become available, it would be difficult to assess its behaviour in relation to other key macroeconomic variables. Till such time, it may be difficult to fully assess the information content of the new CPI for monetary policy purposes, but the new index is viewed as supplementary evidence on price trends at the retail level.
Box II.8 Cost-push inflation caused by sustained wage pressures has always been a dominant theoretical determinant of inflation, even though over time the relevance of wage-push as an independent determinant of inflation has been subjected to rigorous empirical scrutiny. Wage-push inflation results when nominal wage rate increases exceed growth in labour productivity and firms, instead of taking the pressure on their profit margins, pass on the higher wage costs in the form of higher prices. As workers get higher wages, they sustain their demand for goods and services when inflation rises, and, with a lag, demand even higher wages. This leads to wageprice spiral. Conventional wisdom suggests that activity in labour markets could be a lead indicator of inflation. A fall in the unemployment rate relative to the natural rate could mean an overheating of the economy and, hence, higher wage inflation and headline inflation. Wage-price inflation, thus, has a common determinant, i.e. labour market conditions. Wage inflation and price inflation, therefore, may exhibit co-movement and there could also be bi-directional causality; but a wage-price spiral independent of positive output-gap and tight labour market conditions could be difficult to sustain. Empirical evidence, however, suggests that wages have increased even with high unemployment, implying that wage inflation is increasingly less responsive to unemployment trends. There have been episodes of both unemployment declining without much corresponding improvement in growth (such as the recent Bernanke conundrum) and also high growth accompanied by inadequate job creation (such as the concern about job-less growth in India). Moreover, alongside higher unemployment in advanced economies, the announced job vacancy rate at times also increases, suggesting an upward shift in the Beveridge curve (which shows the relationship between unemployment rate and vacancy rate). This often reflects the gap between skill needs for open vacancies and the skill set possessed by the unemployed. Thus, when there is a large premium for skills, wages may increase even with high unemployment. Till the skill gap persists, wages could keep rising. Another major driver of wage-push inflation often could be wage indexation, in which case wage-push may become an independent determinant of inflation. At times, instead of using hard options to contain inflation, a country may opt for a soft option like wage indexation to limit the costs of high inflation to the common man. In that process, however, the economy gets exposed to other risks. The first such risk is that “…indexation weakens policymakers’ will to fight inflation” (Ball and Cecchetti, 1989). As underscored by Okun (1971), wage indexation “may be read as evidence that the government has raised its tolerance level of inflation …It is quite rational to expect that the more effectively the government can minimise the social costs of inflation (through indexation), the more inflation it will accept”. Second, wage indexation will tighten the constraint of wage rigidity and lead to misallocation of resources by preventing necessary relative wage adjustments relative to productivity trends in different sectors. In any disinflation policy strategy, nominal downward rigidity of wages is a major constraint, which gets amplified with wage indexation. Keeping real wage growth at a rate that does not exceed productivity growth is important for both long-term growth and external competitiveness. As noted by Mihaljek and Saxena (2010), skilled labour shortages and public sector wage policies are two factors that could lead to real wages exceeding productivity in emerging economies. In India, in the post-MGNREGS period, wages in rural areas have increased at a faster rate than inflation. Agricultural growth in the Eleventh Plan period has remained below the 4 per cent target, but real wages have increased at a higher rate. Even in urban areas, annual wage increases have been strong, despite weaker output growth in the recent years. The coverage of MGNREGS in terms of total mandays employed, may not be significant enough to exert pressure on inflation from demand pressures arising from income transfers. However, the major inflationary risk emerges from MGNREGS exerting pressure on the overall wage structure, and also raising the wage level annually because of wage indexation. The risk of an emerging wageprice spiral in India can be studied empirically using the limited available data on rural wages and industrial sector wage data. Empirical estimates based on monthly wages for rural unskilled labourers and CPI rural labourer’s inflation (available from the Labour Bureau) indicate that there is a bi-directional causality between wage inflation and price inflation (Table 1) implying that there is evidence of a wageprice spiral. In the organised manufacturing sector, the average wage per worker was growing at a moderate rate of 3.9 per cent per annum during the period 2000-01 to 2005-06, which accelerated to 9.3 per cent during 2006-07 to 2009-10. Available evidence on the wage-price spiral partly explains the stickiness of the inflation path and why cyclical moderation in growth momentum does not lead to a corresponding softening of inflation. Reference Ball, Laurence and Stephen G. Cecchetti (1989), “Wage Indexation and Time-Consistent Monetary Policy,” NBER Working Papers 2948, National Bureau of Economic Research. Mihaljek, Dubravko and Sweta Saxena (2010), “Wages, productivity and “structural” inflation in emerging market economies”, BIS Working Papers No.49, BIS. Okun, Arthur M. (1971), “The Mirage of Steady Inflation.” Brookings Papers on Economic Activity, Vol. 2, 485-98. Inflationary pressures likely to persist in 2012-13 II.2.20 Going forward, risks to inflation remain from unsatisfactory monsoon and increases in MSP even as growth slowdown eases demand pressures. Monsoon till August 16, 2012 has been 16 per cent below Long Period Average. Reserve Bank’s production weighted index places the monsoon deficiency at 21 per cent. Sowing picked up considerably in the latter half of July but significant shortfall remains in case of coarse cereals, pulses and some oilseeds, especially groundnut. These sowing shortfalls could emerge as price pressure points. As global food prices are already on the rise on the back of drought in parts of US, Eurasia and Australia, the option to bridge demand-supply gaps through imports would have its limits. The large carryovers and buffers in domestic stocks of food would come in handy at this juncture, though efforts are necessary to ensure that its movement and use is efficient. II.2.21 With likely increase in food inflation, containing spillovers and generalisation of price pressures is important in the current context. Though core inflationary pressures remained muted during Q1 of 2012-13, risks remain. Continued rise in real wages and food price shocks may spill over to core inflation. The decline in global metals and energy prices during Q1 of 2012-13 provided some relief, but these gains have been partly offset by rupee depreciation and recent rebound in global energy and food prices. In this backdrop, persistence of inflation, even as growth is slowing, has emerged as a major challenge for monetary policy. II.3 MONEY AND CREDIT II.3.1 Monetary and credit conditions in the year 2011-12 were marked by two distinct broad phases. During the first half of the year, monetary policy was tightened. Liquidity conditions generally remained in line with the policy objective of maintaining moderate deficit of 1 per cent of NDTL, under which monetary policy transmission was seen to be more effective. More liquidity was judged to be inimical to the monetary policy goal of containing inflation, as it could spill over to prices via excess demand. In the second half, the Reserve Bank paused its tightening cycle. Liquidity deficit, however, worsened due to some unforeseen factors. First, the Reserve Bank sold dollars to contain the volatility in the rupee exchange rate. Second, the frictional mismatch caused by the sudden build-up of government cash balances persisted for a longer duration. Third, the gap between growth in credit and deposit, which was narrowing during the first three quarters of the year, widened again during the fourth quarter on account of a sharp deceleration in aggregate deposit growth and a pick-up in credit growth. II.3.2 Headline inflation averaged about 9.5 per cent over two calendar years – 2010 and 2011, after remaining low during most of 2009. In response, the Reserve Bank persisted with its anti-inflationary monetary policy stance during February 2010-October 2011, gradually raising the operational policy repo rate by 525 basis points and the CRR by 100 basis points. The tightening was necessary as inflation risks outweighed risks to growth and would have adversely impacted growth. As domestic demand slowed, partly due to monetary policy actions, headline inflation moderated. Taking into account the forwardlooking assessment that growth was slowing more than what was foreseen earlier, the Reserve Bank signalled a monetary policy pause in Q3 of 2011- 12. It also infused liquidity by undertaking open market operations through outright purchases. Subsequently, the Reserve Bank eased policy rates in April 2012 factoring in the moderation in growth. In August 2012, the Reserve Bank reduced SLR by 1 percentage point with a view to providing liquidity to facilitate credit availability to productive sectors. Expansion in net domestic assets (NDA) offset by decline in net foreign assets (NFA); reserve money growth remained low during 2011-12 II.3.3 The movements in reserve money during 2011-12 reflected the offsetting liquidity management operations of the Reserve Bank in response to the autonomous liquidity drivers (Chart II.22 and Appendix Table 9). During the year, the autonomous drivers, viz., government cash balance, the Reserve Bank’s forex operations and currency with the public, resulted in the drain of liquidity from the banking system. Large scale open market operations through outright purchases of G-sec of `1.3 trillion and daily liquidity adjustment facility (LAF) operations by the Reserve Bank resulted in the expansion of net domestic assets (NDA). However, reserve money growth decelerated during the year as NFA declined due to the Reserve Bank’s interventions in foreign exchange market. The deceleration in reserve money was further accentuated by a reduction in the cash reserve ratio (CRR) during the fourth quarter that in the first round reduced the deposits maintained with the Reserve Bank by around `795 billion. Even after adjusting for the change in CRR, reserve money growth decelerated during 2011-12.
II.3.4 Currency in circulation, which is the largest component of reserve money, decelerated in 2011- 12 mainly on account of moderation in economic activity and inflation. The cumulative rise in the deposit rates progressively raised the opportunity cost of holding idle cash, which caused a switch in household savings from cash holdings. II.3.5 Liquidity deficit in the first half of 2011-12 remained within the comfort zone of the Reserve Bank on account of increased government spending. The government persistently resorted to Ways and Means Advances (WMA) along with occasional over draft (OD). Accordingly, the need for injection of durable discretionary liquidity did not arise during the first half. II.3.6 The deceleration in the growth of reserve money (adjusted for CRR), particularly since November 2011, reflected offsetting movements in the autonomous and policy drivers of liquidity. The Reserve Bank responded to the structural drivers of liquidity – forex sales and increased demand for currency as compared to previous quarters – by the injection of durable liquidity in the form of OMO purchases and CRR cuts. The frictional dimension of autonomous liquidity – a build-up of government balance – was addressed by the provision of overnight liquidity under LAF/MSF. Following the seasonal easing of government balances, the narrowing of the wedge between the pace of growth of deposit and credit, and the Reserve Bank’s active management of liquidity through LAF and OMO, liquidity deficit under LAF declined during 2012-13 so far. Chapter III provides a detailed discussion on the Reserve Bank’s liquidity management operations. Behavioural and policy factors result in higher money multiplier II.3.7 The deceleration in reserve money in 2011-12 was led by a moderation in the demand for currency. The value of the money multiplier depends on two behavioural ratios – currency deposit ratio and reserves-deposit ratio. During the first three quarters of 2011-12, the response of banks and households to the hardening of monetary conditions led to the rise in the value of the money multiplier (Chart II.23). During 2011- 12, the money multiplier peaked on the fortnight ended February 24, 2012, following the 50 basis points cut in the CRR in January 2012, which reduced the amount of required reserves to be maintained. Following a second round of decline in the CRR by 75 bps from the fortnight beginning March 10, 2012, the money multiplier rose further in recent period.
II.3.8 The rise in the money multiplier, however, could not offset the sharp deceleration in the reserve money, and money supply growth decelerated to 13.1 per cent at end-March 2012 from 16.1 per cent a year ago (Chart II.24). Even though the money supply growth marginally recovered subsequently at 13.5 per cent as on July 27, 2012 it still remains below the Reserve Bank’s indicative trajectory of 15 per cent. Broad money growth remains strong, but softens in Q4 as deposit growth decelerates II.3.9 Consistency among money, growth and prices depends on the stability of the demand function for money. Empirically, the demand for money in India is found to be stable over the medium to longer term (Box II.9).
II.3.10 Broad money (M3) growth, which was above the 15.5 per cent year-end trajectory by the third quarter of 2011-12, declined sharply from mid- January 2012, partly due to insufficient liquidity creation to offset frictional and structural liquidity deficits and partly due to slowing growth and inflation. All components of broad money exhibited a deceleration during 2011-12 (Appendix Table 10). Time deposits recorded strong growth during the first three quarters mainly on account of the rising opportunity cost of holding cash or demand deposits as the interest rates on time deposits responded to the anti-inflationary monetary policy stance of the Reserve Bank. The substitution from other components of household financial savings, such as small savings and mutual funds was also mirrored in the strong growth in time deposits. During the fourth quarter of 2011-12, however, tight liquidity conditions slowed down time deposit growth, which was further aggravated by the base effect. Banks supplemented deposits with alternate sources such as borrowings by way of debt instruments and LAF. The importance of money as an information variable for the conduct of monetary policy hinges on the stability of its demand with respect to its determinants. Even though India abandoned what was known as ‘monetary targeting with feedback’ in 1998, where broad money (M3) served as the intermediate target of monetary policy, monetary aggregates in general and M3 in particular continue to play an important role in the formulation of monetary policy. Consistent with its projections on growth and inflation, the Reserve Bank gives its projection for M3 growth for the financial year at the beginning of each financial year. Subsequent changes, if any, in the outturn of the evolving growth-inflation dynamics results in a change in the monetary projection. This presumes a stable demand for money. Any deviation between the initial projection and the final outturn of M3 depends not only on the accuracy of the projection of growth and inflation – the proximate determinant of money demand – but also on the stability of the money demand function. Further, there are evidences of bi-directional causal relation between money, prices and income as was recognised in the ‘monetary targeting with feedback’ approach. What has now prompted a revisit of the stability of the money demand function is whether the deceleration in money growth during recent years is in line with the deceleration in nominal GDP growth (Chart 1). Does it imply financial disintermediation induced instability in the demand for money that has prompted many formerly monetary targeting countries to abandon it? Or is it a consequence of the decelerating financial saving of households as households rebalance their portfolios in favour of assets that are illiquid but yield a higher rate of return? These issues have necessitated a re-examination of the demand for money in India.
Theoretically, the demand for money depends primarily on income and the opportunity cost of holding money. As real income grows, the demand for money increases to finance a higher volume of transactions. Further, the higher real rate of return on alternative assets increases the opportunity cost of holding money, thereby reducing the ‘speculative’ demand for money. Also, financial innovations that involve the introduction of new financial instruments influence the demand for money. In addition, with full convertibility on the current account in 1994, the measures taken to liberalise the capital account, exchange rate and foreign rate of interest are expected to have a bearing on the demand for money. The mainstream literature in the Indian context define the demand for broad money (M3) as a function of either real income and price level (e.g., Mohanty and Mitra (1999), Ramachandran (2004)) or real income and a short term nominal interest rate (e.g., Rao and Singh (2006)). The empirical literature has debated considerably on the stability of money demand and found mixed evidences depending on the model specification and time period under consideration. An empirical investigation of demand for money for the period 1970-71 to 2011-12 reveals that there is a long run cointegration relationship between money balances, real income and the price level. Money demand is defined as the average M3 for the year, real income is measured in terms of GDP at constant market prices. The price level is captured using the WPI. All these variables are in natural log forms. Accordingly, the estimate for long-run money demand is as under: M3 = 9.62 + 1.30 GDP + 0.98 WPI……………(1) where the figures in parentheses indicate standard error of the estimates. The coefficients are significant at 5 per cent level. The income elasticity of money demand is estimated to be 1.3, while a one percentage increase in price level translates into a nearly proportionate increase in the long run demand for money. Standard tests indicate robustness of these results. Other explanatory variables, for instance, proxies for financial innovations, alternative sources of funding etc. didn’t exhibit significant long term relation in the above specification. On the whole, the empirical analysis indicates that the demand for money (equation 1 above) in India remained generally stable over the period under consideration. References Mohanty, D., and A. K. Mitra (1999), ‘Experience with Monetary Targeting in India’, Economic and Political Weekly, 34: 16–23. Ramachandran, M (2004), ‘Do Broad Money, Output, and Prices Stand for a Stable Relationship in India?’ Journal of Policy Modeling 26: 983–1001. Rao, B. B. and Rup Singh (2006), ‘Demand for money in India: 1953-2003,’ Applied Economics, 38(11), 1319-1326. II.3.11 On the sources side, the deceleration in M3 was led by commercial credit growth. Besides, the Reserve Bank’s foreign exchange operations also caused a drag on M3 growth. The banking system credit to the government, however, increased significantly. For commercial banks, this reflected their participation in the large market borrowing programme. Credit decelerates as growth slows II.3.12 The Reserve Bank lowered its projection for the growth of non-food credit from 19 per cent in May 2011 to 18 per cent in July 2011 and finally to 16 per cent in January 2012. This was done in recognition of the gradual deceleration in credit growth below the Reserve Bank’s trajectory even as M3 growth was above the Reserve Bank’s indicative trajectory (Chart II.25). The deceleration in credit reflected the combined effect of weakening growth and increasing risk aversion by banks. As a result the SCBs’ investments in government securities increased sharply. However, there is significant evidence suggesting that in India, the interest rate channels and credit channels have been working effectively in recent years (Box II.10).
Box II.10 Monetary transmission explains the mechanisms by which monetary policy changes achieve the ultimate objectives of impacting inflation and growth. The interest rate and credit channels have been particularly important in the Indian case. The interest rate channel explains how changes in money supply affect investment, aggregate demand, inflation and output through changes in interest rates. A contractionary monetary policy raises the real lending rate, thus raising the cost of capital. This causes investment spending, and therefore, aggregate demand to slow down and lead to growth deceleration and the lowering of inflation. The credit channel of monetary transmission occurs through two broad channels – the balance sheet channel and the bank lending channel. The balance sheet channel works by affecting the external finance premium, i.e., the difference between the costs of funds raised externally (equity and debt) and internally (retained earnings). As imperfections and information asymmetry prevails in the credit market, external finance premium tends to rise when central banks raise shortterm interest rates. This affects net cash flows and the impact depends on financial ratios such as the net worth or the coverage ratio of a firm. Cyclical movements in borrower’s balance sheets can amplify and propagate business cycles through “financial accelerators” (Bernanke, Gertler and Gilchrist, 1996). The bank lending channel works by monetary policy impacting the supply of bank loans. As external finance premium rises, bank finance decreases in the sources of funds. This is because sources of finance are imperfect substitutes for one another. Banks, which play an important role in reducing informational problems, tend to lose their retail deposit base as the central bank contracts base money. Since banks cannot fully substitute these through other sources such as CDs or by raising capital, they are forced to contract bank loans. There is significant new evidence of these channels operating in India. Mohanty (2012) using a quarterly structural vector autoregression model showed that policy rate increases in India in recent years had a negative effect on output growth with a lag of two quarters and a moderating effect on inflation with a lag of three quarter. The overall impact persists for 8-10 quarters. Khundrakpam (2011) found that policy induced expansion or contraction in money supply makes banks adjust their credit portfolio. For the period after the introduction of LAF, a 100 bps increase in policy rate was found to reduce credit by 2.8 per cent in nominal terms and 2.2 per cent in real terms. Monetary policy in India under the framework of multiple indicator approach takes into account both interest rate movements and developments in the credit market for policy decision. The speed of transmission in India is often impacted by banks’ having a large share of term deposits. With such deposits locked, banks cost of funds do not change fast enough for them to change their lending rates. References Bernanke, B., Mark Gertler and Simon Gilchrist (1996), “The Financial Accelerator and the Flight to Quality”, Review of Economics and Statistics, 78(1): 1-15. Khundrakpam, J. K. (2011), “Credit Channel of Monetary Transmission in India: How Effective and Long are the Lags”, RBI Working Paper No.20/2011 November. Mohanty, Deepak (2012), “Evidence of Interest Rate Channel of Monetary Policy Transmission in India”, RBI Working Paper No.6/2012, May. II.3.13 The deceleration in credit coupled with the upswing in deposit growth caused the divergence between credit and deposit growth to narrow during the first three quarters of 2011-12 (Chart II.26). The divergence even turned negative in December 2011. The divergence increased following the sharper deceleration of deposit growth during Q4 of 2011-12 and the turnaround in credit during March 2012. This trend of low deposit growth and pick-up in credit continued in Q1 of 2012-13, thus maintaining the high wedge between credit and deposit. As deposit growth moderated, commercial banks increased their recourse to non-deposit sources, viz., borrowings, including through the LAF window. The reduction in CRR in Q4 of 2011-12 also augmented the lonable resources of banks. Reflecting these trends, the outstanding credit-deposit ratio rose from 74.5 per cent at end-March 2011 to 76.7 per cent at end-March 2012. The incremental creditdeposit ratio continued to remain at a high level of 95.5 per cent during 2011-12 (97.5 per cent during the previous year) as banks accessed LAF borrowings for extending credit. In Q1 of 2012-13, however both outstanding as well as incremental credit deposit ratio declined.
Rising non-performing assets (NPAs) adversely affect credit growth II.3.14 Against the backdrop of growth deceleration, the banks exhibited risk aversion in extending credit. Credit growth decelerated across bank groups during 2011-12 ranging between 16.3 per cent in the case of public sector banks (PSBs) and 19.7 per cent for private sector banks. The comparable figures for the previous year were 21.0 per cent and 24.7 per cent, respectively. Since PSBs account for about 74 per cent of the outstanding credit extended by commercial banks, the credit growth of commercial banks decelerated to 17.0 per cent from 21.5 per cent in the previous year. In part, credit deceleration reflects banks’ risk aversion in face of rising NPAs and increased leverage of corporate balance sheets. II.3.15 The deceleration in non-food credit during 2011-12 was accounted for by all sectors, barring agriculture (Appendix Table 11). The deceleration was particularly sharp for the services sector and personal loans and was modest for the priority sector and industry. Within industry, however, medium scale industries witnessed a sharp decline in the flow of credit. During 2012-13 so far, non-food credit growth at 16.9 per cent in mid- August 2012, is in line with the indicative trajectory of the Reserve Bank. II.3.16 In the year 2012-13 so far, there has been a significant easing of liquidity and monetary conditions reflecting lagged impact of 125 bps cut in CRR in Q4 of 2011-12, 50 bps cut in policy rate and liquidity infusion of over `800 billion through outright OMOs and `100 billion through export credit refinance, the limit for which was raised from 15 per cent to 50 per cent of the outstanding export credit. With continued liquidity infusion, there has been a gradual pick-up in monetary and credit aggregates. The 1 percentage point SLR reduction effective August 2012, is expected to further ease liquidity and encourage banks to increase loans and advances. II.4 FINANCIAL MARKETS Euro area debt crisis keeps markets volatile II.4.1 Uncertainties emanating from the ongoing euro area sovereign debt crisis, the downgrade in the outlook of several advanced economies (AEs), and stability issues of euro area banks amid bank recapitalisation concerns, among other factors, kept the international financial markets volatile for most of 2011-12. Cross-holding of sovereign debt, especially by euro area banks, also translated the sovereign debt crisis into banking sector stresses. High debt levels and stretched fiscal space made it difficult for euro area sovereigns to re-capitalise the banks with public money. Concerns over economic growth also came to the fore with many AEs, particularly in the euro area, experiencing low or negative rates of growth. Although some AEs took policy measures to infuse more liquidity, the private demand has remained low reflecting inter alia deleveraging by households and tight bank lending. II.4.2 Higher market volatility was witnessed after the downgrade of the long term US sovereign debt in August 2011. Equity markets witnessed a sell-off, with investor preference shifting towards perceived safe haven assets. The Federal Reserve embarked on an “operation twist” to support the US economy in the face of slow growth and high unemployment. Developments in the euro area warranted swift action by policy makers to avoid a downward spiral in the financial markets. The European Central Bank (ECB) responded by undertaking two Long Term Refinancing Operations (LTRO) that pumped in over €1 trillion. The European Financial Stability Facility (EFSF) also increased its resources to €780 billion. Against imminent default possibility, a bond swap was effected with large haircuts to enable Greece to meet its obligation. The various policy measures in the euro area in response to the crisis had implications for global financial markets (Box II.11). Box II.11 The euro area is caught in a deep, structural and multifaceted crisis characterised by large fiscal deficit, enormous public debt, banking problems and consistently eroding competitive position manifested in a gradually deteriorating current account balance. Beginning with the peripheral euro area in 2009, the sovereign debt crisis has of late cascaded to engulf core euro area economies, like France and Austria, which were downgraded from their AAA rating status in January 2012. It has also brought Greece closer to a possible exit from the euro and resulted in a spillover to a banking crisis in Spain and Portugal. As countries in a currency union, the affected economies are faced with a policy dilemma since they do not have the liberty of using exchange rate and monetary policy as stabilisation measures. I. Policy Measures The policy measures taken to alleviate the crisis were mainly fourfold: (i) regional financial arrangements and euro-IMF joint provision of resources, (ii) exceptional liquidity facility provided by ECB, (iii) measures to recapitalise and strengthen prudential norms in the European banking system and (iv) structural measures to correct a distorted fiscal system. Financial arrangements in the region were effected through the establishment of new institutions, such as the European Financial Stabilisation Mechanism (EFSM) in May 2010, the European Financial Stability Facility (EFSF) in August 2010 and the European Stabilisation Mechanism (ESM) that is being operationalised but has not found favour for a banking license as yet. While EFSM involves funds raised by the European Commission backed by EU budget, institutions such as EFSF were authorised to mobilise resources by issuing bonds and other debt instruments in the market backed by guarantees of 17 euro area member states. These institutions, in alliance with the IMF, financed rescue packages for Greece, Ireland, Portugal and Italy. The ECB arranged to stabilise the sovereign debt markets through security market programmes that involved sterilised purchases of both public and private debt of the affected countries. In December 2011, the ECB committed to supply banks in the euro area with euro-denominated funding for three years in two special long-term refinancing operations (LTROs) that would enable banks to meet their potential funding needs from maturing bonds over the next few years. Since the large sovereign debt holdings of European banks raised the probability of a spillover of the crisis to the financial sector, efforts were made to inspire confidence in the banking system. Popular measures included encouraging stress tests for the banks and their transparent dissemination and the recapitalisation of 65 major banks by raising their core tier I capital to risk-weighted assets ratio to 9.0 per cent by end- June 2012. In terms of medium-term policy measures, European leaders often reiterated their commitment to implementing fiscal austerity measures. At the Brussels Summit in December 2011, EU members agreed that general government budgets should either be balanced or in surplus. Besides, institutions outside the euro area have extended their support through measures such as central banks’ provision of contingent swap lines in 2010 and again in late 2011, and also announced easy and unconventional monetary policy measures. Besides, various structural measures are currently being undertaken including the recent (June 2012) European Council decision on “Compact for Growth and Jobs” which aims to mobilise 120 billion euros for immediate investment by unlocking domestic potential for growth, including through opening up competition in network industries, promoting the digital economy, exploiting the potential of a green economy, removing unjustified restrictions on service providers and making it easier to start a business. There is also a line of thought that though not very likely, exit of troubled nations like Greece from the union may allow more policy flexibility to the affected countries in the medium-term. Assessment The policy measures taken by the euro area, viz., bailing out affected economies and liquidity provision have not proved to be effective in debt crisis resolution. Concerns over fiscal sustainability and solvency of these economies still remain. For example, in June 2012, Spain’s economic condition worsened necessitating bail-out packages for its banks. These appear to be aimed at staving off the crisis rather than addressing its structural issues. Since the economies in a currency union do not have the option to adjust the exchange rate, the necessary adjustment has to come through fiscal consolidation. However, the ongoing fiscal austerity measures are likely to impact nearterm recovery. The clear inter-temporal choice between fiscal consolidation and near-term growth then necessitates concrete collective effort to establish a fiscal union. Besides, efforts should be made to encourage domestic savings and develop indigenous government bond markets to reduce the reliance on foreign capital to finance public debt. Second, regional arrangements have limited firepower, and may require multilateral financial assistance to supplement resources. But this would have direct implications for IMF resource mobilisation, and since the ratification of the 2010 quota reforms is a protracted process, the IMF may have to rely on borrowed resources that may deviate from the equilibrium ratio between quota and borrowed resources, with potential governance implications. This not only pre-empts resources from low-income countries that have become more vulnerable to global economic uncertainties but also puts pressure on crisis by-standers that may be facing an uncertain macroeconomic situation. Third, increased liquidity provision in the region may add to global liquidity, which, in turn, may feed into global inflation and raise monetary policy challenges for EDEs. If increased global liquidity is channelled into commodity markets, rising commodity prices, particularly oil, will stretch current account deficits in oil importing economies like India. Tightening the prudential norms in the European banking systems may lead to deleveraging, which may increase exchange rate volatility in EDEs. Against this backdrop, there has been a debate about whether the crisis response in the euro area has been appropriate. One argument is that the “troika” of the EU, the ECB and the IMF has delayed in responding to the crisis. Douglas J. Elliott, Fellow at Brookings Institution in his testimony argued that the euro crisis could plunge Europe into a deep recession and put the U.S. into at least a mild recession. There are those who argue that the economics of austerity may fail in the euro area. Others argue that the currency union is inherently unsustainable and taxpayer money is being drained through unworkable bailouts. The problem is whether others in the periphery can be ring-fenced and how to thwart a likely strong contagion. Broin (2012) warns that if loss-sharing cannot be agreed on, a messy default is likely to end in a forced exit with far-reaching implications for the rest of the world. Brutti and Saure (2011) find that exposure to Greek sovereign debt and the debt of Greek banks constitute an important transmission channel in the case of the euro area and, overall, financial linkages explain up to two-third of the transmission of sovereign debt in the euro crisis. Further, if Greece leaves the Union, the apprehension about probable exit of other countries from the euro area is likely to increase considerably as their situation is equally fragile. Portugal and Ireland may have to restructure their public debt regardless of whether Greece defaults. Illiquid but solvent countries like Italy and Spain will have to be rescued through lender of last resort support to avoid default. It would have a cascading impact on German and French bank balance sheets as they hold majority of the Greek loans. Subbarao (2012) has pointed to the trilemma being faced by the central banks, including the ECB, in managing price stability, financial stability and sovereign debt sustainability at the same time. This new trilemma has emerged after the global crisis. Reference Broin, Peader O. (2012), “The Euro Crisis: Orderly Default or Euro Exit”, The Institute of International and European Affairs, Report No.8. Brutti, Filippo and Phillip Saure (2011), “Transmission of Sovereign Risk in a Euro Crisis”, December, Swiss National Bank Study Centre, Gerzensee Working Paper No.12.01. Subbarao, Duvvuri (forthcoming), “Price Stability, Financial Stability, and Sovereign Debt Sustainability Policy Challenges from the New Trilemma”, Macroeconomics and Finance in Emerging Market Economies. US Congress (2011), “What the euro crisis means for Taxpayers and US economy”, Testimony of Douglas Elliott before House sub-committee on Troubled Asset Reconstruction Programme (TARP), Financial Services and Bailouts of Public and Private Programs, December 15, 2011 II.4.3 In early 2012, global financial markets, particularly equity markets, witnessed a firm trend due to liquidity emanating from the LTRO and other policy actions by AEs. However, concerns over the euro area sovereign debt crisis have resurfaced in anticipation that a change of leadership in Greece and France may be inclined to re-negotiate the austerity-based bailout plan, leading to stress in financial markets (Chart II.27). During June –mid August 2012, despite various measures taken by the European Council to break the vicious circle between banks and sovereigns, the bond yield of Spain continued to be at elevated level. Further, recent developments like the LIBOR manipulation has also added to the uncertainty by demonstrating the fragilities in the banking and financial sector. The discussion paper from the Financial Conduct Authority of the UK government “The Wheatley Review of LIBOR” released in August 2012, inter alia lays out the necessary reforms for tighter governance of LIBOR, soliciting feedback from concerned parties. II.4.4 The Indian financial markets (especially the equity and currency markets) witnessed significant spillover from the global turmoil in addition to the domestic growth and inflation concerns, anti inflationary monetary policy and governance issues. The financial markets quickly reflected the shocks emanating from the global and domestic economy. A financial conditions index developed in-house highlights the information content in the financial variables (Box II.12).
Box II.12 There is a large body of literature on extracting signals about the real economy from financial variables. Economists and analysts have often used different financial prices as lead indicators of the future course of the economy. Interest rates and interest rate spreads are considered to be useful in predicting the course of the economy (Bernanke, 1990). The shape of the yield curve, i.e. the term structure of interest rates, contains information about the expectations of market participants about the state of the economy in the future. The yield curve contains considerable information on the future path of inflation for horizons of more than one year. Similarly, the spread between three -month commercial paper (CP) and three -month Treasury bill (T-bill) depicts the credit default risk associated with corporates (if liquidity spread can be ignored). Stock and Watson (1989) have found that the spread between CP and T-bill rates, 10-year and 1-year government bond, housing starts, manufacturer’s unfulfilled orders in durable goods industries and growth of part -time work are good predictors of business cycles. Studying the movements in different financial assets in isolation, however, may be of limited use as each price contains information only about a certain aspect of the economy and does not necessarily reveal much about other aspects. This problem can be overcome by constructing an index using the relevant financial variables. This kind of index is usually called a Financial Conditions Index (FCI) and it summarises information about the future state of the economy contained in current financial variables (Hatzius et al., 2010). In essence, the FCI analyses the synthesis of various, sometimes contradictory, signals from financial markets. Indices such as the Bank of Canada’s Monetary Conditions Index, Macroeconomic Advisers Monetary and Financial Conditions Index (MFCI), Bloomberg Financial Conditions Index (BBFCI), Goldman Sachs Financial Conditions Index (GSFCI), Federal Reserve of Kansas City Financial Stress Index (KCFSI), OECD FCI, and Monetary Conditions Index for India (Kannan et al 2006) have been constructed at various times. Drawing from the literature, a FCI for India has been constructed in a principal components analysis framework using monthly data between January 2004 and March 2012. While indices have been computed for money market, bond market, forex market and stock market, an aggregate financial conditions index that covers all segments is also computed (Table 1).
The index has been constructed so that high values depict accommodative financial conditions, whereas low values depict tight financial conditions. It may be seen from Chart 1 that the financial conditions index captures the stressed financial conditions in the wake of the global financial crisis. Evidently, the index shows highly stressed financial conditions in October 2008, just after the collapse of Lehman Brothers. The usefulness of the FCI should be appreciated in the context of its ability to forecast or explain economic variables like GDP, IIP and inflation. The correlation of FCI with growth rates of GDP and IIP are 0.43 and 0.60, respectively, which are statistically significant. The recovery in financial conditions has broadly been in line with recovery in the IIP and GDP growth rates (Chart 2). However, more research is called for to establish the link between the aggregate financial conditions index and economic variables. Reference Bernanke, Ben S. (1990), “On the Predictive Power of Interest Rates and Interest Rate Spreads.” New England Economic Review, November/December, pp. 51-68. Hatzius, J, P.Hooper, F.Mishkin, K. Schoenholtz and M. Watson (2010), “Financial Conditions Index: A Fresh Look after the Financial Crisis”, National Bureau of Economic Research Working Paper No -16150, Cambridge, July. Kannan, R, Siddhartha Sanyal and Binod Bihari Bhoi (2006), “Monetary Conditions Index for India”, Reserve Bank of India Occasional Papers Vol. 27, No. 3, Winter Stock, J. and M. Watson (1989), “New Indexes of Coincident and Leading Economic Indicators,” in O. Blanchard and S. Fischer (eds.), NBER Macroeconomics Annual (Cambridge, MA: MIT), 352-94.
Monetary transmission strong in deficit liquidity conditions for most of the year II.4.5 The monetary policy stance of the Reserve Bank saw a gradual shift from the primary focus of containing inflation and anchoring inflation expectations (during May-October 2011) to more growth enabling, with due cognisance of the inflationary pressures. In line with the policy stance, 2011-12 saw liquidity conditions remaining in a deficit mode, with the later part of the year beginning November 2011 experiencing liquidity deficit beyond the stated comfort level of (+/–) one per cent of net demand and time liabilities (NDTL) of banks (Chart II.28a). Money market rates rose, reflecting monetary policy and structural liquidity deficit II.4.6 The call money rate generally hovered around the repo rate during H1 of 2011-12, when the liquidity deficit was contained mostly within the comfort zone of the Reserve Bank. However, tighter liquidity conditions in H2 kept the call rate mostly above the repo rate (although below the MSF rate). As an aberration of the trend, the year-end scramble for funds by banks to shore up their balance-sheets (and front-loading of reserve) caused the call money rate to move sharply above the MSF rate on March 30, 2012. The rates in the collateralised segments of the money market moved in tandem with the call rate, but generally remained below it during the year (Chart II.28b). The money market rates have declined in 2012-13 so far, with the easing of liquidity conditions, and reduction in the policy rate announced in the Monetary Policy 2012- 13 Statement (April 17, 2012).
II.4.7 The speed of transmission of monetary policy measures to the financial markets determines the efficacy of the policy action. As noted by the working group on Operating Procedure of Monetary Policy (Chairman: Shri Deepak Mohanty), the speed of monetary policy transmission across financial markets was faster in a liquidity deficit situation than otherwise. In-house empirical analysis on the inter-linkages between financial markets and monetary policy transmission reaffirm the finding. Asymmetry in monetary policy transmission to financial markets in India is observed during 2005-11, with the transmission being faster and more persistent when the liquidity is in deficit mode than otherwise. Higher bank deposit and lending rates also reflect improved monetary policy transmission II.4.8 During 2011-12, scheduled commercial banks (SCBs) increased their modal deposit rate by 82 basis points (bps) and modal base rate by 125 bps. The weighted average lending rates of five major public sector banks increased from 10.98 per cent in March 2011 to 12.80 per cent by September 2011 and remained around that level in April 2012 before declining to 12.58 per cent in June 2012, suggesting that bank lending rates were broadly following the policy rate signal. Volumes in collateralised money market declined II.4.9 Transaction volumes in the collateralised borrowing and lending obligation (CBLO) and market repo segments declined in 2011-12 compared to the previous year (Chart II.29). Banks and primary dealers were the major groups of borrowers in the collateralised segments, whereas mutual funds (MFs) and banks remained the major groups of lenders in these segments. II.4.10 The average fortnightly issuance of certificates of deposit (CD) and commercial paper (CP) increased during 2011-12. ‘Leasing and Finance’ and ‘Manufacturing’ companies remained the major issuers of CPs. The effective interest rate for aggregate CD issuances increased to 11.13 per cent at end-March 2012 compared with 9.96 per cent at end-March 2011. The CD rates spiked during March 2012 reflecting overall tight liquidity conditions in the money markets and the reluctance of MFs to rollover bank CDs after asset management companies were made accountable for fair valuations on a mark-to-market basis. The weighted average discount rate (WADR) on CP also increased to 12.2 per cent as at end-March 2012 from 10.4 per cent as at end-March 2011. While the average fortnightly issuance of CPs has increased during 2012-13 so far (till mid-July 2012), it has decreased for CDs. The WAEIR of aggregate CDs and WADR of aggregate CPs declined to 9.1 and 9.3 per cent, respectively, in mid-July 2012.
G-sec yields remained range bound despite large government market borrowing II.4.11 The G-sec yields generally hardened during the early part of H1 of 2011-12 on account of rise in price of commodities, including crude oil, concerns about inflation and government’s fiscal deficit. The rise in yields also reflected transmission of the hikes in policy rates by 50 basis points in May 2011. In the later part of H1, the G-sec yields remained range bound amidst tight liquidity conditions, persistent inflation concerns, hike in policy rates by cumulative 100 bps in three stages and growth concerns as reflected from weak IIP data and rush for safe haven assets after S&P downgraded the credit rating of the US (Chart II.29d). II.4.12 During the initial part of H2 of 2011-12, the yields continued to rise after the Reserve Bank hiked the policy rate by 25 bps. The yields, however, eased from mid-November 2011 on the back of enhancement in FII investment limits in G-sec, easing of food inflation and the pause in rate hikes as announced in the Mid-Quarter Monetary Policy Review (December 2011). OMO purchases by Reserve Bank also helped in easing of G-Sec yields (Box II.13). However, prevailing tight liquidity conditions and concerns about increased government’s borrowing program for 2012-13 as announced in the Union Budget caused yields to harden towards end of Q4 of 2011-12. II.4.13 G-sec yields softened during April 2012 in response to cut in policy rates, easing of inflation and slowdown in industrial activity and exports. The yields, however, rose sharply after S&P downgraded India’s long-term rating outlook to negative towards end-April 2012. During 2012-13 (up to August 13), the Reserve Bank injected durable liquidity to the extent of `591 billion through OMO purchases in auctions and another around `222 billion through purchase of securities on the anonymous trading platform. The G-sec yields hardened after the Reserve Bank reduced the SLR by one per cent from 24 per cent to 23 per cent in the First Quarter Review of Monetary Policy 2012-13 (July 31, 2012). Box II.13 A combination of factors (both frictional and structural) led to a net tight liquidity position in the later part of 2011-12. As a measure to address the tight liquidity prevailing in the system since Q3 of 2011-12, the Reserve Bank conducted OMOs through both the auction and NDS-OM routes. Since the commencement of OMOs in November 2011, the Reserve Bank injected net durable liquidity of `1.35 trillion into the system during 2011-12 (Chart 1). OMOs and CRR cuts together helped ease the liquidity stress to a large extent. The objective of OMO purchases is liquidity management. The Reserve Bank’s OMO purchases, however, adds to the existing demand for G-secs, drives down yields and boosts trading volumes, thereby imparting liquidity to the G-sec market (Chart 2). The impact on yields, if any, is the result of the G-sec market demand -supply dynamics and may not be construed as a signal for monetary policy purposes.
Since liquidity injection of durable nature is the goal in conducting OMO auctions, the Reserve Bank has to identify an optimal mix of liquid and semi-liquid/illiquid securities. While the rationale for including semi-liquid/illiquid securities is to enhance their secondary market liquidity, the liquid securities are chosen to make the OMO successful. The liquid securities are often those with the least price risk and thus have a higher probability of success in the auctions. The downside to this arrangement is that it may reduce the availability of tradable stock of liquid securities and, if the supply is not commensurate with the purchases through OMOs, it may adversely impact the secondary market liquidity.
II.4.14 The daily average volume in the G-sec market, which stood at `105 billion during 2010-11, rose to around `130 billion in the year 2011-12. The daily average volume stood at `183 billion in Q1 of 2012-13. The volume generally varied inversely with the movement of the 10-year yield. Equity market indices reflected FII flows and macroeconomic developments II.4.15 In line with global markets, Indian equity prices continued their declining trend during most of 2011-12. After remaining weak for three quarters, the Indian equity market witnessed strong recovery in Q4 on the back of renewed FII support, moderation in inflation and firm trends in the global equity market. Overall, the Indian equity markets remained weak, owing to global developments, weak macroeconomic indicators and depreciation of rupee (Appendix Table No. 12). Two key Indian equity indices – the BSE Sensex and the S&P CNX Nifty - declined by 10.5 per cent and 9.2 per cent, respectively, during 2011-12 (Chart II.30). II.4.16 During 2012-13, the Indian equity market started on a subdued note on FII outflows, concerns over the low domestic growth, weak revenue outlook for major Indian IT companies and renewed euro area uncertainties. Investment sentiment was compounded by the downgrade of India’s long term rating outlook to negative from stable, worries over retrospective tax and general anti-avoidance rules (GAAR) and the rupee slide. However, in the later part of June 2012, following a pick-up in FII investment in the equity market, clarifications by the government on retrospective tax, GAAR and the government decision to boost investments in infrastructure, the market witnessed a turnaround. Growth enabling policy actions by AEs and also the European Council’s decision to support euro area sovereigns and banks also aided the market sentiments.
II.4.17 Nevertheless, during Q1 of 2012-13 both the BSE Sensex and the S&P CNX Nifty declined by 7.5 per cent and 6.5 per cent, respectively on y-o-y basis with FIIs and MFs having sold shares worth `6.6 billion and `6.4 billion, respectively in Q1 of 2012-13. However, in the Q2 of 2012-13 so far (up to August 13, 2012), FIIs bought shares worth `136.0 billion, while MFs sold shares worth `28.9 billion. In tandem the BSE Sensex and the S&P CNX Nifty recovered by 4.7 per cent and 5.4 per cent, respectively. II.4.18 The turnover in the Indian equity derivatives segment increased substantially over the year. Out of total derivatives turnover, the index options segment remained the highest contributor to the total derivative turnover (Chart II.30d, Appendix Table No. 13). Dormant primary markets largely reflect subdued sentiments II.4.19 Resource mobilisation in the primary segment of the domestic capital market was significantly lower (65.8 per cent) during 2011-12 over the previous year. Dampened secondary market conditions, and the poor performance of IPOs after their listing affected investor and promoter sentiment. Firms abstained from mobilising resources through public issues during October–January 2012 when investor risk appetite was low. There were no public issues in the primary market. However, during February–June 2012 the primary market witnessed a few issuances, indicating slow recovery. Overall, primary market sentiment remained subdued during the year so far. II.4.20 In any new project, equity capital is an essential component of total capital. In sluggish IPO market, it is very difficult to mobilise equity capital from public. Further, in the absence of equity capital, raising debt would be difficult for the firms which are already leveraged significantly. Hence, the sluggishness of IPO market could have contributed to the overall investment slowdown. II.4.21 During 2011-12, on the external front, resources mobilised through Euro issues were also sharply lower due to uncertain liquidity conditions in the European banking system on the back of the persistent euro area debt crisis. Exchange rate remained volatile, reflecting domestic and global concerns II.4.22 The currency market was under pressure during August–December 2011 due to a slowdown in capital inflows that reflected global uncertainty. However, conditions eased in Q4 of 2011-12, reflecting a pickup in capital inflows as well as the impact of policy measures undertaken to improve the dollar supply and contain speculation (Chart II.31). During 2011-12, the 6-, 30- and 36-currency trade weighted real effective exchange rates (REER) depreciated in the range of 7-8 per cent, primarily reflecting the nominal depreciation of the rupee against the US dollar by about 13 per cent (Appendix Table No. 14). II.4.23 During H1 of 2011-12, the turnover for currency futures showed a rising trend, but remained range bound thereafter. Housing prices remain firm II.4.24 Despite the hardening of mortgage rates, housing prices continue to remain firm at the aggregate national level. The Reserve Bank’s House Price Index (HPI), based on residential property prices for nine cities collected from the registration authorities of the respective state governments, increased during 2011-12 (average of four quarters) at all-India level and also in all the constituent cities, barring Chennai. Although House Transactions Volume Index declined during 2011- 12 (average of four quarters) at all-India level, significant acceleration is witnessed in case of Lucknow, Kolkata, Chennai, Jaipur and Kanpur (Chart II.32).
II.4.25 Over the last two years housing price inflation has ranged between 16 - 25 per cent during various quarters. Gold prices have increased at an even faster rate of 14 - 40 per cent. These two markets have not only provided effective inflation hedges, but also enabled savers to earn good real returns amidst high inflation. However, with housing and gold prices running ahead of inflation, there is a need for containing risks. In April 2012, the Reserve Bank took prudential measures on bank lending to NBFCS engaged in lending against gold. While credit to housing and commercial real estate has slowed down, a close vigil is still necessary as housing price inflation has not moderated. The Reserve Bank will continue to monitor the asset prices ahead from a macroprudential angle.
II.5 GOVERNMENT FINANCES Fiscal targets missed in 2011-12, with adverse impact on the macroeconomy II.5.1 The centre’s finances for 2011-12 experienced considerable slippage as key deficit indicators turned out to be much higher than budgeted due to shortfall in tax revenues and overshooting of expenditure (Appendix Table 15). This hampered return to the fiscal consolidation path and impacted the economy adversely. Current indications are that fiscal targets can again be missed in 2012-13, unless immediate remedial measures are undertaken. II.5.2 A host of factors, both domestic and external, contributed to the widening of deficit indicators. The firming up of international crude oil prices, the reduction in indirect taxes on petroleum products, shortfall in revenue due to more than anticipated slowdown in economic growth and lower than budgeted disinvestment receipts contributed to the fiscal slippage in 2011-12. Consequently, the gross fiscal deficit (GFD)-GDP ratio moved up to 5.8 per cent in 2011-12 compared to the budgeted ratio of 4.6 per cent, although some reduction in plan expenditure muted the extent of fiscal deterioration. Budgetary stance for 2012-13 and the mediumterm roadmap suggest fiscal consolidation ahead but risks remain II.5.3 The union budget for 2012-13 sets out a roadmap for fiscal consolidation by budgeting a significant reduction in the GFD-GDP ratio beginning from 2012-13 and continuing the process through further corrections in the revenue deficit (RD)-GDP and GFD-GDP ratios under the rolling targets for the next two years. The envisaged correction of 0.9 per cent in the RD-GDP ratio and 0.7 per cent in the GFD-GDP ratio during 2012-13 (BE) would increase the space for private sector credit in the economy. This is to be achieved through revenue enhancing (especially indirect tax measures and non-tax revenues through spectrum auction receipts) and expenditure control measures, viz., restricting expenditure on subsidies to below 2 per cent of GDP. The widening of the services tax base, and a partial rollback of crisis-related reductions in various indirect tax rates are expected to contribute to the tax receipts of the central government. There are risks to fiscal targets laid down for 2012-13, particularly if the envisaged tax buoyancies are not realised and the cap on subsidies is not adhered to. The medium-term fiscal roadmap in the union budget envisages a slower paced correction relative to the path prescribed by the Thirteenth Finance Commission (ThFC) (Chart II.33). During the first quarter of 2012-13, the fiscal deficit of the central government was more than one third of the budget estimate for the whole year.
II.5.4 The amendment of the FRBM Act 2003 which, inter alia, incorporates a “Medium-term Expenditure Framework Statement” (MEFS) is a significant initiative taken in 2012-13 towards fiscal consolidation. Under the amended FRBM Act, the government seeks to eliminate effective revenue deficit (which excludes grants for creation of capital assets from revenue expenditure) by 2014-15, thereby targeting correction in respect of the structural component of deficit in the revenue account. The MEFS would set out three-year rolling targets for expenditure indicators as part of the strategy to improve the quality of public expenditure management. II.5.5 Despite the widening of the centre’s fiscal imbalances during 2011-12, its debt-GDP ratio continued to decline from 52.8 per cent in 2010-11 to 51.9 per cent in 2011-12 (RE) due to high nominal growth rate of GDP. Excluding the amount not used for financing central government deficit, (viz., the component of the National Small Savings Fund that is invested in state governments’ securities and liabilities raised under the market stabilisation scheme), the outstanding liabilities- GDP ratio of the central government is budgeted to decline marginally to 45.5 per cent of GDP during 2012-13 from 45.7 per cent in 2011-12 (RE). II.5.6 As per the projections under the rolling targets, the outstanding liabilities-GDP ratio is expected to be lower than the ThFC’s recommended level of 44.8 per cent by 2014-15. However, a comprehensive analysis using various approaches is needed to assess the sustainability of central government debt over a longer term (Box II.14). Speedier implementation of tax reforms needed for recovery in tax-GDP ratio to pre-crisis levels II.5.7 During 2012-13, the government seeks to increase the tax-GDP ratio by 0.5 percentage point over 2011-12 (RE) to 10.6 per cent, through rollback of standard excise duty rates from 10 per cent to 12 per cent, widening of the service tax base and rationalisation of customs duty rates. The budgeted growth in gross tax revenues (19.5 per cent) is, however, placed below the average growth (23.6 per cent) recorded during the pre-crisis fiscal consolidation phase (2004-05 to 2007-08), thereby recognising the ongoing economic downturn. Although the budgeted growth in direct tax receipts, viz., corporation tax and income tax, is conservative, that for receipts from union excise and customs duties is substantially higher than the pre-crisis trend. This could be subject to downside risks emanating from the continuation of slowdown in industrial activity and international trade. II.5.8 Service tax rate has also been raised from 10 per cent to 12 per cent. The widening of the service tax base by including within its ambit all services other than those in the negative list, is a step in the right direction but it would necessitate careful implementation. Measures have also been taken to harmonise central excise and service taxes through the introduction of a common simplified registration form and a common return for both the taxes. Steps are being taken to operationalise Goods and Services Tax (GST) network to function as a ‘National Information Utility’ for the implementation of GST, as and when it is introduced. Despite these positive steps, there is a need to expedite the implementation of DTC and GST to enable the recovery of the tax-GDP ratio to precrisis level. Notably, the general government revenue-GDP ratio in India has been considerably below that in both advanced economies and emerging market economies and has been declining since 2007 (Chart II.34). Box II.14 Traditionally, fiscal sustainability is assessed in terms of indicator analysis. The standard approach to evaluate debt sustainability is by focusing on the ratio of the government debt to GDP. The debt is considered sustainable if the debt- GDP ratio is stable or declining over time while a continuous increase in this ratio is considered unsustainable. The assessment of the debt-GDP ratio depends on the real interest rate on the debt, the real growth rate of the economy, the ‘primary balance’ of the government budget (the surplus or deficit excluding interest payments), and the debt ratio in the previous period. Analysts also use this relationship to identify the primary surplus required to stabilise or reduce the debt in future. Several studies have approached the issue of debt sustainability by posing a specific question – “What is the threshold for debt beyond which its burden significantly affects capital accumulation and growth?” The debt sustainability framework was first developed by Domar (1944) which postulated the growth rate of income exceeding the interest rate as a necessary condition for sustainability. Domar showed that a constant overall deficit to GDP ratio ensured convergence of both the debt-GDP ratio and the interest-GDP ratio to finite values. The debate on sustainability took a new twist in the 1980s in connection with the growth of the public sector. In evaluating public finance sustainability it was no longer sufficient to examine the tax rate implications of a constant deficit à la Domar. It became necessary to estimate the future deficit path implied by current policies. Blanchard et al (1990) proposed two necessary conditions for sustainability: (a) the ratio of debt to GNP eventually converging back to its initial level (b) the present discounted value of the ratio of primary deficits to GNP being equal to the negative of the current level of debt to GNP. All three conditions (Domar and Blanchard et al) have been employed in empirical studies to assess the ‘sustainability’ of public finances. The sustainable level of public debt varies between countries depending on several economic and political features. It is usually higher for industrialised countries than for emerging market economies. The former have historically shown the capability to generate sufficiently large primary surpluses to ensure the sustainability of their debt even in adverse circumstances whereas the latter have generally not gained this credibility. This is due to, inter alia, weak revenue bases (with lower yields and higher volatility) and less effective expenditure control during economic upswings (this is particularly the case in Latin America). However, there are significant regional differences among emerging market economies, with Asian countries generally doing more to ensure debt sustainability than countries in other regions. The IMF has also developed a formal framework for conducting public and external debt sustainability analyses (DSAs) as a tool to better detect, prevent, and resolve potential crises. This framework became operational in 2002. The objective of the framework is three-fold: (i) assess the current debt situation, its maturity structure, whether it has fixed or floating rates, whether it is indexed, and by whom it is held; (ii) identify vulnerabilities in the debt structure or the policy framework far enough in advance so that policy corrections can be introduced before payment difficulties arise; (iii) in cases where such difficulties have emerged, or are about to emerge, examine the impact of alternative debtstabilising policy paths. The framework consists of two complementary components: the analysis of the sustainability of total public debt and that of total external debt. Each component includes a baseline scenario, based on a set of macroeconomic projections that articulate the government’s intended policies, with the main assumptions and parameters clearly laid out; and a series of sensitivity tests applied to the baseline scenario, providing a probabilistic upper bound for the debt dynamics under various assumptions regarding policy variables, macroeconomic developments, and financing costs. The paths of debt indicators under the baseline scenario and the stress tests allow an assessment regarding the vulnerability of a country to a payments crisis In the case of India, after a decade of large fiscal deficits, a rule-based fiscal framework, namely, the Fiscal Responsibility and Budget Management (FRBM) Act was enacted in 2003, with the objective of ensuring inter-generational equity in fiscal management and the fiscal sustainability necessary for longterm macroeconomic stability. The implementation of the FRBM Act coincided with a decline in the central government’s fiscal deficit by about 1.8 per cent of GDP between 2004-05 and 2007-08. The amended FRBM Act incorporates a Medium-term Expenditure Framework Statement to bring about an improvement in the quality of the expenditure. The FRBM Act, in its original as well as amended form, stipulates debt targets under the rolling targets framework. All state governments have passed their FRBM Acts, out of which 27 states have amended their FRBMs as recommended by the ThFC. Accordingly, states have set out targets for gradual reductions in their individual debt-GSDP ratio. In a recent study, Topalova and Nyberg suggested that a debt ratio in the range of 60-65 per cent of GDP by 2015-16 might be suitable/ sustainable for India. This is lower than the 67.8 per cent suggested by the ThFC by 2014-15. References: Blanchard, O., Jean-Claude Chouraqui, Robert P. Hagemann and Nicola Sartor (1990), “The Sustainability of Fiscal Policy: New Answers to Old Questions”, OECD Economic Studies, No. 15, Autumn. Buiter, W.H. (1985), “A Guide to Public Sector Debt and Deficits”, Economic Policy, Vol.1, No. 1, November. Domar, E.D. (1944), “The Burden of the Debt and the National Income”, American Economic Review, Vol. 34, No. 4, December. IMF (2003), “Public Debt in Emerging Markets”, World Economic Outlook, September. Topalova, P and Dan Nyberg (2010), “What Level of Public Debt could India Target?”, IMF Working Paper, WP/10/7, January. II.5.9 Another downside risk on the revenue front emanates from a possible shortfall in realising budgeted proceeds from disinvestment for 2012-13 as was the case in 2011-12 and in the past (Chart II.35). In view of the uncertainty in realisation of disinvestment proceeds, there is a need to assess the fiscal imbalances without reckoning proceeds available from disinvestment. Therefore, the ‘financing gap’, which excludes disinvestment receipts from the calculation of GFD, as used by the 2011-12 report of the Prime Minister’s Economic Advisory Council (PMEAC), becomes an important indicator for assessing the durable nature of government’s fiscal correction process (Chart II.36). This is also necessary, given the government’s objective of returning, by 2014-15, to the earlier policy of crediting disinvestment proceeds to the National Investment Fund rather than utilising them to finance budgetary expenditure (Box II.15).
Shift in budgeted expenditure towards capital outlays will materialise only through capping of expenditure on subsidies II.5.10 Revenue expenditure growth is budgeted to decline in 2012-13, while capital expenditure (both plan and non-plan components) is expected to increase sharply. However, for the government to contain its non-plan expenditure within the budget estimates for 2012-13, the commitment of capping expenditure on subsidies within 2 per cent of GDP should be adhered to. Credible fiscal consolidation accompanied by higher capital outlays is key to reviving investor sentiments and the economy. The budgeted shift in expenditure composition with higher allocations for capital expenditure augurs well for economic growth, given higher capital outlay multipliers (Box II.16).
Box II.15 A natural evolutionary process of a developing economy has generally involved sequential phasing out of the government from direct capital formation in the economy followed by a reduction in its stake in public sector undertakings (PSUs). This essentially reflects the need to provide for greater private sector participation for more efficient use of resources. The underlying objective of the divestment policy in India, which was part of the New Industrial Policy introduced in 1991, was to raise resources, encourage wider private participation and promote greater accountability of the PSUs. In the initial phase, select profit-making PSUs were to be divested. The Rangarajan Committee (1993) had recommended: (a) identifying select PSUs for disinvestment up to any level except in defence and atomic energy; (b) transparency in the disinvestment process with due protection of the rights of the workers; and (c) setting up an autonomous body for the smooth functioning and monitoring of the divestment programme. Accordingly, the Disinvestment Commission was constituted in 1996 to advise the government on the extent, mode, timing and pricing of divestment. It suggested four modes of divestment: (i) trade sale involving 100 per cent change of ownership through direct sale of shares at a fixed price; (ii) strategic sale involving sale of a substantial part of investment along with management control to private enterprise or individuals; (iii) offer of shares, implying sale of shares to individuals and companies and (iv) closure or sale of assets and liquidation of the company. In practice, the government has mostly resorted to the third mode of disinvestment, selling its shares in PSUs to minority shareholders. Divestment in PSUs is the main source of receipts under the head of non-debt capital receipts. The government has partially divested its stake in PSUs in the telecom, oil, energy, metals and minerals, automobiles and hospitality industries. During 2005-06 to 2008-09, the disinvestment proceeds were not used for financing budgetary expenditure but were credited to the National Investment Fund (NIF), constituted in 2005. The returns on investments from the NIF were treated as non-tax revenues to be used to finance expenditure on social infrastructure and provide capital to viable PSUs. In 2009-10, the government decided to use the divestment proceeds received during the three-year period, viz., 2009-12 to finance social sector programmes that create capital assets. Accordingly, disinvestment receipts were being used to partly meet expenditure on select flagship programmes related to rural employment, irrigation infrastructure, and urban and rural infrastructure. Also, the returns from the investments made earlier through the NIF continued to be employed to finance selected social sector schemes that promote education, health and employment and to meet the capital investment requirements of profitable and revivable PSUs. The government decided to continue the existing arrangement of using disinvestment proceeds to finance programme expenditure for 2012-13 and 2013-14. Notably, the realisation of projected disinvestment receipts is subject to market uncertainties. The government has not been able to achieve the budget estimates for disinvestment in 14 out of 21 years. Although the policy of reckoning disinvestment proceeds as a non-debt capital receipt to finance budgetary expenditure reduces fiscal deficit, it would be desirable that the government returns to the policy of crediting disinvestment proceeds to NIF, thereby making the process fiscal deficit neutral. References: Verma, A (2009), “Disinvestment Process in India”, Shodh, Samiksha aur Mulyankan, Vol. II, Issue-6 (Feb.09-April.09). Box II.16 Large scale fiscal stimulus provided to stimulate economic activity in various countries in the aftermath of the global financial crisis during 2007-2009 has renewed interest in the size of fiscal multipliers. Fiscal multipliers measure the responsiveness of output to changes in government spending or taxation. Conventionally, Keynesian theory shows higher multipliers for government spending relative to taxes since spending has a more immediate and direct impact on aggregate demand. Recent research, however, points to the possibility of higher size of tax multipliers as tax cuts can also stimulate investment demand, whether directly through investment tax credits or indirectly as a complement with higher demand for labour, over and above the Keynesian channel through increase in disposable income. In contrast, the fiscal multiplier is zero under Ricardian equivalence between taxes and debt in a dynamic framework. Ricardian consumers are forward-looking and fully aware of the government’s inter-temporal budget constraint. Empirical studies put forth a wide range of estimates for the fiscal multipliers for economies, ranging from negative to more than one (IMF, 2008), thereby failing to provide a clear guidance for the effectiveness of counter-cyclical fiscal policy. The effectiveness of counter-cyclical fiscal policy depends not only on the size of the stimulus but also its composition, i.e., the relative importance of tax cuts versus government spending. There is interplay of factors such as monetary stance, health of the banking sector, interest rate constrained by the zero lower bound problems, slack in labour market and level of public debt. Various studies have shown that fiscal multipliers are smaller for poorer economies, more open economies, economies with flexible exchange rates and economies with high public debt levels. Given that there are not too many studies quantifying the size of the fiscal multiplier for India, there is a need for one, particularly in the context of the post-crisis stimulus provided by the government which led to a considerable deviation of fiscal indicators from the targets envisaged under fiscal rules. An empirical exercise was undertaken for the period 1980-81 to 2010-11 to estimate the size of multipliers of various expenditure aggregates of combined government finances based on vector auto regression (VAR) frameworka. The VAR is estimated in growth rates using lags suggested by the Akaike Information Criteria. Various components of combined government expenditure (deflated by WPI), i.e., revenue expenditure, capital outlay, development expenditure, total expenditure and tax revenue have been used in alternative specifications to examine their impact on real GDP growth. The variables are then converted into growth rates so that the ratio of the impulse response of GDP to shock variables can be interpreted as elasticity. The short-term multiplier is then obtained by dividing the elasticity by the ratio of real spending to GDP. The long-term multipliers (in terms of GDP) are obtained by cumulating the impulse responses and dividing the total by the ratio of spending to GDP. Denoting GDP by Y and government expenditure by G, the elasticity is α = (ΔY/Y)/(ΔG/G), and, therefore, the multiplier is ΔY/ΔG = α / (G/Y). Among the endogenous variables, expenditure, GDP and tax variables are included while call money rate representing the monetary policy stance, trade openness and global GDP growth are treated as exogenous variables. The results are set out below:
The results show that GDP responds positively to a positive shock to combined government expenditure. In the case of revenue expenditure, the impact is high in the first year but fades out thereafter as expected. The capital outlay has a large long-term multiplier, reflecting its greater productivity in the long run compared with the short run, revealed by the low impact multiplier. The impact multiplier of aggregate expenditure is higher while its long run multiplier is low but positive. The composition of government expenditure which is tilted in favour of revenue expenditure can be regarded as the reason for this outcome. The above results show the criticality of re-orienting the expenditure composition of the government in favour of capital outlay to its pre-crisis average of 20.9 per cent (2003-08) to improve growth prospects in the long run (Chart).
References: Christiano, L., Martin Eichenbaum and Sergio Rebelo (2011), “When is the Government Spending Multiplier Large?” Journal of Political Economy, Vol. 119, No. 1, February. Ilzetzki, E, E.G. Mendoza and C.A.Végh (2011), “How Big (Small?) are Fiscal Multipliers?”, IMF Working Paper, WP/11/52, March. Romer, C.D and D. Romer (2007), “The Macroeconomic Effects of Tax Changes: Estimates based on a New Measure of Fiscal Shocks”, University of California, Berkeley, March. Spilimbergo, A. and others (2008), “Fiscal Policy for the Crisis,” IMF Staff Position Note, SPN/08/01, December 29. II.5.11 Undoubtedly, some subsidies for development purposes are inevitable but subsides which do not reach the intended beneficiaries or are not in tune with the macroeconomic fundamentals should be rationalised. The capping of subsidies coupled with better targeting of beneficiaries is a positive step. The achievement of this objective would necessitate steps to allow the pass-through of international crude oil and fertiliser prices to domestic prices. The budgeted reduction in expenditure on subsidies is mainly due to a decline of over 36 per cent in the petroleum subsidy in 2012- 13 over 2011-12 (RE) (Chart II.37). The compensation to oil marketing companies (OMCs) for underrecoveries budgeted at `400 billion for 2012-13 would be inadequate, taking into account the spillover of petroleum subsidy payments for the last quarter of 2011-12 and the delay in the deregulation of administered prices, particularly diesel. Increasing dependence on market borrowing for financing fiscal deficit necessitates appropriate monetary management II.5.12 The fiscal deficit financing pattern for 2012- 13 shows continued reliance on market borrowings (96 per cent of GFD), though the recourse to shortterm financing through treasury bills is budgeted at 2 per cent, significantly lower than the 22 per cent in 2011-12. The government expects inflows in small savings during 2012-13 after the outflows experienced in 2011-12. The envisaged market borrowings by the government for 2012-13 will have to be managed appropriately to avoid crowding out of private investment. It may also be noted that revenue receipts falling short of targets would entail higher market borrowings which, in turn, could limit the space for monetary policy to respond to the slowdown in growth.
Higher than budgeted development expenditure by the states augurs well for their economies II.5.13 The consolidated position of state governments shows that revenue surplus, at 0.1 per cent of GDP during 2011-12 (RE), was lower than that budgeted for the year due to higher revenue expenditure, which more than offset the increase in revenue receipts. Within revenue receipts, both tax revenues and current transfers from the centre were higher than the budget estimates, the latter on account of higher tax devolution from the centre. Despite moderation in economic growth, higher own tax revenues reflected better than budgeted own tax buoyancies, aided in large part by higher VAT/sales tax collections on petroleum products. On the expenditure side, the increase was on account of development expenditure. Nevertheless, 20 states showed a revenue surplus during 2011-12 (RE), with the surpluses of nine states higher than that budgeted for the year. II.5.14 The consolidated GFD-GDP ratio for the states during 2011-12 (RE) was higher than the budget estimates mainly due to the decline in the revenue surplus, even though the capital outlay- GDP ratio was lower than its budgeted level (Appendix Table 16). State-wise data indicates that GFD-GSDP ratios were higher than the budget estimates and the ThFC targets in sixteen and seven states, respectively. Development expenditure including social sector expenditure was higher than the budgeted level. States likely to remain in fiscal consolidation mode in 2012-13, but development and social sector expenditure as ratio to GDP budgeted to decline II.5.15 Key deficit indicators of the states are budgeted to show improvement during 2012-13. The consolidated revenue surplus is budgeted to increase due to an increase in revenue receipts coupled with a reduction in revenue expenditure. Both own revenues and current transfers from the centre are budgeted to increase during 2012-13. The revenue surplus is expected to not only provide resources for increased capital outlay during 2012- 13 but would also enable a reduction in GFD-GDP ratio. State-wise data shows that the ThFC target for GFD-GSDP ratio is budgeted to be met by 26 of the 28 states. The envisaged expenditure pattern of states shows that, while the committed expenditure-GDP ratio (comprising interest payments, administrative services and pensions) is budgeted to increase, the development expenditure and social sector expenditure as ratios to GDP are budgeted to decline during 2012-13. While pursuing the fiscal consolidation agenda further, it would be important to take steps to reduce committed expenditures to free more resources for development, social and capital expenditures. Pressures on state finances emerging from state power distribution utilities II.5.16 A growing area of concern for the states is the significant increase in financial losses of state power distribution utilities (SPDUs) which cast a burden on the finances of state governments. Accordingly, structural reforms are needed to improve the efficiency and viability of these SPDUs, which would have a bearing on the finances of the states. While the revenue accounts of several state governments continue to record surpluses, this needs to be seen in the light of mounting losses in the SPDUs. Besides budgetary support to the SPDUs through subsidies, grants, loans and equity investments, the states also extend guarantees for loans taken by the power utilities from banks and financial institutions. Although guarantees are in the nature of contingent liabilities and may not have a direct impact on the finances of the states, defaults in the loans, if any, can invoke the state guarantees. This would adversely impact the state government finances (Box II.17). Rationalisation of power tariffs and reduction in distribution losses could be critical in bringing about stability in the finances of SPDUs. Box II.17 The fiscal position of the states in terms of key deficits and debt as ratios to GDP has shown improvement in recent years. This, however, may not be as encouraging as it appears if the liabilities of the state public sector undertakings (SPSUs) and contingent liabilities arising out of assistance to them are taken into consideration. Studies have pointed out examples of the financial position of the overall public sector changing due to bailouts of financial and non-financial entities in both the private and the public sector. Although contingent liabilities do not form part of the states’ debt obligations, in the event of default by borrowing entities, the states are required to meet the debt service obligations of these defaulting entities. Therefore, contingent liabilities assume importance in the analysis of public finances of the state governments. In 2001, the Reserve Bank constituted a working group to assess the fiscal risk of state government guarantees. Recognising that a major constraint in analysing the true fiscal position of states was the absence of a consistent and standard pattern of reporting data on guarantees in the state budgets, the group recommended a uniform format to regularly publish data regarding guarantees in the budget. An internal working group on “Information on state government guaranteed advances and bonds” set up in the Reserve Bank in 2003 emphasised that transparency in information disclosure was crucial to enhance market discipline and proper rating of projects guaranteed by the state governments. With an increase in fiscal transparency at the state government level, particularly after the enactment of the respective FRBM Acts, 20 of the 28 states are providing information on contingent liabilities such as outstanding guarantees in their budget documents (statements under fiscal responsibility legislation). However, only 14 states publish it in the prescribed format, of which nine provide information on outstanding riskweighted guarantees. The consolidated outstanding guarantees by state governments as a proportion of GDP increased from 6.1 per cent in 1990-91 to 8.0 per cent in 2003-04 but declined thereafter to 2.8 per cent as at end-March 2010. As per latest available information, outstanding guarantees for 14 states amounted to `1.3 trillion as at end-March 2011. In view of the fiscal implications of guarantees, many states have taken initiatives to place ceilings (statutory or administrative) on guarantees. To contain the fiscal risks associated with the guarantees, Guarantee Redemption Funds have been set up by 10 states. Although there has been a decline in the total outstanding guarantees extended by state governments, an increase in the share of guarantees to financially ailing SPSUs is an area of concern. Moreover, contingent liabilities of the state governments could be much higher than is evident from their budget documents/finance accounts, if the ‘letters of comfort’ extended to SPSUs, including power utilities, are included. Another form of contingent liabilities relates to public private partnership (PPP) at the state government level. The ThFC noted that there are explicit and implicit obligations for the public entity involved in PPP projects. While explicit contingent liabilities in the form of stipulated annuity payments over a multi-year horizon may be spelt out, implicit contingent liabilities are obligations to compensate the private sector partners for contingencies such as changes in specifications, breach of obligations and early termination of contracts, which may be difficult to quantify. As recommended by the ThFC for the central government, there is also a need for the states to quantify expenditure obligations relating to PPP projects in their medium-term fiscal policy statements, with an increasing number of them adopting the PPP mode of project implementation. The governments of Karnataka and Tamil Nadu have included a statement on ‘Liabilities in Public Private Partnership’ in their budget documents for 2012-13. References Cebotari, A. (2008), “Contingent Liabilities: Issues and Practice”, IMF Working Paper, WP/08/245, October. IMF (2007), “Manual on Fiscal Transparency”. Reserve Bank of India (2002), “Report of the Working Group to Assess the Fiscal Risk of State Government Guarantees”, July. II.5.17 The deviation in the deficit indicators of the central government from the envisaged fiscal consolidation path during 2011-12 was partly contributed by the slowdown in economy which impacted government revenues. The substantial increase in subsidies during 2011-12 on account of high crude oil prices further impacted the deficit of the government. For a credible fiscal consolidation strategy, steps need to be initiated to control subsidies by de-regulating prices of administered petroleum products and fertilisers, re-orienting government expenditure in favour of capital expenditure and speeding up tax reforms to improve overall tax efficiency. Containing the fiscal deficit is necessary for both external stability as well as improving the efficacy of monetary policy. II.6 EXTERNAL SECTOR Deterioration in external sector during 2011-12 caused concern II.6.1 The year 2011-12, especially the second half, was characterised by a burgeoning current account deficit (CAD), subdued equity inflows, depletion of foreign exchange reserves, rising external debt and deteriorating international investment position. These indicators reflect the weakening external sector resilience and thus, present a formidable challenge for policy makers. II.6.2 After a marked deterioration in Q3 of 2011-12, India’s BoP witnessed further stress in Q4, belying the seasonal pattern generally observed in form of lower current account deficit (CAD) in the last quarter . Sharper deceleration in export growth than import growth led to higher trade deficit. This coupled with deceleration in growth of net services exports further widened the CAD-GDP ratio to 4.5 per cent in Q4, taking the full year ratio to an all time high of 4.2 per cent. This has been much higher than the sustainable level of CAD which is assessed to be around 2.5 per cent of GDP with slower growth. This was also reflected in drawdown of foreign exchange reserves during Q4 of 2011-12 as net inflows under capital and finance account were less than adequate to finance CAD. II.6.3 Going forward, the moderation in global oil prices from the earlier highs and some softening in gold imports if sustained, are likely to have a favourable impact on CAD. Notwithstanding these factors, CAD may still stay wide enough to put strains, especially if capital inflows remain moderate. Risks to India’s balance of payments remain from weaker global growth prospects, including that in the US, euro area and China, slowdown in global trade and renewed risk aversion arising from the sovereign debt crisis. II.6.4 The emergence of external sector weakness during 2011-12 was caused by several factors, both domestic and global. The US dollar appreciated against all major currencies, except the yen. Consequently the Indian rupee, as also many other emerging market currencies, came under considerable pressure. Global commodity prices, especially those of oil and gold, rose. As India’s demand for these commodities is relatively inelastic in nature, the current account widened sharply. At the same time, the rising fiscal deficit boosted private consumption with a spill over to increased import demand. While investment climate deteriorated, so did saving, keeping the CAD wide. As a combined impact of these factors, financing of wider CAD became more difficult. This also brought rupee exchange rate under pressure. Furthermore, high domestic inflation led to inflation differential that also contributed to a weaker currency. II.6.5 Weakening global economic and financial conditions had adverse spillover impact on India’s external sector in 2011-12. Moderate growth in merchandise exports, coupled with robust import growth, widened the trade deficit by 3 percentage points of GDP to an all-time high of 10.0 per cent of GDP in 2011-12. This alongwith sluggish growth in invisibles caused CAD to rise above 4 per cent of GDP. This level of CAD was markedly higher than the CAD/GDP ratio of 3.1 per cent during 1966-67 and 3.0 per cent in 1990-91; the two occasions when the country confronted balance of payments crisis. This time around, the economy weathered the external sector shock without any payments crisis due to better access to international capital markets and exchange rate flexibility. High level of reserves acted as insurance against speculative attacks and possible capital flights and the reserves loss was contained by exchange rate adjustment. II.6.6 The global financial uncertainty resulted in reduced risk appetite and led to volatile and reduced capital flows to Emerging and Developing Economies (EDEs) beginning third quarter of 2011-12. With moderation in the capital flows, CAD was financed partly by drawing down the foreign exchange reserves. Increase in external debt, contributed by a marked increase in commercial borrowings, export credits and short-term debt further led to a deterioration of external sector vulnerability indicators during 2011-12. India’s trade performance was subdued due to slowdown in exports and imports remaining sticky II.6.7 Subdued growth conditions in advanced economies began to weaken external demand for exports from emerging market economies in the latter half of 2011-12. India’s export growth also showed concomitant moderation (Chart II.38, Appendix Table 17). Trade diversification benefits were also restricted by spillovers that shrunk EME’s trade. After recording an average monthly growth rate of 41.0 per cent in the first half of the year, export growth lost its momentum and grew by about 7.6 per cent in the second half of 2011-12. The overall export growth at 21.3 per cent in 2011-12 was nearly of half of that recorded in 2010-11. In contrast, import growth was higher in 2011-12 mainly on account of import of POL and gold & silver.
II.6.8 Despite sharp increases in the international prices of crude oil and gold & silver, their import grew significantly in 2011-12, accounting for 43.1 per cent of merchandise imports (Box II.18). The increasing oil intensity of the economy (7.0 per cent of GDP during 2008-12 compared with 4.7 per cent during 2003-07) is reflected in the 35 per cent growth in quantum of net POL imports during 2008-12 over 2003-07. The moderation in non-oil non-gold import growth in 2011-12 may be due to the economic slowdown and the impact of rupee depreciation in the second half of 2011-12. Subdued global growth prospects also impacted the imports of export related items since the beginning of 2011- 12. Growth in import of export related items was mainly affected due to contraction in imports of pearl and precious/semi precious stones and decelerated growth in imports of chemicals. However, the import growth in bulk items and capital goods imports increased in 2011-12. Capital goods imports seem to be substituting domestic production of capital goods, which showed a decline of 4.0 per cent in 2011-12. Box II.18 According to the latest World Gold Council release, inspite of a 17 per cent year-on-year fall in gold consumption, India remained the largest consumer of gold in the world, followed by China. Based on the DGCI&S data, India’s gold import is estimated to have grown by 39 per cent during 2011-12. According to the World Gold Council, India’s quantum of gold imports accounted for a quarter of the world demand in 2011-12. Over the past decade India witnessed, on an average, an annual growth of 29 per cent and 18 per cent in gold consumption and gold price respectively, outpacing country’s real GDP growth and inflation. During 2008-09 to 2011-12, on average, the quantum of gold imports grew by 12 per cent as compared to a decline of 5 per cent during 2005-06 to 2007-08. Large gold imports reduce the availability of foreign exchange reserves for other imports (including raw material, intermediates and capital equipment) that may have better productivity usage (Vaidyanathan, 1999). During the recent period gold imports in terms of value as well as in quantity witnessed a sharp rise despite the increase in gold prices (Chart a). India’s import of gold is on account of domestic consumption/ investment as well as gold re-exports in the form of jewellery. Based on past trends of gold import content in total gems and jewellery exports, it is estimated that gold re-export was around US$ 7 billion in 2011-12. Increase in domestic demand for gold in India has stayed strong in view of its characteristic as a safe investment asset that has given good returns, while at the same time serving as a consumption asset that meets the demand for jewellery. Higher real rate of return on gold investment vis-à-vis alternative modes of investments, viz., bank deposits and the stock market seems to have boosted gold investment by domestic residents. Further, various schemes mooted by banks to promote gold as an investment asset among individuals is adding to the demand for gold. In the past 11 years, gold has given a compounded annual return of 18.5 per cent per annum.
NBFCs have also promoted gold investments in several ways. Gold demand picked up because of easy availability of gold loans by NBFCs. To examine the trends in demand for gold loans and its impact on gold imports, the Reserve Bank set up a Working Group on Gold Loans by NBFCs in April 2012. The high level of gold import observed during the recent past has become an acute problem in recent times especially against the backdrop of deterioration in the overall external situation. The price inelastic nature exhibited by gold imports in the recent period has put considerable strain on the trade balance and CAD. If the trade balance is adjusted by excluding oil and gold imports, trade deficit would be significantly lower for the last four years (Chart b). Further, the diversion of household financial saving to investment in gold may have impacted the growth of term deposits in recent years (16.7 per cent in 2009-10 to 2011-12 as against 23.1 per cent in 2006-07 to 2008-09). Since such investments in gold do not contribute to capital formation, they are likely to have implications for overall investment and economic growth. There are very few systematic studies on the sensitivity of demand for gold. Sarma et al. (1992) identified gold price, rural surplus, rural income distribution, unaccounted income/ wealth generated mainly in the service sector, rate of return on alternative financing assets and the general price level affecting gold demand in India. Vaidyanathan (1999) found that the price of gold relative to share prices and international gold prices was an important determinant of gold imports. An empirical analysis using annual data for the period 1998-2012 indicates that real per capita income growth and inflation are the major determinants of gold import in India. The positive and statistically significant coefficient of WPIinflation possibly indicates that gold may also have been used as a hedge against inflation in India. The regression results do not find support for the negative price-quantity demand relationship, as the coefficient of gold prices was found to be statistically insignificant at the conventional levels. This result is, however, in line with the trend suggested by Chart-a. It is possible that despite high prices, the demand for gold picked up after 2007-08 as a response to macroeconomic uncertainties, especially as retail investors tend to view investments in gold as a safe haven.
Several policy measures have been taken recently to curb gold imports. The government increased the basic customs duty on standard gold imports from 2 per cent to 4 per cent and on non-standard gold from 5 per cent to 10 per cent. Similarly, recognising the rapid increase in exposure of NBFC’s to gold loans, the Reserve Bank introduced prudential measures that prescribe NBFCs to maintain a loan-to-value ratio not exceeding 60 per cent for loans granted against the collateral of gold jewellery and disclose in their balance sheet the percentage of such loans to their total assets. References: Sarma, A, A. Vasudevan, K. Sabhapathy and Mohua Roy (1992), “Gold Mobilisation as an Instrument of External Adjustment”, DRG Study No.3, Reserve Bank of India, April. Vaidyanathan, A. (1999), “Consumption of Gold in India”, Economic and Political Weekly, February. World Gold Council (2011), Quarterly Gold Demand Trends (available on http:www.gold.org). II.6.9 The exports recorded a decline of 5.1 per cent to US$ 97.6 billion during 2012-13 so far (April- July) as compared with US$ 102.8 billion in the corresponding period of the preceding year largely reflecting the prolonged slowdown in euro area, as also lower growth in US and other emerging market economies. The labour intensive sectors like handicrafts, textiles and gems and jewellery were assessed to be affected severely by the slowdown. Imports also declined by 6.5 per cent to US$ 153.2 billion during the same period from US$ 163.8 billion in the comparable period of previous year mainly reflecting lower domestic demand coupled with subdued exports as some imports are used as inputs in the exports related industries. Going forward, the measures announced by the government in June 2012 in terms of interest subvention and other sector-specific incentives will have an impact on the export performance with a lag. India’s trade exposure to euro area is limited II.6.10 The five troubled euro area countries – Greece, Portugal, Spain, Ireland and Italy – together account for less than 3.5 per cent of India’s exports and 1.7 per cent of India’s imports. However, global developments during the third quarter of 2011-12 renewed fears that the euro area crisis would escalate. The impact was evident in EDEs including India, though the pattern of spillovers varied across economies depending on the strength of trade and financial linkages, and euro area bank exposures. Reflecting the export diversification policy efforts by the government, the share of developing economies in India’s total exports has shown a gradual increase in recent years. However, as the sluggish economic conditions in advanced economies gradually spilled over to other EDEs, export diversification efforts did not yield results similar to those seen in previous years. Destination-wise, moderation in India’s export growth during 2011-12 was significant in the case of OPEC economies, European Union and other developing economies, particularly the newly emerging destinations of African and Latin American economies. Global Trade Alert data suggest that protectionist actions announced across advanced and emerging market economies in the third quarter of 2011 were as high as in the worst period of 2009. Recognising the concerns relating to moderation in export growth, the government announced various export boosting measures in June 2012 that inter alia include extension of interest subvention and Zero Duty Export Promotion Capital Goods (EPCGs) scheme up to March 2013 and increased coverage under the Focus Market Scheme (FMS), Special FMS Scheme and Focus Product Scheme. Financing of CAD posed concerns in the second half of 2011-12 II.6.11 The increase in India’s CAD in 2011-12 has been largely on account of the worsening trade balance (Appendix Table 18). The merchandise trade deficit was at a historic high of 10.0 per cent of GDP in 2011-12. The trade deficit-led CAD was comfortably financed in the first half, as capital inflows exhibited an uptrend, mainly on account of robust FDI inflows and a rise in external commercial borrowings (ECBs) and trade credit (Appendix Table 19). In the third quarter of 2011-12, however, not only was the CAD significantly higher but capital inflows also moderated as growing global uncertainties impacted the risk appetite of global investors. During 2011-12, CAD was 70.1 per cent higher than the level during 2010-11 (Chart II.39). II.6.12 On a cumulative basis, CAD stood at 4.2 per cent of GDP during 2011-12. Growth in net services exports was too moderate to fully offset the adverse impact of the high trade deficit on CAD during 2011-12. Growth in exports of services moderated at 7.1 per cent during 2011-12 as against 34.4 per cent during 2010-11 while imports of services declined by 7.3 per cent as against an increase of 39.4 per cent during 2010-11. Despite the slowdown in major export markets, software services receipts, accounting for around 44 per cent of total services exports, continued to show higher growth (Chart II.40).
Capital inflows moderated in Q2 and Q3 but recovered in Q4 II.6.13 The pattern of capital inflows showed a significant variation during 2011-12 (Chart II.41). Net inflows under the capital and financial account (bifurcation of the erstwhile capital account of Balance of Payments under IMF’s sixth edition of Balance of Payment Manual) were buoyant in Q1. Even though moderation in capital inflows began in Q2, it became more pronounced in Q3, mainly led by lower portfolio inflows and net repayments under trade credit. Increased repatriation of inward FDI and higher repayments of overseas borrowings also led to greater outflows. Moderation in capital inflows necessitated the drawdown of foreign exchange reserves to meet the financing needs of CAD in Q3 (Appendix Table 20). Due to a significant drawdown in Q3, the level of foreign exchange reserves (including valuation) declined from US$ 304.8 billion at end-March 2011 to US$ 294.4 billion at end-March 2012.
Deteriorating international investment position and rising short-term debt remain a policy concern II.6.14 Various policy measures that were undertaken against the backdrop of deteriorating global financial conditions and India’s external situation during the course of the year stimulated debt creating flows in the form of investments by FIIs in debt instruments, NRI deposits and external commercial borrowings. Even though such flows augured well for financing of CAD, their implications were evident in the form of India’s rising external debt. External commercial borrowings, NRI deposits and trade credit together accounted for 77 per cent of the rise in total external debt at end-March 2012 over the level of end-March 2011 (Appendix Table 21). II.6.15 With increasing recourse to debt flows and drawdown of reserves to finance CAD, various external sector vulnerability indicators showed considerable deterioration during 2011-12. The reserve cover of imports, the ratio of short-term debt to total external debt, the ratio of foreign exchange reserves to total debt, and the debt service ratio deteriorated during the year (Chart II.42). India’s net international investment position also weakened during 2011-12. Need to augment non-debt creating flows II.6.16 In view of the higher dependence on debt flows to finance the CAD during 2011-12, there is a need for policy initiatives to augment non-debt creating flows to keep composition of India’s external liabilities at a comfortable level. In this context, apart from insurance, reforms in the pension sectors are necessary. There is a need to further improve FDI inflows in sectors such as insurance, retail, aviation and urban infrastructure.
II.6.17 In this context, the proposal relating to further liberalisation of the Indian organised retail sector by allowing up to 51 per cent of FDI in multibrand retail and no limits for FDI in single-brand retail was intensively debated during 2011-12. Though the proposal in respect of multi-brand retail has been kept in abeyance following lack of consensus amongst various stakeholders, the government in January 2012 raised the FDI limit in single-brand retailing under the government approval route from 51 per cent to 100 per cent. Apprehensions in case of FDI in multi-brand retailing mainly stem from possible predatory pricing or below-the-cost pricing that can be afforded by large retail chains. Such pricing behaviour can drive out existing small kirana stores and end up with creation of monopolistic power in the absence of these small stores. These apprehensions contrast with the international experience that on the whole suggests that allowing FDI in retailing space leads to increased competition. Empirical evidence also suggests that increased competition in retail space results in lower prices which improves consumer welfare, benefitting low income households the most. The FDI in retail may be particularly helpful in improving supply chain management through greater investment in backend infrastructure, including cold storage for farm and poultry products. Several countries in east Asia have benefitted from FDI in retailing over past two decades. Retailing and wholesaling has also emerged as a major sector of FDI inflows in China. II.6.18 In recent years, outward FDI has increased significantly in line with the trend observed in many other emerging markets. The stock of outward FDI from India reached US$ 112 billion at the end of 2011-12. While, these investments generate benefits in terms of enhanced competitiveness and market access, there is a need to balance the domestic investment interests in the overall FDI policy. Moreover, exponential rise in issuance of guarantees by the Indian companies towards their joint ventures/wholly owned subsidiaries abroad could be a potential concern for banks and for the companies themselves. This needs to be closely monitored. Rupee depreciation driven by global currency movements, domestic macroeconomic weakness II.6.19 After being largely range bound in the first four months of the financial year 2011-12, rupee depreciated by about 17 per cent during August to mid-December of 2011 reflecting global uncertainties and domestic macro-economic weakness. The S&P’s sovereign rating downgrade of the US economy, deepening euro area crisis and lack of credible resolution mechanisms led to reduced risk appetite in global financial markets and a flight to US dollar considered as a safe asset by investors. With US dollar appreciating as a result, most currencies with a notable exception of yen came under pressure (Chart II.43). In general, current account deficit countries witnessed sharper depreciation as compared to current account surplus countries, with the exception of Russia. II.6.20 Considering the excessive pressures in the currency markets, the Reserve Bank intervened in the foreign exchange market through dollar sale. It also took several capital account measures to stabilise rupee that included deregulation of interest rates on rupee denominated NRI deposits and enhancing the all-in-cost ceiling for ECBs with average maturity of 3-5 years. The lock-in period of long-term infrastructure bonds for FIIs (up to US$ 5 billion within the overall ceiling of US$ 25 billion) was reduced to one year, and ceilings for FIIs in government securities and corporate bonds were raised by US$ 5 billion each to US$ 20 billion and US$ 45 billion respectively.
II.6.21 Consequent upon the series of measures undertaken to improve dollar supply in the foreign exchange market as also to curb speculation, the rupee appreciated by 11 per cent by early February 2012, before weakening again by over 13 per cent by end-May 2012. II.6.22 The renewed pressure on rupee was mainly due to widening trade deficit, drying up of capital flows, particularly FII flows and apprehension about the exit of Greece from the euro (Chart II.44). In order to improve the inflows as also to reduce the volatility in the rupee, the Reserve Bank took additional measures in May and June 2012. The measures in May 2012 included increase in interest rate ceiling on FCNR(B) deposits, deregulation of ceiling on interest rate for export credit in foreign currency, and requirement to convert 50 per cent of the balances in the EEFC accounts to rupee balances.
II.6.23 In June 2012, additional measures were taken in consultation with the government which included, inter alia, allowing ECB for Indian companies for repayment of outstanding rupee loans towards capital expenditure under the approval route, enhancing the limit for FII investment in G-secs by US$ 5 billion to US$ 20 billion, allowing Qualified Foreign Investors (QFIs) to invest in mutual funds that hold at least 25 per cent of their assets in infrastructure under the sub-limit for investment in such mutual funds and broadening the investor base for G-Secs to include certain long term investor classes that include Sovereign Wealth Funds, insurance funds and pension funds. Notwithstanding these measures, during 2012-13 so far (August 14, 2012) rupee depreciated by 8.1 per cent. The REER based on 6-, 30-, and 36- currency baskets also depreciated (Appendix Table 13). India’s foreign exchange reserves contract II.6.24 The level of reserves moderated during 2011-12 as there was heavy drawdown in the second half of 2011-12. The ratio of foreign exchange reserves to debt also declined. Nonetheless, in terms of adequacy of reserves, India continues to be in comfort zone going by the various alternative norms. In terms of traditional indicators, reserve cover for imports at 7.1 months against the rule of thumb of 3 month imports is comfortable. Likewise, the level of reserves to short-term debt at 377 per cent is much more than the level of 100 per cent as prescribed under the Greenspan-Guidotti rule. In its April 2012 Staff Report, the IMF noted that India’s reserve coverage is adequate (1.8 times of the 2011 gross external financing requirement) and external debt, which has remained at about 20 per cent of GDP and compares well with other major emerging markets. II.6.25 Going forward, the weaker rupee, supplemented by other necessary policy responses can help contain the current account deficit. The external sector scenario, however, needs continuous monitoring so that growth in imports of price insensitive items such as oil and gold, does not impinge upon the trade deficit and CAD stays within the sustainable range and does not act as a drag on India’s forex reserves. There is a need for more prudent macroeconomic and external sector policies to keep external sector risks at bay in the near term. This is especially so because debt creating flows have increased over the years, making the economy more vulnerable to external shocks. Since global economic and financial conditions remain highly uncertain, there is no room for complacency. Policymakers need to address vulnerabilities emerging from rising imbalances in India’s trade and current account and also create a policy and business environment that boost confidence among foreign investors. 1 Despite well-known limitations, expenditure-side GDP data are being used as proxies for components of aggregate demand. 2 Basic goods are bulk raw material/product used for further production of new items in manufacturing and agriculture. Intermediate goods are goods/products produced as incomplete product or which go as inputs in production for further finishing. a Taking cognisance of the fact that, the state governments account for a significant portion of aggregate government spending in India, the VAR exercise uses combined capital expenditure and taxes as fiscal variables for India. |
|||||||||||||||||||||||||||||||||||||||||||||||||||||||||||||||||||||||||||||||||||||||||||||||||||||||||||||||||||||||||||||||||||||||||||||||||||||||||||||||||||||||||||||||||||||||||||||||||||||||||||||||||||||||||||||||||||||||||||||||||||||||||||||||||||||||||||||||||||||||||||||||||||||||||||||||||||||||||||||||||||||||||||||||||||||||||||||||||||||||||||||||||||||||||||||||||||||||||||||||||||||||||||||||||||||||||||||||||||||||||||||||||||||||||||||||||||||||||||||||||||||||||||||||||||||||||||||||||||||||||||||||||||||||||||||||||||||||||||||||||||||
Page Last Updated on:


