 IST,
IST,
Chapter II : Financial Institutions: Soundness and Resilience
| Commercial banks in India are well regulated. The Indian banking system has several inherent strengths, the most
important being that the banks are well capitalised both in terms of quantity and quality of capital. Their funding
structure is stable as they are largely reliant on domestic retail deposits. Their assets are well diversified and leverage
is low. Despite these strengths, the Indian banking system faces certain headwinds. A slowing economy has raised the
extent of delinquencies in a short period of time. However, profitability has been sustained in recent quarters. Deposit
growth has lagged credit expansion for several quarters now and the composition of outside liabilities has been shifting
toward big ticket short term deposits from corporate and high net worth individuals, exposing the banks to liquidity
stress as it increases reliance on wholesale sources of funds. However, the resilience of the banking system to credit,
interest rate, equity and foreign exchange shocks remain satisfactory.
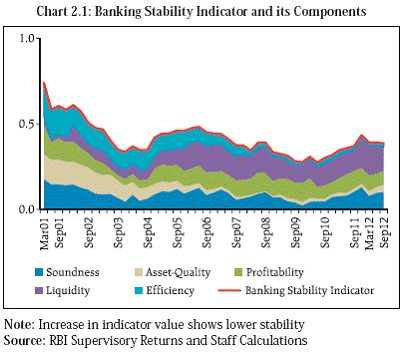
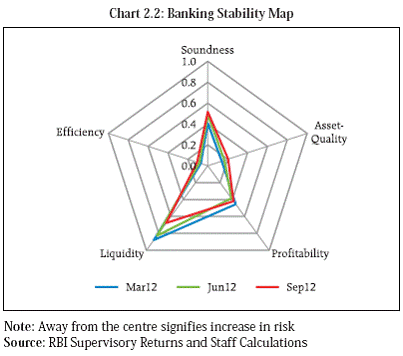
The financial performance of non-banking financial companies and urban cooperative banks has been improving over the years and their leverage as well as maturity mismatches are being monitored. The inter-linkages among these diverse sectors of the financial system are strong implying that the interconnectedness of the domestic financial system will have to be closely monitored. Risks to the Banking Sector 2.1 The risks to banking sector have been increasing in recent years. The Banking Stability Indicator1 (Chart 2.1) suggests a continued deterioration in the stability of the banking sector since 2010 with the aggregate risks remaining at an elevated level during the year. An analysis of the components contributing to banking stability show that tight liquidity, deteriorating asset quality and reducing soundness are the major contributors to the decline in stability of the banking system. However, a marginal improvement in the indicator during the last two quarters is observed primarily because of better liquidity condition, due to regulatory prescriptions and enhanced profitability ratios, arising out of lower provisioning coverage (discussed in para 2.71). 2.2 The Banking Stability Map, which reflects the relative changes in the vulnerabilities since the previous FSR, further reveals that the asset quality and soundness indicators have deteriorated vis-à-vis their position in March 2012, while the liquidity indicators show some improvement as at the end of September 2012, the profitability indicators in the current quarter, though better than March 2012, show marginal deterioration as compare to June 2012 (Chart 2.2).
Distress Dependencies and Inter-connectedness - An Analysis Banking Stability Measures (BSMs) 2.3 The FSR has been publishing the Banking Stability Measures since June 2011. These measures take into account distress dependence among the banks in a system, thereby providing a set of tools to measure (i) common distress of the banks in a system, (ii) distress between specific banks, and (iii) distress in the system associated with a specific bank. These distress dependencies are modelled by conceptualising the financial system as a portfolio of a specific group of banks (Segoviano and Goodhart, 2009). In particular, the Banking System’s Portfolio Multivariate Density (BSMD)2, which characterises both the individual and joint asset value movements of the portfolio of banks, is estimated from Probabilities of Distress (PoDs)3 of the banks4, observed empirically based on 99 per cent Value at Risk (VaR) of daily banks’ equity price return. The BSMD embeds the banks’ distress inter-dependence structure that captures linear and non-linear distress dependencies among the banks in the system and its changes at different times of the economic cycle. During times of distress, the financial position of banks worsens concurrently through direct or indirect links with the economy and markets on account of fall in asset values, interbank lending and information asymmetries. The banking stability measures show early signs of easing in distress-dependencies among banks. Common distress in the system: JPoD and BSI 2.4 The probability of distress of the entire banking system, as measured by Joint Probability of Distress (JPoD) seems to have reversed its upward trend and registered a marginal decline in the recent period (since November 2012). The Banking Stability Index (BSI), which measures the expected number of banks which could become distressed given that at least one bank becomes distressed also registered a similar movement of JPoD (Chart 2.3).
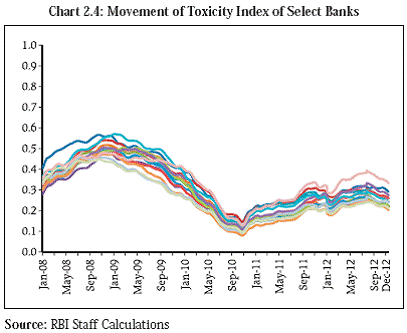
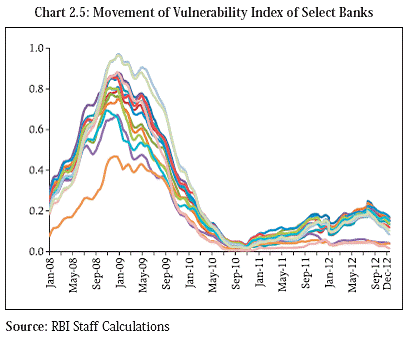
Distress between specific banks: Toxicity and Vulnerability Indices 2.5 The distress between specific banks is measured by Toxicity and Vulnerability Indices. The Toxicity Index (TI) is the average probability that a bank under distress may cause distress to another bank in the system. Toxicity of banks, which was rising since beginning of 2010, has shown some decline since October 2012. At present, the TI of the selected banks is hovering around 0.25 (Chart 2.4). 2.6 Vulnerability Index (VI), which quantifies the average probability of a bank being in distress given distress in the other banks in the system, was high during the recent financial crisis. The highest probability was about 0.9 per cent during the crisis, which declined significantly to close to zero. During the recent period, the VI of the selected banks is hovering around 0.15 (Chart 2.5). Distress in the system associated with a specific bank: Cascade Effect 2.7 The probability that at least one bank becomes distressed, given that a specific bank becomes distressed, characterises the likelihood that one or more banks, in the system become distressed. This measure quantifies the potential ‘cascade’ effects in the system given distress in a specific bank, which reflects the systemic importance of a specific bank. Though these conditional probabilities do not imply causation; these can provide important insights into systemic inter-linkages among the banks comprising the system. The cascade probabilities show that the Indian banking system is highly interlinked and had a high distress dependency during the financial crisis period. The effect came was down in 2010, but shows an increasing trend since beginning of 2011 (Chart 2.6).
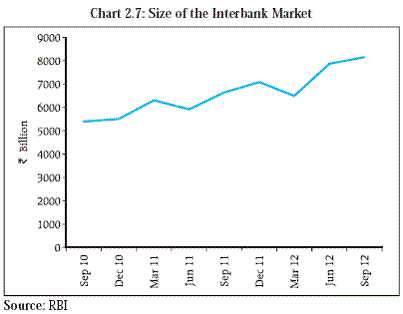
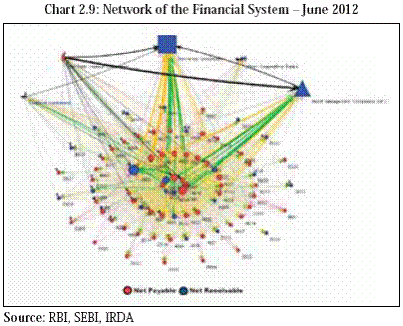
Network Analysis 2.8 The tools of network analysis are used to assess the interconnectedness in the financial sector and the contagion risks arising from the failure of one or more financial institutions5. The analysis finds that the inter linkages in the Indian financial system are strong. In the event of failure of a financial institution, risks are posed to other financial institutions which have exposures to the failing institutions. Entities which have lent to the failing institution face solvency risks while entities which have borrowed from the failing institution face liquidity risks. The greater the degree of interconnectedness in the financial system, higher is the risk of contagion posed by a failing financial institution. These risks are being monitored on a quarterly basis and have not changed significantly over the last two years. 2.9 The Indian interbank market has grown consistently over the last two years (Chart 2.7). The public sector banks continue to have the largest share in this market (Table 2.1). 2.10 The network of the banking system continued to display a distinct tiered structure. Three to four banks have consistently featured in the inner core over the last two years (September 2010 to September 2012), of which, two banks are large net borrowers. The network of the entire financial system also remained tiered (Charts 2.8 and 2.9).
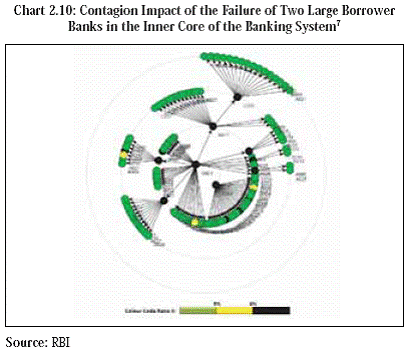
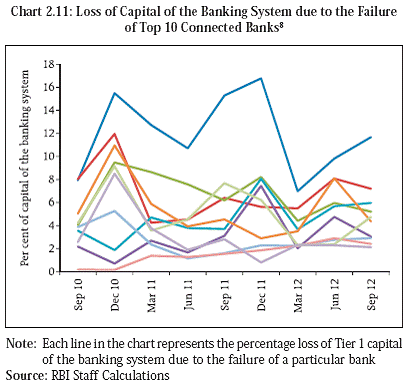
Risks of Contagion 2.11 The previous paragraph referred to two large borrower banks which have remained in the inner core of the network of the banking system consistently over the last two years. An assessment of the contagion impact of the simultaneous failure of these banks indicate that they would trigger the failure of nine other banks and result in a loss of over 18 per cent of the Tier 1 capital of the banking system (Chart 2.10). 2.12 An analysis of the potential contagion loss which could be caused by the ten most connected banks on different dates between September 2010 and September 2012 showed that the maximum loss caused by the failure of any one of the above banks ranged between 7 per cent and 17 per cent of the total Tier 1 capital funds of the banking system. The analysis further showed that the bank causing the maximum contagion loss remained the same over the period. The average loss to the Tier 1 capital funds of the banking system caused by the failure of any one of the 10 banks ranged from about 4 per cent to over 7 per cent with a peak loss of 7.3 per cent in December 2010. These trends indicate that the interconnectedness of the banking system of the country will need to be continuously monitored (Chart 2.11). Contagion risks for different levels of loss given default 9 2.13 The contagion analysis conducted so far (in previous paragraphs and in earlier FSRs) has taken into consideration netted bilateral exposures between banks. Ideally, such analysis should consider gross exposures multiplied by the loss given default (LGD) which will give the exact amount of the loss incurred by a creditor bank due to the failure of the debtor bank. LGDs vary between 100 per cent (equivalent to a zero recovery rate for the creditor) and 0 per cent (in the event that an exposure is fully collateralised and there is no loss to the creditor).
2.14 However, information about recovery rates and associated LGDs are not readily available. LGD depends, among others, on the type and amount of collateral as well as the type of borrower and the expected proceeds from the work out (e.g. proceeds from sale of collateral/ securities) of the assets. Also, LGD is exposure specific i.e., different exposures to the same borrower may have different LGDs. In the Indian context, the information gaps are further accentuated by the fact that bankruptcy laws are not clear and because there have been no major instances of bank failures to provide empirical guidance on potential LGDs. 2.15 An assessment of contagion losses caused by the five most connected banks (as on September 30, 2012) for different levels of LGDs indicates that below a certain threshold (60 per cent), contagion losses are very low. Beyond that threshold, however, contagion losses increase sharply (Chart 2.12). 2.16 Guidelines issued by the Reserve Bank for the implementation of the internal rating based (IRB) approaches for calculation of capital charge for credit risk10 indicate an LGD of 65 per cent and 75 per cent for unsecured and non-recognised collateralised exposures, respectively, (based on their seniority) for banks migrating to the foundation IRB approach. Banks which seek to migrate to the advanced IRB approach will need to provide their own estimates of LGDs. As banks migrate to the IRB approaches, assessment of LGDs can be expected to improve leading to more precise assessment of contagion risks. Impact of distress conditions in the banking system on contagion risks 2.17 The contagion impact of the failure of a bank is likely to be magnified if the failure takes place in a situation of generalised distress or shock to the banking system. To assess the impact of distress conditions on contagion risks, four different shocks relating to interest rate and foreign exchange risks were considered (the shocks used are the same as those used for stress testing the derivatives portfolio of banks, as described in paras 2.67 and 2.68).
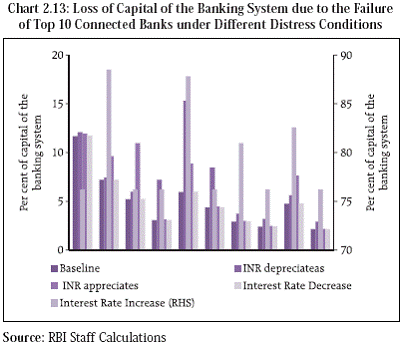
2.18 The sensitivity analysis was conducted for both the balance sheet and the derivatives portfolio of banks. The impact of the market movements on capital was factored in before assessing the contagion loss. The exercise revealed that movements in the US$/INR exchange rate in both directions increased contagion losses. In case of interest rate shocks, a reduction in interest rate did not have any impact on contagion losses. The impact on contagion loss was maximum in case of a sharp increase in interest rates (Table 2.2 and Chart 2.13). Liquidity contagion using network analysis 2.19 The financial crisis highlighted the importance of sound liquidity risk management by banks and other financial institutions and the need to address systemic liquidity risk. It highlighted the fact that failure of one or more institutions could result in multiple institutions facing simultaneous difficulties in rolling over their short-term debts or in obtaining new short-term funding. The network model can be used to capture the contagion risks posed to the liquidity of the banking system in case of failure of a large lender. 2.20 Failure of a bank affects both its lenders and borrowers leading to solvency risk, on the one hand, and liquidity risk, on the other. Liquidity risk is posed to the banks who have borrowed funds from the failing bank as these banks will need to replace the funds borrowed. 2.21 A bank will typically maintain liquidity buffers to tide over emergencies. These buffers comprise excess CRR and SLR securities. The bank can also access unavailed standing facilities extended to it by the central bank. If these funds are not sufficient, the bank may be able to call in short term lending to its counterparties. In the eventuality that the bank’s liquidity buffers and callable assets are not sufficient to meet the liquidity shock caused by the failing bank, the bank itself may have to be liquidated. If the borrower bank is forced to call back its short term lending, the bank may itself transmit a liquidity shock to its borrowers, who will, in turn, need to find alternative funding sources. This iterative process continues till no further loans need to be called back and hence no shock is transmitted. This process is illustrated in the Chart 2.14.
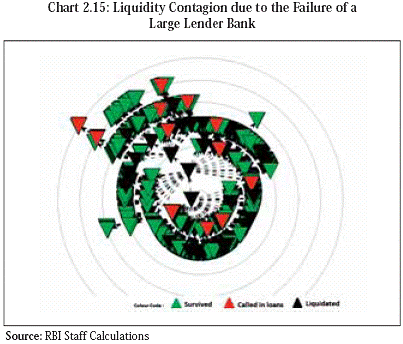
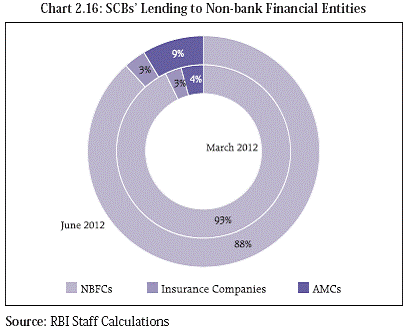
2.22 An assessment of the impact of the liquidity contagion in the Indian banking system indicates that the failure of the large lenders in the system could have a significant downstream impact on the availability of liquidity in the system and could also cause a few other banks to be, in turn, liquidated (Table 2.3). The impact is alleviated to some extent if banks are in a position to call in short term interbank loans. 2.23 The liquidity contagion caused by the failure of the largest lender bank in the system as on June 30, 2012 is represented in a stylised chart (Chart 2.15). The black triangle in the centre represents the lender bank which is liquidated for some exogenous reason. Banks which have borrowed from the liquidated bank will need to replace these borrowings. In some cases, the liquidity buffers of the banks are sufficient to absorb the liquidity shock (banks represented by green triangles). In some other cases, banks survive by using their buffers and calling in short term inter-bank loans (banks represented by orange triangles). These banks will, however, also propagate the liquidity shock in the process of calling in loans. For some banks, the buffers and short term inter-bank loans will not be sufficient to replace the funds borrowed from the trigger bank. These banks will, in turn, be liquidated (banks represented by black triangles) and will restart the next round of liquidity contagion. The contagion stops when no further banks are liquidated. Linkages between Banking and Non-Banking Sectors 2.24 As is the case globally, the financial system in India is also interconnected. Both funding dependencies and direct credit exposures exist between banks, on the one hand, and insurance companies, mutual funds and non-banking financial companies (NBFCs), on the other. While the banking sector is a net lender to the NBFC sector, it is a net borrower vis-à-vis the insurance companies and asset management companies (AMCs) (Charts 2.16 and 2.17).
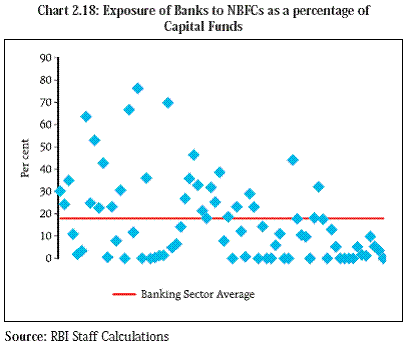
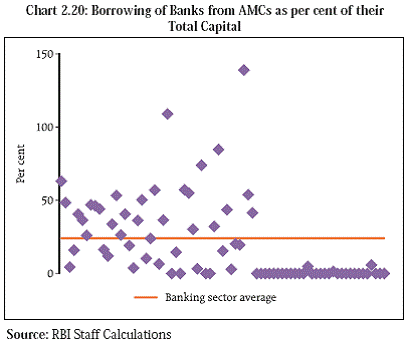
2.25 The average banking sector exposure to NBFCs as a percentage of capital funds stood at 18 per cent as at end June 2012. However, the exposures were significant in the case of a few banks with the exposure of 5 banks (comprising 8.7 per cent of banking sector assets) to NBFCs being in excess of 50 per cent of their capital funds (Chart 2.18). 2.26 Insurance Companies are also interconnected with the banking system as major lenders to banks which means that insurance companies could be adversely affected in case of any major distress in the banking sector (Chart 2.19). 2.27 The NBFC sector was significantly dependant on the banking system for their funding needs12. For the selected sample, on an average, borrowings from SCBs comprised over 100 per cent of the capital funds for the NBFC sector. The dependency was higher in case of a few companies for which the ratio was in excess of 200 per cent. 2.28 Some outlier banks were significantly dependent on mutual funds for their funding needs though for the banking sector on an average, borrowings from mutual funds constituted only about 20 per cent of their capital funds. However, as discussed in the previous FSR, the borrowing of banks from mutual funds was primarily short term which could leave the banks with a potential liquidity risk in case of any stress in the mutual fund industry (Chart 2.20).
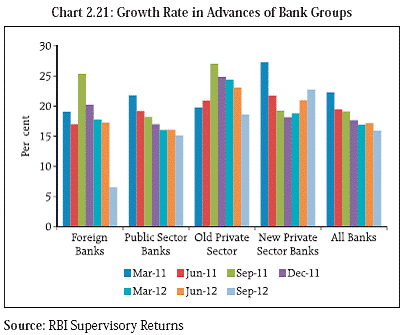
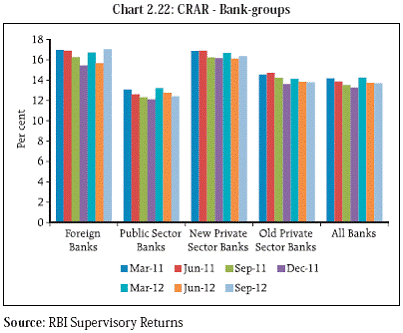
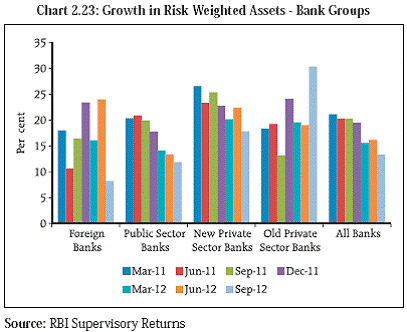
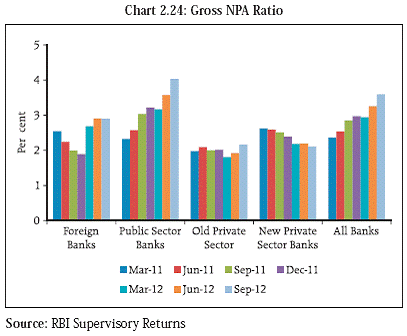
Soundness and Resilience Scheduled Commercial Banks (SCBs) Balance Sheet Size and Structure 2.29 Total bank credit grew at 15.9 per cent, while total deposits growth was 14.3 per cent as at end September 2012 (Y-o-Y). Despite faster credit growth relative to deposit expansion, the Credit-Deposit (C-D) ratio has declined to 74.4 per cent as at end September 2012 from 76.0 per cent as at end March 2012. The incremental C-D ratio has also declined during the half year since March 2012, indicating the trend that banks have deployed a greater share of incremental deposits in investments and other assets. 2.30 The steepest fall in growth rate of gross advances (y-o-y) as at end-September 2012 from the previous quarter was for the foreign banks; from 17.3 per cent to 6.5 per cent, followed by old private sector banks from 23.1 per cent to 18.6 per cent. There was moderate fall in the growth rate of advances for the public sector banks to 15.0 per cent, while the new private sector banks had a slight increase in the growth rate of advances at 22.7 per cent (Chart 2.21). Capital to risk weighted assets ratio (CRAR) 2.31 The overall capital adequacy ratio (CRAR) has deteriorated since March 2012 though it remained well above the regulatory minimum. The decline in CRAR was observed to be more pronounced for the public sector banks (Chart 2.22). The growth in risk weighted assets of the foreign banks was lower over the period under reference, partly explaining the improvement in their CRAR position (Chart 2.23). Credit risk Asset Quality 2.32 The asset quality of banks has seen considerable deterioration during the half year ended September 2012. Gross non-performing advances (GNPA) ratio for all banks rose sharply to 3.6 per cent as at end September 2012 from 2.9 per cent as at end March 2012. Net NPA ratio stood at 1.7 per cent as at end September 2012, as against 1.2 per cent as at end March 2012. Among the bank groups, the public sector banks witnessed a high degree of deterioration in asset quality (Chart 2.24).
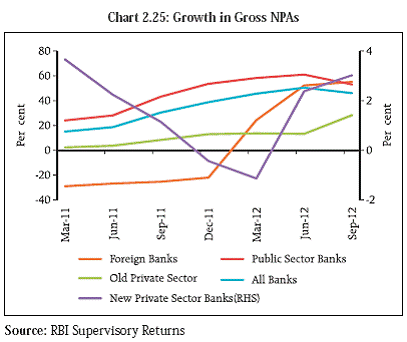
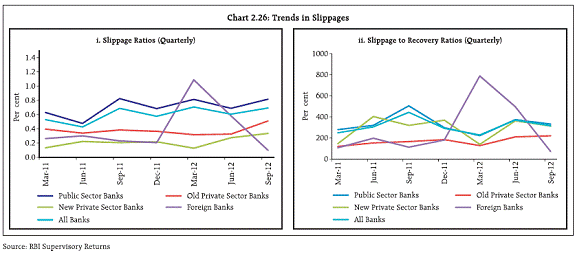
2.33 The growth rate of GNPAs at 45.7 per cent (y-o-y) as at end September 2012 outpaced that of gross advances during same period, highlighting the rising concerns on asset quality (Chart 2.25). 2.34 The concerns on asset quality are also underscored by the increasing trend in the slippage ratio as well as ratio of slippages to actual recoveries (excluding upgradations). Except for foreign banks, these ratios increased for all bank groups since March 2011. However, slippage to recovery ratio for all the bank groups improved marginally during the quarter ended September 2012 (Chart 2.26 (i) and (ii)). With the growth rate in GNPAs continuing to tread well above the credit growth and movements in slippages remaining upward, the profitability of banks may come under pressure in the coming quarters.
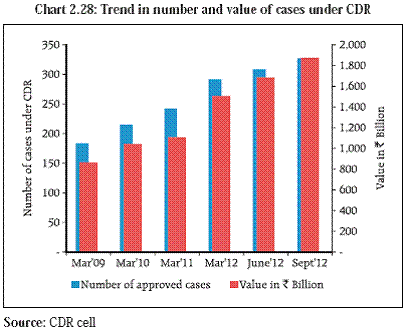
Restructuring of advances 2.35 Restructuring of loans (Box 2.1), particularly of big ticket loans under the corporate debt restructuring (CDR) mechanism, has recently come under closer scrutiny due to the steep rise in the number and value of such advances (Chart 2.27 and 2.28). 2.36 Between March 2009 and March 2012, while total gross advances of the banking system grew by less than 20 per cent (compound annual growth rate), the restructured standard advances grew by over 40 per cent. The proportion of restructured standard advances to gross total advances increased from 3.5 per cent in March 2011 to 4.7 per cent in March 2012. This has further increased to 5.9 per cent as at the end of September 2012. Box 2.1: Restructuring of Advances Restructuring is an accepted practice worldwide through which lenders nurture problematic, but viable borrowal accounts. It is a legitimate strategy adopted by lenders and borrowers especially during times of distress to preserve the economic value of the viable loan accounts. Restructuring has been followed in India for many years and the guidelines in this regard have evolved over a period taking into account international best practices, status of development of financial markets and changing economic conditions. The extant restructuring guidelines cover three broad categories (i) large corporate advances with multiple/consortium banking under Corporate Debt Restructuring (CDR), (ii) SME Debt restructuring mechanism and (iii) Restructuring of other advances. This system has fulfilled its objective to a large extent. These guidelines on restructuring have evolved in the context of international experience. It is a fact that restructuring of advances across the banking sector has increased during the current financial year as also during the last financial year. This is a matter of concern. As regards restructuring under CDR mechanism, this has also been in line with increase in non-CDR restructuring. According to data furnished by CDR Cell, there has been a spurt in the number of cases referred to CDR Cell from the year 2011-12 onwards. As against 49 cases involving `226.2 billion referred during 2010-11, 87 cases involving `678.9 billion were referred during 2011-12. During the period April - August of the current year, there are 59 cases involving `306.4 billion being referred to CDR. The reasons for rise in restructuring may be attributed to the effects of global recession coupled with internal factors like domestic slow down, which have played a significant role in the deterioration in asset quality. Aggressive lending by banks in the past, banks not exercising oversight on diversification into non-core areas by companies, banks not enforcing discipline on companies regarding unhedged forex exposures and delay in disbursements are areas on which banks ought to exercise much better control. Delay in administrative clearances is an equally important reason for pressure on asset quality which needs correction. The spurt in restructuring of advances is a matter of concern, though it may not have systemic dimension. The Reserve Bank is closely monitoring the position. Some course correction at the level of all stake holders may definitely improve the situation. With a view to reviewing existing guidelines on restructuring of advances and suggest revisions taking into account the best international practices and accounting standards, the Reserve Bank had constituted a Working Group (WG) under the chairmanship of Shri B. Mahapatra, Executive Director, Reserve Bank of India. The WG has examined the issues and its major recommendations can be summarised as below:
Second Quarter Review of Monetary Policy 2012-13 on October 30, 2012 has announced an increase in the provision for restructured standard accounts from the existing 2.0 per cent to 2.75 per cent in line with a major recommendation of the WG. It has also been announced that draft guidelines on the subject taking into account the recommendations of the WG as also the comments received in this regard will be issued by end-January 2013.
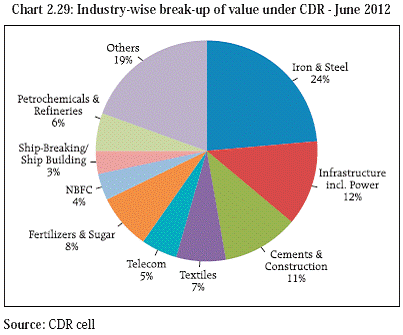
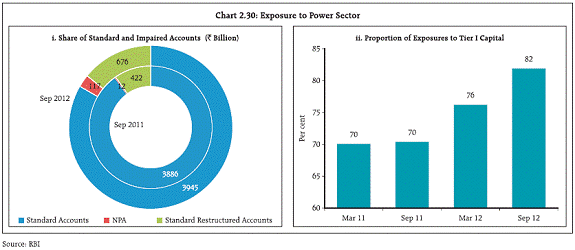
2.37 Some industrial sectors like iron & steel, infrastructure and textile experienced a much greater degree of restructuring of advances in the recent period (chart 2.29). Credit Risk to Power Sector 2.38 The risks faced by banks in lending to the power sector were highlighted in the previous FSR. Pressure on asset quality in the power sector has worsened since then. Impairments have risen in the preceding year ending September 2012 (Chart 2.30(i)). Instances of restructuring too have registered a steep increase in the recent quarters. The large exposure to this sector remains an area of concern for banks (Charts 2.30(ii)).
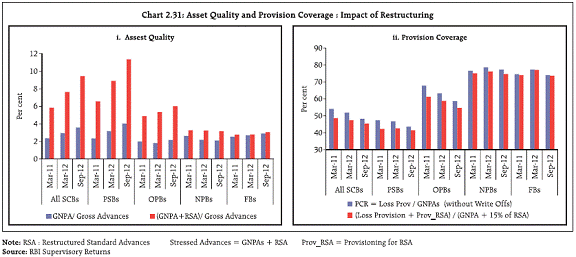
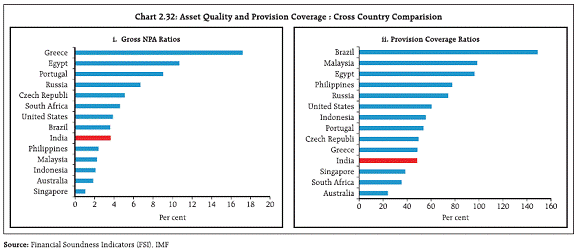
Assessment of Provision Coverage 2.39 An analysis of provision coverage of SCBs was attempted in the context of recent spurt in the NPAs. The impairment levels in Indian banks compare favourably with those of global banks. However, the provision coverage ratio is relatively lower and has also shown a declining trend in recent quarters. In view of this, it may be advisable for banks to increase their provisioning levels (Chart 2.31 and Chart 2.32) Credit Risk- Stress Testing using Sensitivity Analysis 2.40 Sensitivity analysis or single factor stress tests13 were conducted on the banking system’s credit portfolios using different scenarios14. The results show that the banking system would be resilient to various stress scenarios (Table 2.4).
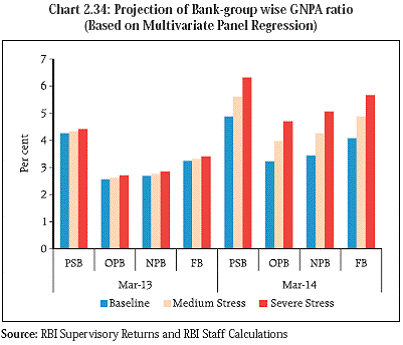
Macro Stress Test - Credit Risk 2.41 In order to test the resilience of the Indian banking system against macroeconomic shocks, a series of macro stress tests at system, bank-group and sectoral level were performed using times series econometric tools15. 2.42 The macro stress tests encompass a series of risk scenarios incorporating a baseline and two adverse macroeconomic scenarios representing medium and severe risk (Table 2.5). The adverse scenarios were derived based on up to 1 standard deviation for medium risk and 1.25 to 2.0 standard deviation for severe risk (10 years historical data). System Level Credit Risk 2.43 The macro stress test suggests that, if the current adverse macroeconomic condition persists, the system level GNPA ratios could rise from 3.6 per cent as at the end of September 2012 to 4.0 per cent by end March 2013 and 4.4 per cent by end March 2014. The GNPA ratio could go up to 4.8 per cent and 7.6 per cent under the severe risk scenario in the respective periods. Under the severe stress scenario, the system level CRAR of SCBs could decline to 10.9 per cent by March 2014, which is still above the regulatory requirement of 9 per cent (Table 2.6 and Chart 2.33). Bank Group Level Credit Risk 2.44 Among the four bank-groups, namely, public sector banks (PSB), old private banks (OPB), new private banks(NPB) and foreign banks(FB), PSBs might continue to register highest GNPA ratio. Under baseline scenario, the GNPA ratio of PSBs may rise to 4.3 per cent by March 2013 from 4.0 per cent of September 2012. Whereas, GNPA ratios of OPB, NPB and FB may rise to 2.6 per cent, 2.7 per cent and 3.2 per cent by March 2013 from the 2.2 per cent, 2.1 per cent and 2.9 per cent of September 2012, respectively (Chart 2.34).
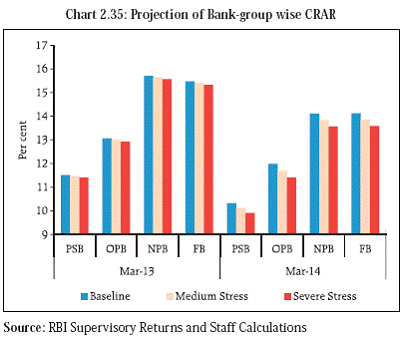
2.45 Among the bank-groups, PSBs are expected to register lowest CRAR followed by the old private sector banks. Under severe stress scenario, the CRAR of PSBs may decline to 11.4 per cent and 9.9 per cent by March 2013 and March 2014, respectively, which is still above than the regulatory requirement of 9 per cent (Chart 2.35). Sectoral Credit Risk 2.46 Macro stress test of sectoral credit risk revealed that among the selected seven sectors, Agriculture is expected register highest NPA at 5.8 per cent by March 2013, followed by Engineering, Iron & Steel and Construction. However, the adverse macroeconomic shocks seem to have maximum impact on Engineering and Iron & Steel (Table 2.7). Concentration Risk 2.47 Banks’ total credit (funded plus non-funded) exposures (TCE) to individual large borrowers (top 20) shows that the concentration of exposure reduced both in terms of per cent of capital fund as well as gross advances. While the TCE as per cent of capital fund declined from 186.9 per cent at end Mar-10 to 167.4 per cent by end Jun-12, the TCE as percent of gross advances declined from 32.8 to 27.8 per cent during the same period (Table 2.8).
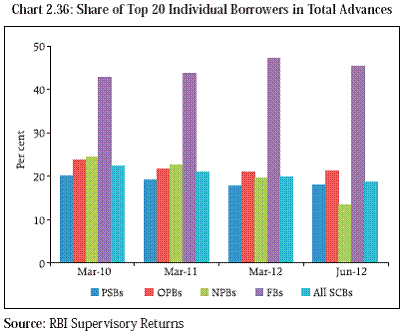
2.48 Share of banks’ funded exposure to their top 20 individual borrowers in banks’ total gross advances declined from 22.0 per cent as at end March 2010 to 18.5 per cent by end June 2012, at system level (Chart 2.36). In respect of banks groups, the concentration has been quite high for foreign banks, which may be because of their limited customer/borrower base. Further, the concentration declined in the case of NPBs during the 1st quarter of FY 2012-13. 2.49 The stress tests on concentration risk of SCBs show that the impact under various stress scenarios are not significant. The share of top three borrowers to the total credit is about 8.0 per cent (at system level). There is a regulatory cap imposed on banks on their credit exposures to individual and group borrowers. The exposure ceiling limit is 15 percent of capital funds in case of a single borrower and 40 percent of capital funds in the case of a borrower group. The reduction in CRAR under the assumed scenario of default of top three individual borrowers would be 240 basis points and the system should be able to withstand this default. However, at individual level, a few banks with high concentration might be seriously impacted under stressed conditions. Liquidity Risk 2.50 The liquidity position of banks has improved over the last six months, reflecting the effect of the reduction in the CRR and SLR. The ratio of liquid assets to total assets has increased from 28.9 per cent as at end March 2012 to 30.1 per cent at end September 2012. 2.51 A detailed analysis of the ‘quality’ of liquidity is captured by the liquidity ratios (Table 2.9). The ratio of volatile liabilities to earning assets, (with both numerator and denominator adjusted for temporary assets) measures the extent to which banks’ basic earning assets are funded by less stable sources of funds. This ratio was 40.9 per cent as on September 2010 and has steadily increased to 43.9 percent as at end September 2012, which points towards banks increasingly resorting to short term bulk deposits. 2.52 The ratio of loans including mandatory cash reserves and statutory liquidity investments to total assets has decreased from 82.4 per cent in September 2010 to around 60 percent over the period of last two years, partly reflecting the decrease in statutory reserve ratios over the period of last two years. The decreased ratio although reflecting the slowdown in credit growth also indicates that ‘illiquidity’ embedded in the balance sheet has come down. The ratio in terms of core deposits has moved from 1.6 in September 2010 to 1.2 as at September 2012 indicating a decrease in purchased liquidity.
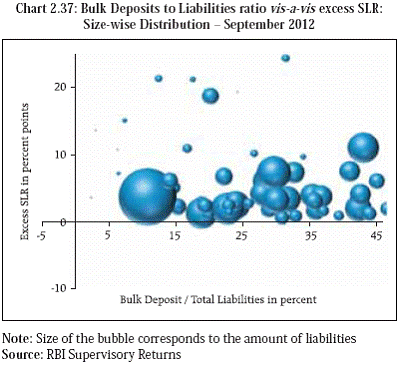
Bulk Deposits 2.53 Retail deposits (Current Account, Savings and Term deposits) are inherently more stable as they are diversified and less prone to premature withdrawal. A few public sector banks continued to display a high degree of reliance on ‘bulk’ deposits (i.e. deposits of `10 million and above for the analysis). In some cases the bulk deposits constituted more than 50 per cent of the total liabilities as at end September 2012. Excess SLR securities holdings constitute a bulwark against runs on banks relying on such wholesale sources of funds. Position in respect of bulk deposits and the mitigant in the form of excess SLR holdings is presented in Chart 2.37. 2.54 According to bank group classification, the proportion of the bulk deposits in total deposits remained high for foreign banks, though there has been slight decline in the last six months. The proportion of the bulk deposits in total deposits has shown signs of stabilising after increasing in last few quarters for the public sector banks. Since term deposits can be withdrawn prematurely17, such bulk deposits remain prone to withdrawal and/ or non-rollover, posing liquidity risks to the banks relying on such deposits. While a higher proportion of bulk deposits and borrowings in total liabilities of banks make them vulnerable to liquidity shocks, the proportion of their investments in liquid government securities acts as a mitigating factor. 2.55 Deposit growth of banks has been lagging loan growth for several quarters. This exposes the banks to liquidity stresses as it increases reliance on wholesale sources of funds. In order to boost retail deposits growth, certain product innovations like variable rate deposits could be considered (Box 2.2).
Box 2.2: Variable Rate Deposits RBI allowed commercial banks to fix their own interest rates on domestic term deposits of various maturities with the prior approval of their respective Board of Directors/Asset Liability Management Committee (ALCO), effective October 22, 1997. The Annual Monetary and Credit Policy for the year 2002-03 had noted the following: “The average cost of deposits for major banks continues to be relatively high. Further, a substantial portion of deposits is in the form of long-term deposits at fixed interest rates. Thus, flexibility available to banks to reduce interest rates in the short-run, without adversely affecting their return on assets, is limited.” The Policy document, accordingly, favoured introduction of flexible interest rate deposits with reset at six-monthly intervals where the interest rate could be higher or lower vis-à-vis the fixed rate deposit for similar maturity depending on banks’ perception regarding inflation and the interest rate outlook over the longer period. Furthermore, banks were also urged to devise schemes for encouraging depositors to convert their existing long-term fixed rate past deposits into variable rate deposits. Commercial banks could consider paying the depositors at the contracted rate for the period of deposit already run and waive the penalty for premature withdrawal if the same deposit is renewed at the variable rate. Notwithstanding the fact that about 80 per cent of the loans extended by banks are floating rate instruments, only a few banks had introduced floating rate deposit products during the last 10 years. Stress Test - Liquidity Risk 2.56 Liquidity risk analysis has been done using different definitions of liquid assets18. The stress scenarios are constructed to test the ability of banks to meet a run on their deposits using only their liquid assets. Under the stress scenarios, there were indications of deterioration in the liquidity position of some banks, though SLR investments helped them to ward off the liquidity pressure (Definition-1; Table 2.10). 2.57 The liquidity stress tests conducted on banks groups reveal that foreign banks have a better liquid asset position to guard against any stress, primarily due to their higher proportion of short term investments / excess SLR and most of their advances portfolio being short-term (less than one year). Interest Rate Risk 2.58 Investments accounted for 29.8 per cent of assets of the banking system, as at end September 2012. Stress tests carried out to evaluate the valuation impact by marking to market the banking book under different scenarios revealed that the banking system was capable of withstanding such shocks. The maximum impact due to upward movement of yield curve, was on the low maturity buckets on the banking book. Under the scenarios (Shock 1; Table 2.11), the capital position of the banking system is reduced sharply by 320 bps. On the other hand, the impact of direct interest rate risk on the trading book was not high (only about 80 bps). Therefore, overall impact under the assumed scenarios would still be manageable.
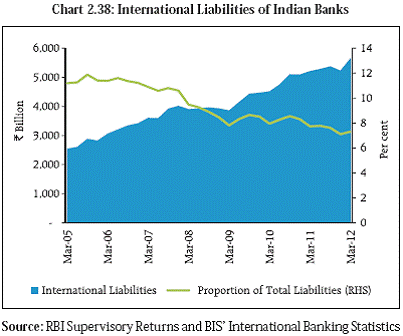
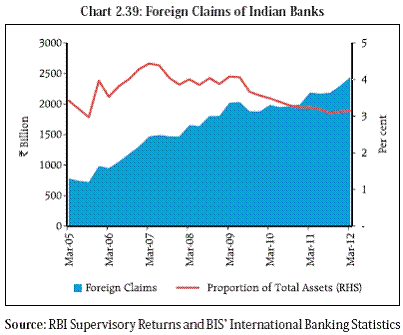
Equity Price Risk 2.59 The impact of assumed fall in equity prices by 40 per cent does not impact significantly as the equity market exposure of banks in India is not high. One specific reason is that there are regulatory limits prescribed for the capital market exposure of banks. The system level CRAR falls to 12.9 per cent under stress from the baseline at 13.6 per cent and no bank is severely impacted. Foreign Exchange Risk 2.60 Banks have direct exposure that is visible in balance sheet items like foreign exchange liabilities and commitments provided to overseas branches. While the Indian banking system’s liabilities to overseas entities has grown over the last several years, it has dwindled as a proportion of total liabilities (Chart 2.38). Likewise, their foreign claims (assets abroad on an ultimate risk basis) too have grown strongly but have remained largely unchanged as a proportion of total assets (Chart 2.39). This suggests low direct exposures to exchange rate risks (indirect foreign exchange risk, through unhedged corporate exposure is discussed in para 1.23 of Chapter I). 2.61 The relatively more flexible ‘internal models’ approach under Basel-II allows each bank to measure its exposure after incorporating the relationships among its various trading and non-trading operations (model risk is discussed in para 3.9 of Chapter III). However, the use of ‘internal models’ approach for analysis of the foreign exchange risk across various banks is constrained, due to the differences in the business models of banks and other related factors. 2.62 The foreign exchange risk under various scenarios (where INR appreciation of 10 and 20 per cent and depreciation of 10 and 20 per cent are assumed), do not show much impact on the commercial banks mainly because of low net open currency positions of individual banks. The reduction in CRAR is only 20 basis points under the assumed scenarios.
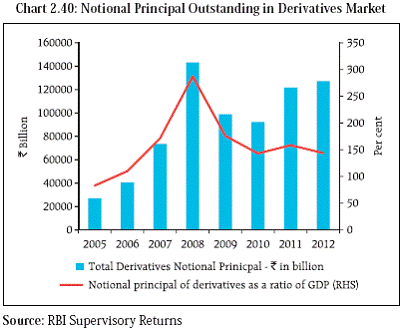
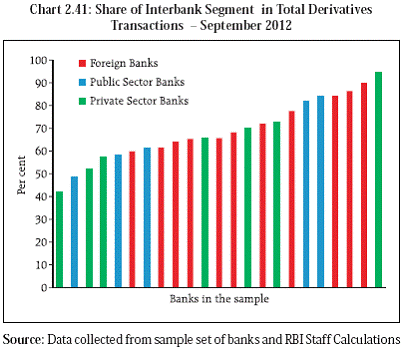
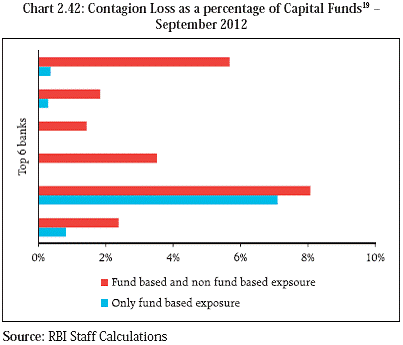
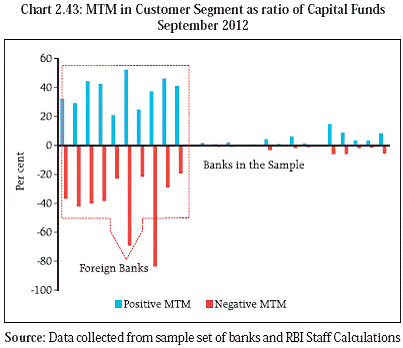
Derivatives Portfolio of Banks 2.63 Derivatives could engender systemic risk on account of the size of the over-the-counter (OTC) segment of the derivatives market and the high concentration of financial obligations, with a relatively small number of banks serving as counterparties to a large number of OTC derivative transactions. 2.64 The derivatives market in India grew sharply in the years leading up to the global financial crisis. Though the portfolio size has shrunk since 2008, it still remains large with the notional outstanding principal of the derivatives portfolio of banks constituting over 1500 per cent of banks’ capital funds and over 160 per cent of its total assets as on March 31, 2012 (Chart 2.40 and Table 2.12). A significant degree of concentration exists in the Indian derivative markets with foreign banks as a group constituting 70 per cent of the outstanding notional principal in the derivatives market, disproportionate to their share in balance sheet assets of the banking system at 7 per cent. Further, the share of the top five banks in notional principal outstanding constituted 43 per cent of the outstanding notional of the derivatives portfolio of all scheduled commercial banks as on March 31, 2012. 2.65 The bulk of outstanding derivative transactions are interbank transactions – for the 26 banks with the largest derivatives exposures, the interbank segment of the derivatives market constituted, on an average, 76 per cent of the total outstanding derivatives as at September 2012 (Chart 2.41). This accentuates the interconnectedness between banks and increases the risk of contagion arising from the failure of any bank. Contagion analysis shows that in case of the top six banks in terms of derivatives exposure, the loss from failure of any one bank increases significantly when non fund based exposures are considered along with fund based exposures (Chart 2.42). Credit risk emanating from derivative receivables 2.66 The net mark to market (MTM) value of the derivatives portfolio for the banks in the sample varied across the two segments – with most banks registering negative net MTM in case of the interbank segment and positive net MTM in case of the customer segment. The receivables from the customer segment constituted 26 per cent of the total receivables of banks. The gross receivables from customers were relatively small vis-à-vis the capital funds in case of public and private sector banks, while they were significantly higher in foreign banks. The credit risk emanating from these positions will need to be carefully monitored (Chart 2.43).
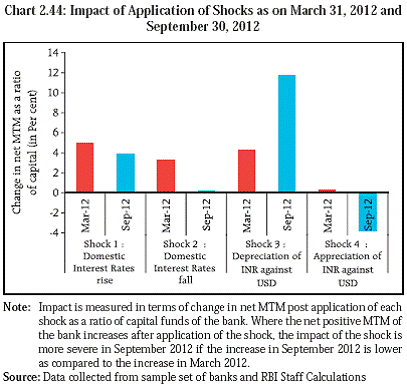
Sensitivity of the derivatives portfolio to market risks 2.67 A series of stress tests was carried out on the derivatives portfolio as on September 30, 2012 by a sample of 26 banks based on a common set of four interest rate and exchange rate sensitivity shocks20. The sample of banks and shocks were the same as used for the analysis presented in the June 2012 issue of the FSR. The results of the stress testing indicate that the sensitivity of the derivatives portfolio to market movements has increased in the period since the publication of the previous FSR, as the average change in net MTM as a ratio of capital based on a worst case analysis across the four shocks (the maximum impact across the set of four shocks) has increased from 2 per cent as at March 2012 to 10 per cent as at September 2012. The impact of individual shocks, however, displays mixed trends (Chart 2.44).
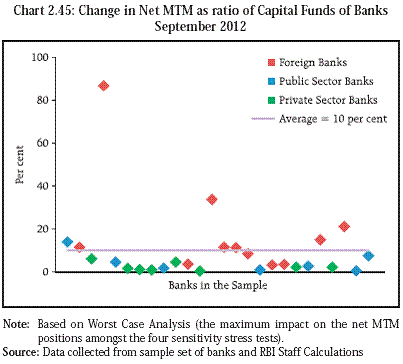
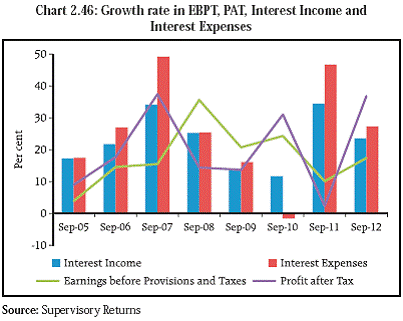
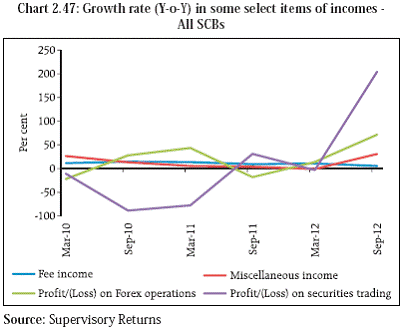
2.68 The average impact of the application of shocks stood at about 10 per cent of capital funds. However, there were some outlier banks where the impact was significantly higher (Chart 2.45). Profitability 2.69 An analysis of main components of income shows that the growth in interest income as well as interest expense has declined during the half year ended September 12, but the decline was comparatively sharper in case of interest expense. This, apart from other factors, has contributed to growth in earnings before provisions and taxes (EBPT). The profit after tax has also grown at a rate of 36.8 per cent, reaching close to the growth rate of 37.4 per cent observed in September 2007 (Chart 2.46). 2.70 The profitability during the current half year has been supported by a faster growth in other items of income like miscellaneous income, profit from trading and forex during the first half year (Chart 2.47). The commission income from selling insurance and mutual fund products by banks has also increased in recent period. 2.71 The provision cover of many large banks, mainly the public sector banks, has steadily declined during last few quarters (Chart 2.48). The fall in provision coverage ratio (without write-offs), apart from other factors has perhaps helped banks in reporting an improved profit performance over the last two quarters, even as NPAs have increased during the period. This effect is more marked in the cases of public sector banks, as they have experienced the fastest growth in NPAs and restructured assets.
2.72 The net interest margin (NIM) at the system level has remained stable at about 3.0 per cent but declined slightly for a few large public sector banks. Going ahead, the NIM of the banks may remain under pressure as the benefit of a possible decline in cost of funds is likely to be offset by declining asset yields. Regional Rural Banks 2.73 An analysis of financial soundness indicators and balance sheet components of Regional Rural Banks (RRBs) reveals that the financial performance of RRBs bas been improving (Table 2.13). Fewer banks made losses during 2011-12 compared to 2010-11(3 as opposed to 7 earlier) and the loss amount too has shrunk from `710 million to `280 million. While there has been 17.7 per cent growth in advances, deposits have grown to the extent of 12.1 per cent on a y-o-y basis. As on date, 19 RRBs in 6 states have been amalgamated across 12 sponsor banks. 71 RRBs are now in existence against 82 RRB prior to amalgamation. Urban Co-operative Banks 2.74 There were 51 Scheduled UCBs (SUCBs) as on September 30, 2012. An analysis of all SUCBs revealed that overall CRAR declined from 12.8 per cent as on March 31, 2012 to 12.6 per cent as on June 30, 2012 and thereafter increased marginally to 12.7 per cent as on September 30, 2012. GNPA ratio increased from 4.6 per cent as on March 31, 2012 to 5.9 per cent as on June 30, 2012 and increased further to 6.1 per cent as on September 30, 2012. Annualised RoA improved from 0.9 per cent as on March 31, 2012 to 1.3 per cent as on June 30, 2012 and thereafter declined to 1.1 per cent as on September 30, 2012. Liquidity Ratio based on stock approach for the SUCBs which was 34.0 per cent as on March 31, 2012 as well as June 30, 2012 improved marginally to 34.1 per cent as on September 30, 2012. Provision Coverage Ratio of SUCBs declined from 76.2 per cent as on March 31, 2012 to 66.0 per cent as on June 30, 2012 and thereafter improved to 66.2 per cent as on September 30, 2012 (Table 2.14).
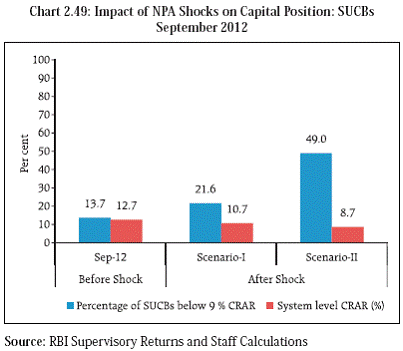
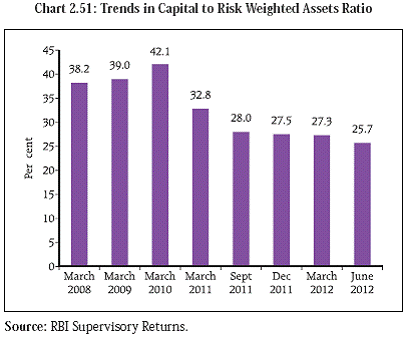
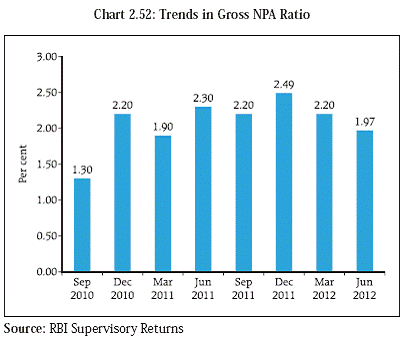
Stress Test - SUCBs - Credit Risk 2.75 Stress tests on credit risk were carried out for SUCBs using the data based on Off-Site Surveillance (OSS) returns as on September 30, 2012. The impact of credit risk shocks on the CRAR of SUCBs was assessed under two different scenarios assuming an increase in the GNPA by 50 per cent and 100 per cent respectively. The results show that SUCBs could withstand shocks assumed under the first scenario easily, though they would come under some stress under the second scenario (Chart 2.49). Stress Tests – SUCBs - Liquidity Risk 2.76 Stress tests on liquidity risk were carried out under two different scenarios assuming an increase in cash outflows in the 1 to 28 days time bucket by 50 per cent and 100 per cent respectively. It was assumed that there was no change in cash inflows under both the scenarios. The banks would be considered to be impacted as a result of the stress if the mismatch or negative gap (i.e. the cash inflow less cash outflow) in the 1 to 28 days time bucket exceeds 20 per cent of outflows. The stress test results indicate that the SUCBs would be significantly impacted even under the less severe stress scenario (Chart 2.50). Non-Banking Financial Companies (NBFCs) 2.77 In India, this sector has been in the regulated space and its growth and development has been under the oversight of the Reserve Bank. Among NBFCs, the highest monitoring attention is accorded to firms identified as systemically important, specifically, the Non-Bank Financial Companies - Non-Deposit Taking – Systemically Important (NBFC-ND-SI). The CRAR norms were extended to NBFCs-ND-SIs and they are required to maintain a minimum capital, consisting of Tier-I and Tier- II capital, of not less than 15 per cent of their aggregate risk-weighted assets. 2.78 The aggregate CRAR of the ND-SI sector stood at 25.7 per cent for the quarter ended June 2012 (Chart 2.51). While it is high, the ratio has been deteriorating in the last few quarters. The gross NPA ratio21 of the NBFC sector has remained stable around 2.0 per cent for the past many quarters (Chart 2.52).
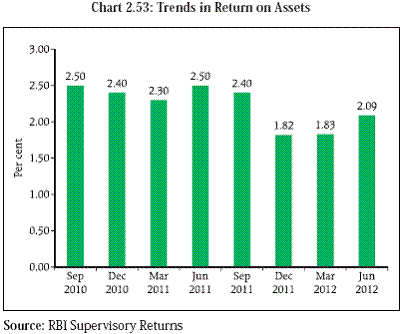
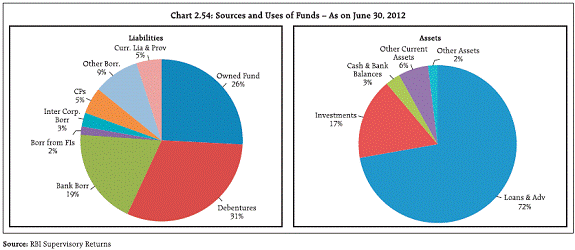
Profitability Ratios 2.79 The return on assets (net profit as a percentage of total assets) of the NBFCs-ND-SI sector stood at 2.1 per cent for the quarter ended June 2012 as compared with 2.5 per cent for the same quarter in the previous year (Chart 2.53). Sources & Uses of Funds of NBFC Sector 2.80 NBFCs (ND-SI) collect funds from a wide range of sources including debentures, borrowings from banks, financial institutions, commercial paper, inter-corporate borrowings etc (Chart 2.54). Owned fund is another prospective source of finance for NBFCs (ND-SI) and is accounted for 26 per cent of total liabilities. Of these sources of funds, accessing funds through debentures constitute a major portion of total funds followed by borrowings from banks. On the assets side, loans & advances is the major use of funds and is accounted for 72 per cent of total uses of funds.
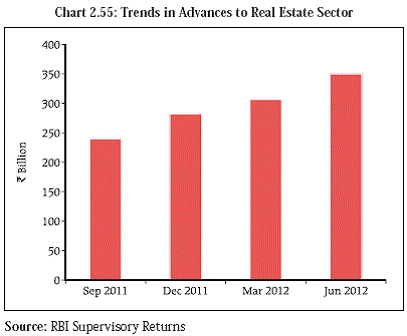
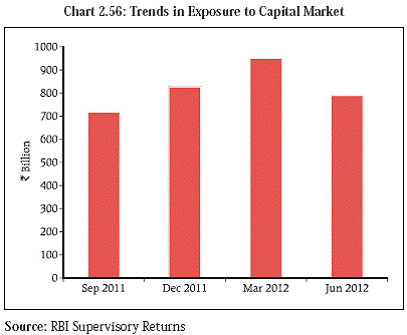
2.81 Advances of NBFCs to real estate sector on an average accounted for 4.5 per cent of total advances of the ND-SI sector (Chart 2.55). 2.82 Capital market exposure(CME) includes (i) investments in listed instruments and (ii) advances to capital market related activities. CME of the NBFC sector on an average accounted for 9.0 per cent of total assets of the ND-SI sector, while CME to owned funds of the sector accounted for 34.5 per cent (Chart 2.56). Infrastructure Finance Companies (IFCs) 2.83 Aggregate balance sheet size of the eight IFCs increased by 27.5 per cent during 2011-12 on top of 25.3 per cent growth witnessed in the previous year. Debentures of these companies increased more than 2.5 times during the period of three years i.e. from March 2010 to March 2012 (Chart 2.57). This may be largely due to raising of huge funds through non-convertible debentures. Bank borrowings of IFCs increased marginally by 0.7 per cent in 2011-12 as against 14.3 per cent growth witnessed in the previous year. 2.84 Leverage ratio of the IFCs hovered between 5.1 and 5.7 during the period under review. The share of bank borrowings in total liabilities decreased from 17.5 per cent as on March 31, 2010 to 12.5 per cent as on March 31, 2012, while the share of debentures increased from 34.5 per cent to 56.9 per cent during the same period. Return on assets of the IFCs, witnessed decelerating trend, it declined from 2.5 per cent as on March 2010 to 2.1 per cent as on March 2012. In tandem with RoA, return on equity also decelerated (declined from 15.1 per cent to 14 per cent) during the period under review. Stress testing the NBFC sector (NBFC-D and ND-SI) 2.85 A stress test on credit risk for NBFC sector (includes both deposit taking and ND-SI) for the period ended June 2012 was carried out under two scenarios (i) where gross NPA increased two times and (ii) gross NPA increased 5 times from the current level. It was observed that in the first scenario, CRAR dropped by 0.7 percentage points from 26 per cent to 25.3 per cent while in the second scenario CRAR dropped by 2.5 percentage points (CRAR dropped from 26 per cent to 23.5 per cent). It may be concluded that even though there was shortfall in provisioning under both the scenarios, the impact on CRAR was negligible as the sector had a higher level of CRAR at 26 per cent as against the bench mark CRAR of 15 per cent.
Stress Testing Major Individual NBFCs 2.86 A stress test on credit risk for major individual NBFCs for the period ended June 2012 was also carried out under two scenarios (i) where gross NPA increased two times and (ii) gross NPA increased 5 times from the current level. Under first scenario, it was observed that 4.9 per cent companies would have CRAR less than regulatory CRAR of 15 per cent while in second scenario, CRAR of 9.5 per cent companies was found to be less than regulatory CRAR of 15 per cent. Pension System in India22 2.87 During financial crises a steep fall in asset prices trigger redemption pressure which is a potential destabiliser for the fund management industry. In such stressed scenario, only long-term funds such as, pension funds can be a source of financial stability providing buying support. The larger the pension funds’ investible resources, the stronger will be the stabilising force. In India, a continued reliance on unsustainable pay-as-yougo pension schemes in the government has the potential for an adverse impact on financial stability by raising fiscal deficit. In the case of civil servants, a transition from the pay-as-you-go Defined Benefit to a fully funded Defined Contribution pension system has already been made for the centre and for a large majority of the states. However there exist a large number of Defined Benefit schemes for the unorganised sector both at the level of the centre and the states. These schemes which mainly target either the people Below Poverty Line (BPL) or occupational groups vary in terms of the benefit structures, administrative mechanisms and coverage. Often the scheme is announced without any actuarial estimation of the future liability or the funding requirement. However, unless a fiscally sustainable mechanism for delivering this goal is designed risks would be either an inadequate coverage or a poor benefit structure. 2.88 Infrastructure financing gap act as a drag on economic growth. Pension funds being long-term funds can be used to finance infrastructure projects. The working sub-group on infrastructure, Planning Commission has estimated available resources to the tune of `1507 billion to come from insurance/pension fund. It has also recommended the necessity of regulatory reforms for insurance/pension funds to mobilise savings through these channels into infrastructure. 1 Methodology is described in the Annex. 2 Details are in FSR-June 2011. 3 This methodology also offers great flexibility for implementation, since the PoDs of individual bank represent the input variables, which can be estimated using alternative approaches. The PoDs for banks were estimated from their equity return distributions. Under this approach, first, banks’ historical distributions of equity returns are estimated. Then, the probability of returns falling under the historical worse 1 per cent of the cases (99 VaR) is quantified. Therefore, the PoD of a specific bank represents the probability that the bank’s equity return would fall in the tail region (historical one percentile). 4 For the study 15 major banks have been selected for which equity price data are available. These represent about 60 per cent of total assets of scheduled commercial banks. 5 The network analysis has been conducted based on data in respect of bilateral fund based and non-fund based exposures between banks, asset management companies, insurance companies, NBFCs, financial institutions and urban cooperative banks. The transactions where the settlement takes place through a central counterparty have not been reckoned. The Network model used in the analysis has been developed by Professor Sheri Markose (University of Essex) and Dr. Simone Giansante (Bath University) in collaboration with the Financial Stability Unit, Reserve Bank of India. 6 Market share is computed as (Lending plus borrowing)/(total lending + total borrowing) 7 Distress conditions are based on the capital adequacy ratio of banks. The colour coding used in the contagion chart is as follows; Black: Trigger and distressed institutions. 8 For the purpose of this analysis, the 10 banks with the highest eigenvector centrality (i.e. banks which are most connected) as on September 30, 2012 have been considered. Refer Box 5.1 in the Financial Stability Report, June 2012 for the eigenvector measure of centrality. 9 LGD is defined as a bank’s economic loss upon the default of a debtor/borrower. 10/en/web/rbi/-/notifications/implementation-of-the-internal-rating-based-irb-approaches-for-calculation-of-capital-charge-for-credit-risk-6887 11 The analysis is conducted on gross exposures between banks. The exposures include the fund based and derivative exposures. The assumption used is that when a bank is liquidated, the funds lent by the bank are called in on a gross basis, whereas when a bank calls in a short term loan without being liquidated, the loan is called in on a net basis (on the assumption that the counterparty is likely to first reduce its short term lending against the same counterparty). 12 The analysis is based on a sample size of around 30 large NBFCs 13 Methodologies are given in the Annex. 14 Enhanced Provision norm- std assets 1%, sub-std assets 30%, doubtful & loss assets 100% assumed. 15 Focus of macro-stress tests is credit risk. This is captured through NPA/slippage ratios. Details are given in the Annex. 16 These stress scenarios are stringent and conservative assessments under hypothetical-severely adverse economic conditions and should not be interpreted as forecasts or expected outcomes. 17 Premature withdrawal of deposits is permitted by banks in India with some penalty in the form of reduced effective interest rates 18 The liquid assets comprise of cash, Inter-bank-deposits and Investments. 19 Contagion loss refers to the loss caused to the banking system due to the failure of a trigger bank (one bank at a time). For more details refer to the analysis of contagion in the network of the banking system (para 2.11). 20 For details on shocks, refer to the Annex 21 The NBFC Sector follows the 180 day norm for recognition of NPAs as opposed to the 90-day norm in case of commercial banks. 22 Source: Pensions Funds Regulatory and Development Authority (PFRDA) |
||||||||||||||||||||||||||||||||||||||||||||||||||||||||||||||||||||||||||||||||||||||||||||||||||||||||||||||||||||||||||||||||||||||||||||||||||||||||||||||||||||||||||||||||||||||||||||||||||||||||||||||||||||||||||||||||||||||||||||||||||||||||||||||||||||||||||||||||||||||||||||||||||||||||||||||||||||||||||||||||||||||||||||||||||||||||||||||||||||||||||||||||||||||||||||||||||||||||||||||||||||||||||||||||||||||||||||||||||||||||||||||||||||||||||||||||||||||||||||||||||||||||||||||||||||||||||||||||||||||||||||||||||||||||||||||||||||
Page Last Updated on:


