 IST,
IST,


Chapter II : Financial Institutions: Soundness and Resilience
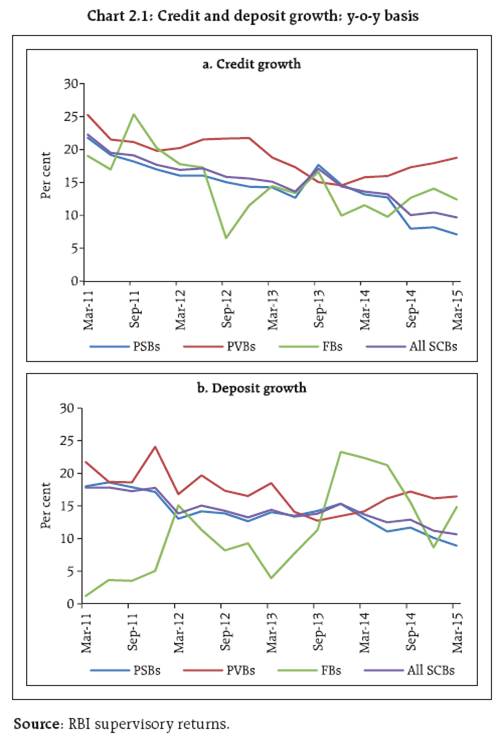
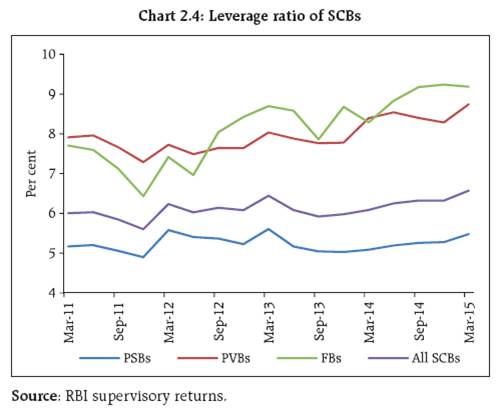
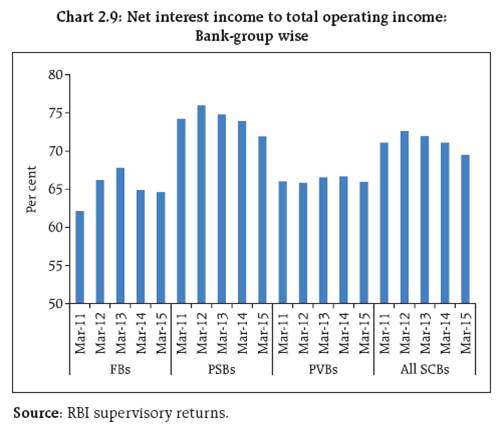
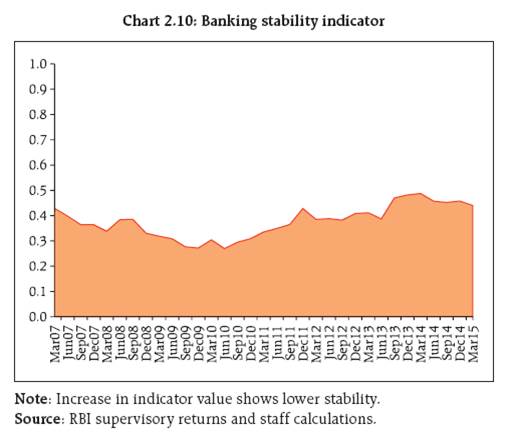
During the year ended March 2015, banking business slowed down with a decline in both deposit and credit growth. The ratio of gross non-performing advances (GNPAs) of scheduled commercial banks (SCBs) marginally increased between September 2014 and March 2015. The restructured standard advances also increased during the period. The capital to risk-weighted assets ratio (CRAR) of SCBs registered some improvement during this half-year. Public sector banks continued to record the lowest CRAR among the bank groups. Profitability of SCBs, however, remained around the same level during the past two years. The asset quality of scheduled urban co-operative banks improved significantly between September 2014 and March 2015, whereas, the asset quality of non-banking financial companies continued to deteriorate. The banking stability map indicates continued concerns about asset quality and profitability. While stress tests reveal resilience, the system could become vulnerable if the macroeconomic conditions deteriorate sharply. Scheduled commercial banks1 2.1 In this section, the soundness and resilience of scheduled commercial banks (SCBs) are discussed under two broad sub-heads: banks’ performance on their different functional aspects and their resilience using macro-stress tests through scenarios and single factor sensitivity analysis. Performance Credit and deposit growth 2.2 Credit growth, on a y-o-y basis, declined to 9.7 per cent from 10.0 per cent and deposits growth declined to 10.7 per cent from 12.9 per cent between September 2014 and March 2015. Within this broader trend, growth of the banking sector slowed largely reflecting the subdued performance of public sector banks (PSBs). Credit growth in PSBs declined to 7.1 per cent in March 2015 from 8.0 per cent in September 2014, whereas, private sector banks’ (PVBs) credit growth improved to 18.7 per cent from 17.3 per cent during the same period (Chart 2.1). 2.3 Sectoral deployment of bank credit indicated that retail credit growth on a y-o-y basis was robust at 18.3 per cent as of March 2015. However, credit flow to non-bank financial institutions (NBFIs), the agriculture sector and micro and small enterprises (MSE) showed a significant decline. Export credit recorded negative growth of 5.6 per cent (Chart 2.2). Soundness Capital adequacy 2.4 The capital to risk-weighted assets ratio (CRAR) of SCBs at the system level improved marginally to 12.9 per cent from 12.8 per cent between September 2014 and March 2015. PSBs continued to record the lowest CRAR among the bank-groups. The decline in their soundness (measured in terms of CRAR) by 1.8 percentage points between March 2011 and March 2015 was the maximum, followed by foreign banks (FBs) at 1.5 percentage points and PVBs at 1.1 percentage points (Chart 2.3). Leverage 2.5 The Tier I leverage ratio2 improved to 6.6 per cent from 6.3 per cent between September 2014 and March 2015 due to an improvement in the capital levels of PVBs and PSBs (Chart 2.4). Asset quality 2.6 The gross non-performing advances (GNPAs) of SCBs as percentage of gross advances increased to 4.6 per cent from 4.5 per cent between September 2014 and March 2015. The restructured standard advances during the period also increased, pushing up the SCBs’ stressed advances3 to 11.1 per cent of the total advances from 10.7 per cent. PSBs recorded the highest level of stressed assets at 13.5 per cent of total advances as of March 2015, compared to 4.6 per cent in the case of PVBs. The net non-performing advances (NNPAs) as a percentage of the total net advances for all SCBs remained unchanged at 2.5 per cent during September 2014 and March 2015. At bank group level, NNPA ratio of PSBs increased from 3.1 per cent to 3.2 per cent and in the case of PVBs, it increase from 0.8 per cent to 0.9 per cent (Charts 2.5 and 2.6). 2.7 Sectoral data as of December 2014 indicates that among the broad sectors, industry continued to record the highest stressed advances ratio at 17.9 per cent followed by services at 7.5 per cent. The retail sector recorded the lowest stressed advances ratio at 2.0 per cent (Chart 2.7). PVBs had the highest share of retail loans in their total loans at 27.7 per cent as against 17.1 per cent for PSBs. 2.8 Five sub-sectors, namely, mining, iron & steel, textiles, infrastructure and aviation, which together constituted 24.8 per cent of the total advances of SCBs, had a much larger share of 51.1 per cent in the total stressed advances. Among these five sectors, infrastructure and iron & steel had a significant contribution in total stressed advances accounting for nearly 40 per cent of the total. Among the bankgroups, PSBs, which had the maximum exposure to these five sub-sectors, had the highest stressed advances (Table 2.1). 2.9 Apart from the these five stressed sub-sectors, there were some other sub-sectors of industry, like food processing, engineering, vehicles, wood, paper, glass and glassware, construction, amongst others, which showed a high and rising level of GNPA (Chart 2.8). Among these sub-sectors, food processing, engineering, vehicles and construction had more than one per cent share each in SCBs’ total advances. Profitability 2.10 The profitability of all SCBs, measured by return on assets (RoA) and return on equity (RoE) remained around the same levels during the last two years, whereas, y-o-y growth in profit after tax (PAT) improved sharply to 11.4 per cent during 2014-15 from a decline of 14.1 per cent during 2013-14 mainly due to the base effect (Table 2.2). Other contributors to the improvement in profitability of the banking system included factors such as rise in treasury gains, write back of excess provisions held in investment portfolio, and lower rise in operating expenses especially staff costs. At a disaggregated bank-level, 28 banks recorded negative PAT growth. 2.11 The share of net interest income (NII) to total operating income (TOI) of all SCBs declined to 69.5 per cent during 2014-15 as compared to 71.1 per cent in 2013-14. Consequently, the share of other operating income (OOI) to TOI increased during the same period. The share of earning from securities trading in OOI increased during the last three years, whereas, fee income declined in the same period (Table 2.3). 2.12 Among the bank-groups, PSBs had the highest share of net interest income in their total income followed by PVBs. The share of NII to TOI declined during 2014-15 across the banks-groups, with PSBs recording the largest fall of around 2.0 percentage points (Chart 2.9). Risks 2.13 The Banking Stability Indicator (BSI),4 shows that risks to the banking sector moderated marginally since the publication of the previous FSR5, though the level of risks continue to be a matter of concern. Further, concerns also remain over the already deteriorated asset quality and lower soundness (though marginally improved) as also the profitability which remained sluggish (Charts 2.10 and 2.11). Further deterioration in the asset quality, if any, could adversely affect the health of the banking system. Resilience - Stress tests Macro stress test-Credit risk6 2.14 The resilience of the Indian banking system against macroeconomic shocks was tested through a series of macro stress tests for credit risk at the system, bank-group and sectoral levels. These tests encompass assumed risk scenarios incorporating a baseline and two adverse macroeconomic scenarios representing medium and severe risks. The adverse scenarios were derived based on up to one standard deviation (SD) for medium risk and up to two SD for severe risk (10 years historical data)7 (Table 2.4).
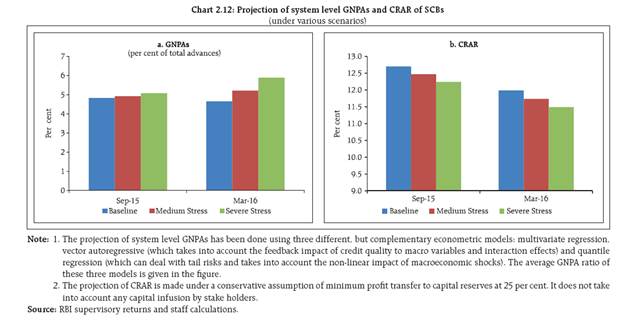
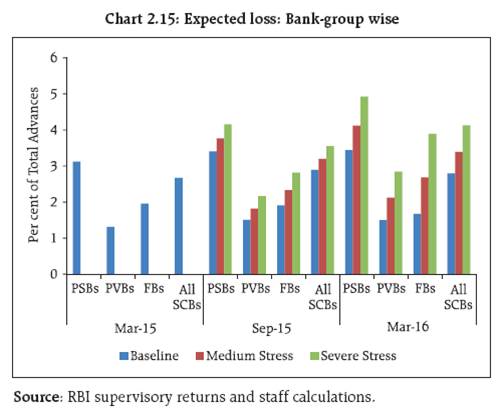
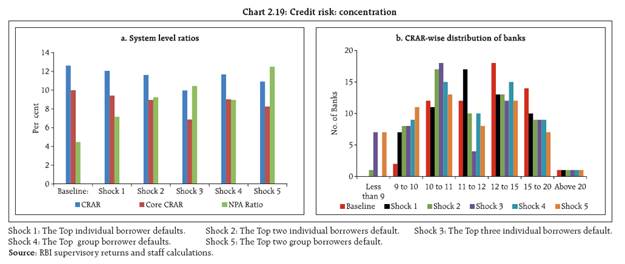
System level credit risk 2.15 The macro stress test of credit risk suggests that under the baseline scenario, the GNPA ratio may increase to 4.8 per cent by September 2015 (same as recorded in December 2014) from 4.6 per cent as of March 2015, which could subsequently improve to 4.7 per cent by March 2016. However, if the macroeconomic conditions deteriorate, the GNPA ratio may increase further and it could rise to around 5.9 per cent by March 2016 under a severe stress scenario. Under such a scenario, the system level CRAR of SCBs could decline to 11.5 per cent by March 2016 from 12.9 per cent as of March 2015 (Chart 2.12). Bank group level credit risk 2.16 Among the bank-groups, PSBs might continue to register the highest GNPA ratio. Under baseline their GNPA ratio may go up to 5.7 per cent by March 2016 which may further increase to 7.0 per cent under a severe stress scenario. Under such severe stress scenario, the GNPA ratio of PVBs could move to 4.1 per cent by March 2016 from 2.1 per cent as at end March 2015 (Chart 2.13). 2.17 Under a severe stress scenario, PSBs may record the lowest CRAR of around 10.2 per cent by March 2016, as against 11.4 per cent as at end March 2015 (Chart 2.13). Sectoral credit risk 2.18 A macro-stress test of sectoral credit risk revealed that in severe stress scenario, among the select seven sectors, engineering, which has the highest GNPA ratio at 7.5 per cent as of March 2015, could register GNPA ratio at around 10.8 per cent by March 2016 followed by iron & steel at 8.8 per cent and cement at 7.6 per cent by March 2016 (Chart 2.14). Estimation of losses9 for credit risk: Provisioning and capital adequacy 2.19 The provisioning10 levels of various bank groups as a percentage of their total advances were 3.3 per cent for PSBs, 2.0 per cent for PVBs and 3.7 per cent for FBs as at end March 2015, which are above their estimated expected losses (EL) in the baseline scenario. PSBs, which had the highest expected loss as per cent of their total advances among the bankgroups are likely to fall short in terms of having sufficient provisions to meet their EL under adverse macroeconomic risk scenarios11 (Chart 2.15). 2.20 The estimated unexpected losses (UL) and expected shortfalls (ES) arising from the credit risk of various bank groups, even under severe macroeconomic stress conditions are expected to be much lower than the present level of total capital (Tier I plus Tier II) maintained by the banks. The level of total capital as per cent of total advances12 was 12.5 per cent for PSBs, 21.2 per cent for PVBs and 35.3 per cent for FBs as of March 2015 (Chart 2.16). 2.21 The bank-wise13 estimation of EL and UL, arising from credit risk, shows that 16 banks, which had 26.5 per cent share in the total advances of the select 60 banks, were unable to meet their expected losses with their existing provisions (against 20 banks reported in FSR December 2014). On the other hand, there were only three banks (with 3.2 per cent share in total advances of the select banks) which were expected to have higher unexpected losses than total capital (Chart 2.17). Sensitivity analysis: Bank level 14 2.22 A number of single factor sensitivity stress tests15 (top-down) were carried out on SCBs (60 banks accounting for 99 per cent of the total banking sector assets) to assess their vulnerabilities and resilience under various scenarios16. The resilience of commercial banks with respect to credit, interest rate and liquidity risks was studied through the top-down sensitivity analysis by imparting extreme but plausible shocks. The results are based on March 2015 data. The same set of shocks was used on select SCBs to conduct bottom-up stress tests. Top-down stress tests Credit risk 2.23 The impact of different static credit shocks for banks as on March 2015 shows that the system level stressed CRAR remained above the required minimum of 9 per cent. Under severe shock of 3 SD17 (that is, by increasing GNPA ratio to 10.5 per cent from 4.5 per cent), the system level CRAR and Tier 1 CRAR declined to 9.9 per cent and 7.2 per cent, respectively. The capital losses at the system level could be around 23.6 per cent. The impact of these shocks on profit would be more severe with the SCBs losing the entire profit if the NPA moves up by 1.6 SD to 7.6 per cent (Table 2.5). At the individual bank-level, the stress test results show that 27 banks having a share of 65.5 per cent of SCBs’ total assets would fail to maintain the required CRAR under a severe shock of 3 SD increase in NPAs (Chart 2.18). Credit concentration risk 2.24 Stress tests on the credit concentration risk of banks show that the impact under various stress scenarios was significant for 8 banks, comprising about 19.0 per cent of the total assets, which may fail to maintain 9 per cent CRAR. Capital losses under the assumed scenarios of default of the top one borrower could be around 5 per cent. Default of the top two borrowers could result in capital losses of 9 per cent. Capital losses could be 14 per cent in case three individual borrowers default. Capital losses could be around 8 per cent and 15 per cent at the system level under the assumed scenarios of default of the top one group borrower and top two group borrowers. The impact on profit before tax (PBT) could be 111 per cent for default of top three individual borrowers. The losses could be 71 per cent of PBT under the scenarios of default of top two individual borrowers and 40 per cent in case the top individual borrower defaults. The impact on CRAR at the system level under the assumed scenarios of default of the top one, two and three individual borrowers would be 57, 101 and 266 basis points (bps). Default by the top group borrower would reduce the CRAR by 95 bps, whereas, impact of default by two group borrowers on CRAR would be 171 bps. However, system level CRAR would remain above 9 per cent under these shocks (Chart 2.19). Sectoral credit risk 2.25 Credit risk of exposure to a few important sectors, especially to industries was examined through sectoral credit stress tests. It was assumed that a portion of existing restructured standard advances18 would turn into NPAs accompanied by a shock on other standard advances in each sector. The results of a sensitivity analysis revealed that the shocks would significantly increase system level GNPAs, with the most significant effect of the single sector shock being in the iron & steel sector (Table 2.6) (Box 2.1). The impact of the shock on capital ratios was limited given that only a portion of the credit portfolio was subjected to shock. However, there could be a significant impact on banks’ profits (profit before tax), if the shock materialises. 2.26 Sectoral credit stress tests were also conducted for the infrastructure segment, including on a few important sub-sectors of power, transport and telecommunication. The tests revealed that the shocks on the infrastructure segment would significantly impact the system with the most significant effect of the single sector shock being in the power and transport sectors (Table 2.7) (Box 2.2). Box 2.1 : Performance of the iron & steel sector Currently India is the 3rd largest producer of steel in the world. However, the industry is beset with many problems: inadequate capital investments, shortage of iron ore, low paced mechanisation of mines, lower level of capacity utilisation of coal washeries, dependence on imported coking coal (the quality of most of the domestic coking coal is not considered good for steel production), volatility in the currency market, land acquisitions and environmental clearances issues, high port duty, lower import duty on stainless steel (dumping from China and Brazil), deceleration in domestic demand, deceleration in exports due to subdued demand coupled with depressed pricing in the global market and levy of an anti-dumping duty of 50-55 per cent by the US on Indian SAW19 pipes. These factors have created stress in the sector in general and more particular in case of private sector companies.20 As on date, five out of the top 10 private steel producing companies are under severe stress on account of delayed implementation of their projects due to land acquisition and environmental clearances among other factors. The Government of India has taken many initiatives like increasing the import duty from 5 per cent to 15 per cent for finished and semi-finished steel, use of green technologies, use of modern technology in pelletisation.21 improved logistics (through use of slurry pipelines for transportation of raw material), increased emphasis on research and development and relaxation of ECB rules (facilitating substitution of high cost loans), which would help in redressing the problems faced by the industry in the long run. Further, 12th Five Year Plan has envisaged an estimated investment of approximately one trillion US dollar for building urban infrastructure in India over the next 20 years. Other factors like estimated increase of the urban population to 600 million by 2030, emergence of the rural market for steel by projects like Bharat Nirman, the Pradhan Mantri Gram Sadak Yojana, the Rajiv Gandhi Awaas Yojana and the recent push to highway projects by the government, would help in raising domestic demand for steel. Therefore, India seems poised to become the second largest producer of steel in the world in the years to come. The sector holds very good long term prospects, though it is currently under stress, necessitating a close watch by lenders. Box 2.2 : Performance of the power sector The power sector in India has a huge potential, but it has been facing significant problems in terms of fuel availability / linkages, project clearances, social activism and aggressive bidding in coal block auctions by power producers resulting in lower plant load factors (PLF). Dependence on imported coal, which is three to four times more expensive, impinges on the bottom lines of companies. Besides, some of the uncertainties regarding environmental concerns in some countries and stricter regulations relating to higher tariff and transfer of ownership of coal mines to local companies in certain other countries could adversely affect the supply of coal. Serious bottlenecks persist in the area of power distribution. The deteriorating financial health of distribution companies (DISCOMs) is an area of concern. The states have not been able to strengthen the financial health of DISCOMs under their financial restructuring plans (FRP) as they have been unable to comply with the requirements relating to the elimination of the gap between average cost of supply (ACS) and average revenue realised (ARR), reduction of transmission & distribution (T&D) losses, fixing tariff on a regular basis and setting up of the State Electricity Distribution Responsibility Act. Banks have restructured around ₹530 billion of the seven DISCOMs’ exposure under FRP. The moratorium period for repayment of the principal amounting to ₹430 billion ended by March-2015. Considering the inadequate fiscal space, it is quite likely that the state governments might not be in a position to repay the overdue principal/ installments in time and banks may be forced to continue classifying these loans as SMA-2 as is being currently done on account of delayed servicing of interest. Probability of slippage of this exposure into NPAs is very high considering the implementation of new regulatory norms on restructuring of loans and advances effective April 1, 2015. While the government has improved potential domestic supply through auctioning of coal blocks and fixing the gas price to improve power generation, the debt servicing ability of power generation companies in the near-term may continue to remain weak given the high leverage and weak cash flows. Banks, therefore, need to exercise adequate caution while dealing with the sector and need to continue monitoring the developments very closely. Interest rate risk 2.27 The impact of interest rate risk in the trading book (direct impact on AFS and HFT portfolios of banks) under various stress scenarios is manageable with a reduction in CRAR by 92 bps at the system level. This impact is due to a parallel upward shift (2.5 percentage points) of the yield curve. The reduction in CRAR was 74 bps as reported in FSR-December 201422 for the same shock. At the disaggregated level, 3 banks comprising 8.8 per cent of the total assets were getting impacted adversely, whose CRAR falls below 9 per cent. The total capital loss at the system level was estimated to be about 8.2 per cent. The assumed shock of 2.5 percentage points parallel upward shift of the yield curve on the HTM portfolios of banks, if marked-to-market, would markedly reduce CRAR by about 276 bps adversely impacting 24 banks, whose CRAR falls below 9 per cent (the impact was 261 bps assessed in FSR December 2014). The income impact on the banking book23 of SCBs could be about 29.0 per cent of their profit (before tax) under the assumed shock of a parallel downward shift (2.5 percentage points) in the yield curve. 2.28 A bank group level analysis (using only select banks for stress testing) of the impact of a shock of 2.5 percentage points parallel upward shift of the yield curve in the trading book reveals that FBs may witness higher reduction in CRAR at 142 bps compared to PSBs (106 bps) and PVBs (89 bps), mainly because of their larger exposure in trading books. However, the rate sensitivity of investments in trading books (indicated by a modified duration) for PSBs was higher as compared to PVBs and FBs (Table 2.8). Liquidity risk 2.29 The liquidity risk analysis captures the impact of assumed scenarios on banks where deposit run-offs as well as increased demand for the unutilised portion of credit lines which are sanctioned/committed (taking into account the undrawn working capital limit and undrawn committed lines of credit) were considered. In assumed scenarios, there will be increased withdrawals of a portion of un-insured deposits24 and simultaneously there will be increased demand for credit on account of withdrawal of unutilised portion of sanctioned working capital limits as well as credit commitments of banks towards their customers. It is presumed that banks would be required to meet these using their stock of liquid assets (a portion of the SLR portfolio) only, with no external funding factored in. A 10 per cent haircut/ margin has been assumed on the investments. The tests were conducted for SCBs based on March 2015 data. 2.30 It is assumed that SLR at 21.5 per cent of NDTL is available to banks to support their liquidity requirements in the stress scenario. The impacts are given in Table 2.9.
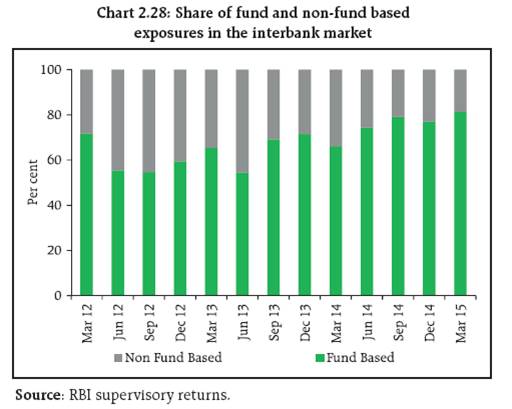
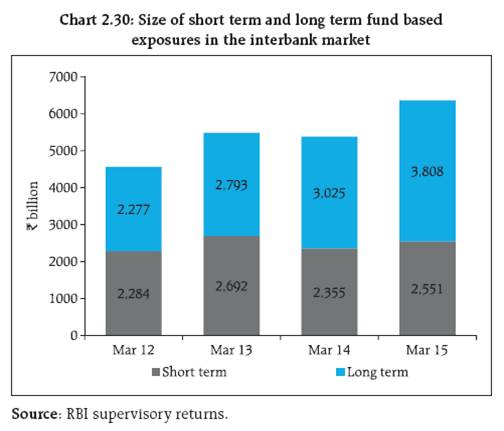
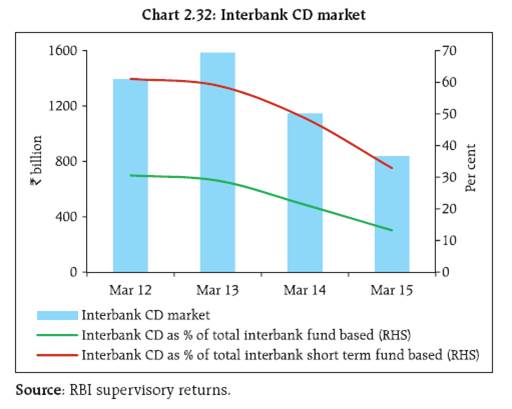
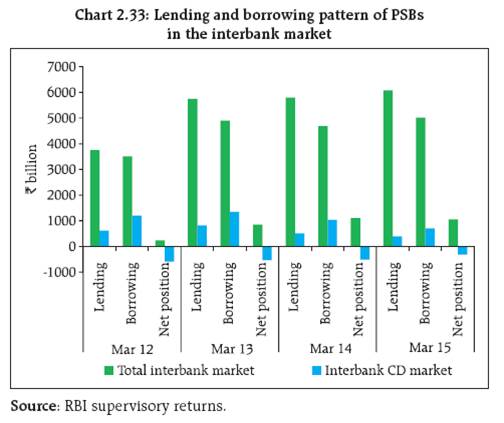
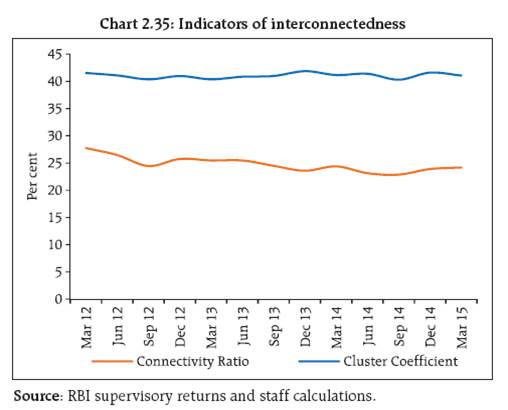
2.31 The analysis shows that though there would be liquidity pressure under the stress scenarios, most banks could withstand assumed sudden and unexpected withdrawals of around 20 per cent of deposits along with the utilisation of 75 per cent of their committed credit lines with the help of their statutory liquidity ratio (SLR) investments. Bottom-up stress tests 2.32 A series of bottom-up stress tests (sensitivity analyses) was conducted for the select sample banks,26 with the reference date as 31 March, 2015. The results of the bottom-up stress tests carried out by select banks also testified to the banks’ general resilience to different kinds of shocks. While confirming the top down stress tests results in general, the bottom-up stress tests also pointed out that most banks could withstand the impact of the shocks, though the impact would be relatively more severe on some banks with their stressed CRAR positions falling below the regulatory minimum of 9 per cent (Chart 2.20). 2.33 The results of bottom-up stress tests for liquidity risk show a significant impact of liquidity shocks on select banks. Liquid assets ratios27 using various definitions reflect the liquidity position of (select) banks under different scenarios. The results show that SLR investments and CRR deposits helped banks sustain themselves against the liquidity pressure from sudden and unexpected withdrawal of deposits by depositors to some extent (Chart 2.21). Derivatives portfolio of banks 2.34 Off-balance sheet exposures in the total assets of SCBs have recorded a declining trend in the recent past. FBs continued to have a very high share of off balance sheet assets in their total assets as compared to other bank groups (Chart 2.22). 2.35 A series of bottom-up stress tests (sensitivity analyses) on derivative portfolios were also conducted for select sample banks,28 with the reference date as on 31 March 2015. The banks in the sample, reported the results of four separate shocks on interest and foreign exchange rates. The shocks on interest rates ranged from 100 to 250 bps, while 20 per cent appreciation/depreciation shocks were assumed for foreign exchange rates. The stress tests were carried out for individual shocks on a stand-alone basis. 2.36 In the sample, the mark-to-market (MTM) value of the derivatives portfolio for the banks as on 31 March 2015 varied with PSBs and PVBs registering small MTM, while FBs had a relatively large MTM. Most of the FBs had negative net MTM (Chart 2.23). 2.37 The stress test results showed that the average net impact of interest rate shocks on sample banks were not high. However, the foreign exchange shock scenarios showed relatively greater impact but lower than the impact estimated in September 2013 (which was due to the depreciated rupee rate prevailing at that time) (Chart 2.24). Scheduled urban co-operative banks Performance 2.38 At the system level,29 CRAR of scheduled urban co-operative banks (SUCBs) declined marginally from 12.7 per cent in September 2014 to 12.6 per cent in March 2015. However, at a disaggregated level, five banks failed to maintain the minimum required CRAR of 9 per cent. GNPAs of SUCBs improved to 6.0 per cent of gross advances in March 2015 from 7.2 per cent as of September 2014. Their provision coverage ratio also improved significantly to 59.7 per cent from 52.4 per cent during the same period (Table 2.10). Resilience: Stress tests Credit risk 2.39 A stress test for assessing credit risk was carried out for SUCBs using the provisional data as of March 2015. The impact of credit risk shocks on CRAR of SUCBs was observed under four different scenarios.30 The results show that except under the extreme scenario (one SD increase in GNPAs which are classified as loss advances), the system level CRAR of SUCBs remained above the minimum regulatory required level. However, individually, a large number of banks (25 out of 50 banks) would not be able to meet the required CRAR levels under the extreme scenario. Liquidity risk 2.40 A stress test on liquidity risk was carried out using two different scenarios; i) 50 per cent and ii) 100 per cent increase in cash outflows, in the one to 28 days’ time bucket. It was further assumed that there was no change in cash inflows under both the scenarios. The stress test results indicate that SUCBs will be significantly impacted under a stress scenario (out of 50 banks, 26 banks under scenario i) and 35 banks under scenario ii) and would face liquidity stress. Non-banking financial companies 2.41 As of March 2015, there were 11,842 NBFCs registered with the Reserve Bank, of which 220 were deposit-accepting (NBFCs-D) and 11,622 were non-deposit accepting (NBFCs-ND). NBFCs-ND with assets of ₹5 billion and above have been classified as systemically important non-deposit accepting NBFCs (NBFCs-ND-SI) since November 2014. As of March 2015, there were 200 NBFCs-ND-SI. All NBFC-D and NBFCs-ND-SI are subjected to prudential regulations such as capital adequacy requirements and exposure norms along with reporting requirements. Performance 2.42 During 2014-15, the aggregated balance sheet of the NBFC sector31 expanded by 16.8 per cent. Total borrowings, which accounted for more than two-third of the total liabilities increased by 18.7 per cent (Table 2.11). Asset quality 2.43 The asset quality of the NBFC sector has been deteriorating since the quarter ended March 2013 (Chart 2.25). The Reserve Bank issued special guidelines for both banks and NBFCs with the objective of mitigating stress due to their NPAs. NBFCs were advised to identify incipient stress in their accounts by creating a sub-asset category, which is ‘Special Mention Accounts’ (SMA). They were also directed to report relevant credit information to the Central Repository of Information on Large Credits (CRILC). Capital adequacy 2.44 As of March 2015, by and large, the capital adequacy position of the NBFC32 sector witnessed an almost stable trend, though, CRAR with respect to 15 NBFCs was less than the minimum required level of 15 per cent (Chart 2.26). 2.45 The financial performance of the NBFC sector improved, as net profit to total income increased from 18.3 per cent during 2013-14 to 18.8 per cent during 2014-15 (Table 2.12). Profitability 2.46 RoA of the NBFC sector declined to 2.2 per cent as of March 2015 from 2.5 per cent as of September 2014 (Chart 2.27). Resilience: Stress tests System level 2.47 Stress test on credit risk for the NBFC sector as a whole for the period ended March 2015 was carried out under three scenarios: i) GNPA increase by 0.5 SD ii) GNPA increase by 1 SD and iii) GNPA increase by 3 SD. The results indicate that in the first scenario, the impact on the CRAR of the sector was negligible, while in the second and third scenarios, the CRAR declined to 27.1 per cent and 26.6 per cent respectively, from its level of 27.3 per cent as of March 2015. This however, was much above the regulatory minimum required level of 15 per cent. Individual NBFCs 2.48 Stress test on credit risk for individual NBFCs was also conducted for the same period under the same three scenarios. The results indicate that under scenarios i) and ii), around 14 per cent of the companies would not be able to comply with the minimum regulatory capital requirements of 15 per cent, while 19 per cent of companies would fail to comply with the minimum regulatory CRAR in the third scenario. Under the third scenario, 12 per cent of the NBFCs would indicate negative CRAR. Interconnectedness33 Trends in the interbank market 2.49 The size of the interbank market34 which remained within a broad range of ₹6 to ₹9 trillion over the last three years, stood above ₹7.8 trillion as at the end of March 2015, which constituted 7.2 per cent of the total banking sector assets35. The interbank market is predominantly fund based with PSBs having a market share of 74 per cent (Charts 2.28 and 2.29). 2.50 As of March 2015, short term instruments, primarily certificate of deposits (CDs) issued by banks accounted for 40 per cent of the exposures in the interbank fund based market, amounting to around ₹2.5 trillion (Chart 2.30). With short term fund based interbank borrowing contributing more than 3 per cent of the total outside liabilities for FBs, their dependency on this particular market is the highest among all bank groups. This ratio with respect to the PSBs closely followed the sectoral average (Chart 2.31). 2.51 While the interbank CD market shrunk considerably during the last two years, it still accounted for about one-third of the total short-term interbank fund based market as at the end of March 2015 (Chart 2.32). PSBs, which as a group, were a net lender in the overall interbank market, emerged as a big net borrower in the interbank CD market. As of March 2015, PSBs had a negative net position of ₹313 billion in the interbank CD market while having a positive net position of ₹1053 billion in the overall interbank market (Chart 2.33). 2.52 Besides banks, the other big institutional investors in the CDs issued by the banking sector were asset management companies (AMCs) managing mutual funds and insurance companies.36 The banking sector raised funds worth ₹2 trillion through CDs from these two sectors at the end of March 2015, with PSBs having a major share in the raised funds (Table 2.13). The total funds raised by PSBs in the form of CDs, together was, thus, sizeable. Trends in connectivity 2.53 The network structure of the Indian banking system has remained consistent over the last four years, with some of the major banks being the most connected in the system. Interconnectedness in the system displayed a distinct tiered structure37 with a few banks being the most dominant in terms of connectedness, some with moderate connectedness and still some others being relatively less connected to the rest of the system. The network chart of the banking system provides a snapshot of the structure at a particular point of time. The changes in network structures over a period of time may provide valuable information about the evolving characteristics of the system and interconnectedness of the entities within it. Two of the important parameters to estimate the interconnectedness of the banking system, i.e., connectivity ratio38 and cluster coefficient39 also remained relatively steady at around 20 and 40 per cent respectively (Charts 2.34 and 2.35). While a similar or equivalent measure from another banking system is not available for comparative purposes, it may be concluded that the Indian banking system has remained reasonably interconnected.
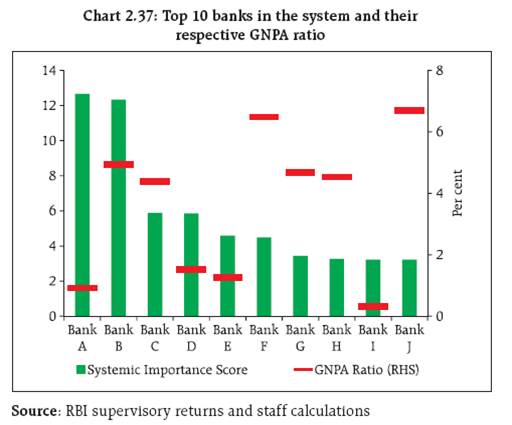
Interactions between banks, AMCs, insurance companies and NBFCs 2.54 At around 0.2 per cent of their total assets, the banking sector’s investment in AMCs and insurance companies was relatively much less compared to the funds raised, which was 6.6 per cent of their total assets as of March 2015 (Table 2.14 a and b). On the other hand, the banking sector continued to be a crucial investment avenue for both AMCs and insurance companies, as nearly 25 and 13 per cent of their respective assets under management (AUM) were held in the form of investment in the banking sector (Table 2.14 c and d). 2.55 An analysis of 36 big NBFCs reveals that the exposure of AMCs and insurance companies towards the sector demonstrated an increasing trend. As of March 2015, insurance companies were the most important source of funds for NBFCs (Table 2.15). Systemically important banks 2.56 While interconnectedness is a key indicator of the importance of a bank, it is not the only attribute that goes into establishing the systemic importance of a bank. The other crucial parameters are exposure in off balance sheet items, balance sheet size and share in the payment and settlement system. These parameters represent complexity, size and substitutability respectively of a particular bank. In this regard a systemic importance score has been assigned to a bank which is based on these four parameters.41 The analysis of the top 10 banks ascertained using this score revealed that these banks taken together accounted for half the banking systems’ share in all the four broad areas (Chart 2.36). Further, a better perspective can be drawn when the GNPA ratios of these banks are juxtaposed vis-à-vis their systemic importance. As the GNPA ratios of many of these systemically important banks are higher than the average GNPA level of the system, trends in their performance will need to be closely monitored (Chart 2.37) Contagion analysis 2.57 A contagion analysis using network tools was conducted to estimate potential loss to the banking system due to the idiosyncratic distress faced by different banks. This analysis was carried out under three different scenarios: one triggered by insolvency, second by illiquidity and the third where both insolvency and illiquidity of failing institutions interplayed with each other. In the real world the third kind of contagion, which has been christened as the joint solvency-liquidity contagion, is likely to take place due to the intense connectivity among banks.
2.58 Taking the banks with the highest stressed assets as trigger banks, the contagion analysis does not indicate a massive loss to the banking system in the event of failure of any of these banks (Table 2.16). The fact that the interconnectedness of these banks and their exposure to the rest of the system is relatively low, a contagion emanating from the failure of such a bank may be limited. On the other hand, taking the top 10 systemically important banks as trigger banks, the potential for huge losses in the system is much higher (Table 2.17).
1 Analysis is based on supervisory returns which cover domestic operations only. 2 Tier-I leverage ratio is defined as the ratio of Tier-I capital to total assets. Total assets include the credit equivalent of off balance sheet items. 3 For the purpose of analysing the asset quality, stressed advances are defined as GNPAs plus restructured standard advances. 4 The detailed methodology and basic indicators used under different BSI dimensions are given in Annex 2. 5 FSR-December 2014 (with reference to data at end September 2014). 6 The detailed methodology is given in Annex 2. 7 The quantum of shocks (as a multiplier of standard deviation) increased with time (quarterly period). 8 These stress scenarios are stringent and conservative assessments which are hypothetical. The severely adverse economic conditions referred to here should not be interpreted as forecasts or expected outcomes. 9 The procedure adopted and the definations thereof for estimating losses is given in Annex 2. Internationally, it is recommended that the estimated losses (EL & UL) approach be used for the purpose of making provisions and capital for the next one year. For this, PD (probability of default) is derived based on annual slippage. As the purpose of this study is to judge the adequacy of provisioning and capital levels being maintained by SCBs and not to estimate the required level of provisions and capital to be maintained for the next one year, the PD used here is based on GNPAs. 10 Provisions include provision for credit losses, risk provision for standard advances and provision for restructured standard advances. 11 The stress scenarios are defined in Table 2.4 under macro-stress tests. 12 In order to make a comparison, UL & ES and total capital have been given as per cent of total advances. The total capital to total advance ratio across the bank-groups may not be comparable because investment and off-balance sheet items are not taken into account. 13 Bank-wise estimation of EL and UL were undertaken for the 60 SCBs which cover 99 per cent SCBs’ total assets. 14 The sensitivity analysis was undertaken in addition to the macro stress tests for credit risk. While in the former shocks were given directly to asset quality (GNPAs), in the latter the shocks were in terms of adverse macroeconomic conditions. Also, macro stress tests were done at the system, major bank group and sectoral levels, whereas the sensitivity analysis was done at aggregated system and bank levels. While the focus of macro stress tests was credit risk, the sensitivity analysis covered credit, interest rate and liquidity risks. 15 For details of the stress tests, see Annex 2. 16 The shocks designed under various hypothetical scenarios are extreme but plausible. 17 The standard deviation of GNPA ratio is estimated from 10 years quarterly data. One SD shock approximates to 45 per cent increase in NPAs. 18 Restructures standard advances as of December 2014. 20 Private sector units consist of both major steel producers and relatively smaller and medium scale units such as sponge iron plants, mini blast furnace units, electric arc furnaces, induction furnaces, re-rolling mills, cold-rolling mills and coating units. 21 This would facilitate conversion of fines or low grade ore into high grade. 22 Data pertained to September 2014 quarter. 23 The income impact on the banking book considering the exposure gap of rate sensitive assets and liabilities, excluding AFS and HFT portfolios, are calculated for one year only. 24 Presently un-insured deposits are about 69 per cent of total deposits (Source: DICGC, Handbook of Statistics on Indian Economy). 25 The liquidity shocks includes withdrawals of a portion of un-insured deposits and along the demand for 75 per cent of the committed credit lines (comprising unutilised portion of sanctioned working capital limits as well as credit commitments towards their customers). 26 Stress tests on various shocks were conducted on a sample of 15 select banks. A same set of shocks was used for conducting top-down and bottom-up stress tests. Details of these are given in Annex 2. 28 Stress tests on derivatives portfolios were conducted for a sample of 20 select banks (different from other bottom-up stress tests). Details are given in Annex 2. 30 The four scenarios are: i) 0.5 SD shock in GNPA (classified into sub-standard advances), ii) 0.5 SD shock in GNPA (classified into loss advances), iii) 1 SD shock in GNPA (classified into sub-standard advances), and iv) 1 SD shock in GNPA (classified into loss advances). The SD was estimated using ten years data. 31 Data pertains to all deposit accepting NBFCs and non-deposit accepting NBFCs with assets size of ₹1billion and above. 32 Deposit taking NBFCs and non-deposit accepting NBFCs having asset size of ₹5 billion and above (classified as NBFCs-ND-SI). 33 The network model used in the analysis has been developed by Professor Sheri Markose (University of Essex) and Dr. Simone Giansante (Bath University) in collaboration with the Financial Stability Unit, Reserve Bank of India. 34 Banks, besides transacting among themselves over the call, notice and other short term markets, also invest in each other’s long term instruments. The interbank market as connoted in the current analysis is a total of all outstanding exposures (short term and long term) between banks. 35 Off balance sheet items have not been considered for estimating total assets. 36 The sample includes 22 AMCs and 21 insurance companies. 37 A tiered structure is one where different institutions have different degrees or levels of connectivity with others in the network. In the present analysis, the most connected are in the innermost core (at the centre of the network diagram in Chart 2.34). Banks are then placed in the mid core, outer core and the periphery (the respective concentric circles around the centre in the diagrams), based on their level of relative connectivity. Red and blue circles represent net borrower and net lender banks respectively. The sizes of the circles are weighted by net positions of the respective banks. The links between banks are represented by arrows which indicate the direction of the transaction outstanding. Incoming arrows (in-degrees) mean net receivables while out going arrows (out-degrees) mean net payables. The thickness of the arrows is weighted by the size of the exposures. 38 The connectivity ratio finds out how many actual connections exist in the network system relative to all possible connections in it. 39 Cluster coefficient is an extension of the connectivity ratio. It is based on the logic that if you have two neighbours (neighbours are banks to which direct links exist), then there is a high chance that your two neighbours are also known to each other. Suppose a bank (let us call it Bank B) has 5 neighbours (Ki), then the total possible links between these 5 banks are Ki(Ki-1), which in this case is 20. Now let us assume that in reality only 10 connections (Ei) exist between these 5 banks. Then the cluster coefficient for Bank B is Ei/Kii(Ki-1), which equals 50 per cent. The cluster coefficient for the entire network is the average of cluster coefficients of all the banks. 40 Data on AUM of insurance companies for March 2015 not available. 41 Systemic importance score has been derived on the basis of a simple average of proportional share of each bank in four areas: exposure in off balance sheet items, overall size, interconnectedness and share in the payment and settlement system. 42 Stressed asset ratio has been estimated as gross NPAs plus restructured standard assets to gross loans and advances. | |||||||||||||||||||||||||||||||||||||||||||||||||||||||||||||||||||||||||||||||||||||||||||||||||||||||||||||||||||||||||||||||||||||||||||||||||||||||||||||||||||||||||||||||||||||||||||||||||||||||||||||||||||||||||||||||||||||||||||||||||||||||||||||||||


Install the RBI mobile application and get quick access to the latest news!
Scan the QR code to install our app


Page Last Updated on:


