 IST,
IST,


Chapter II : Financial Markets
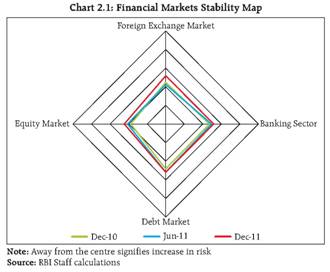
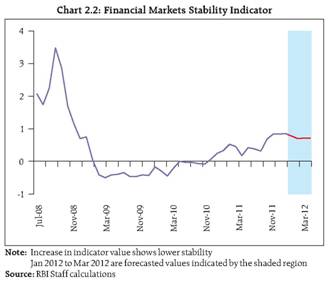
Systemic risks facing the global and domestic financial system have heightened of late. There is significant deterioration in financial market conditions, for both sovereign and non-sovereign sectors, as a result of downgrades by rating agencies and poor economic outlook. Funding markets for short and long term finance in most currencies have become stressed with financial and non-financial firms facing significant challenges in raising longer term funds. Financial markets are trading with a downward bias on the belief that effectiveness of monetary and fiscal intervention is considerably lower in advanced economies. High levels of volatility are unnerving market participants abroad. The fallout of these developments is starting to impact overseas borrowings by financial and non-financial firms in India. The Indian equity and foreign exchange markets witnessed large corrections attendant with high volatility. The resultant impact on investor sentiment has been offset partially through a recovery in Foreign Direct Investments (FDI) flows this year. Higher than expected government borrowings, coupled with loss in growth momentum, could stress domestic financial markets though. Rising concerns in financial markets 2.1 Financial markets were orderly in India but conditions worsened during the period since the release of the previous Financial Stability Report in June 2011. Endogenous risks have risen moderately during this period. However, external risks have escalated impacting domestic market stability. Among domestic markets, the foreign exchange and equity markets exhibited significant stress. The Financial Markets Stability Map1 and Financial Markets Stability Indicator (FMSI)2 (Charts 2.1 and 2.2)3 which take into account not just market variables but also funding liquidity conditions in the Indian financial system have started to reverse course. A forecast of the FMSI suggets the continuance of the current conditions until March 2012.
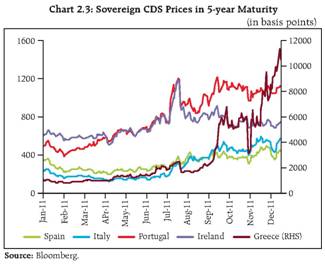
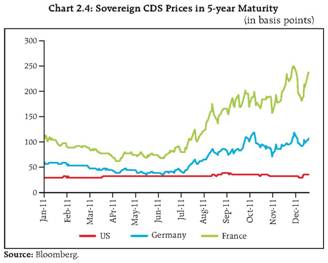
Global sovereign bond markets have strayed into uncharted territory 2.2 The financial crisis caused considerable deleveraging of private sector balance sheets and the resultant slack was sought to be offset with fiscal expansion. With the global economy entering its fifth year since the start of the crisis, a faltering economic recovery has further stressed public finances. Apart from Greece; Portugal and Ireland have also availed bailouts. In addition, Spanish and Italian sovereign bond markets are witnessing excessive volatility (Chart 2.3). There are indications that the European debt crisis which emanated in its periphery is spreading to the core. Even French and German Credit Default Swap (CDS) prices reflect the rising costs of bailouts in Europe (Chart 2.4).
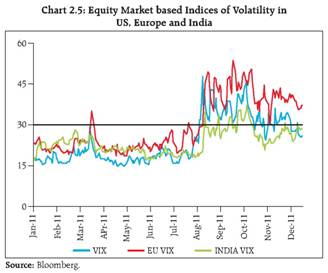
2.3 The markets for some European sovereign bonds are dislocated and in case of Greece, practically shut. The use of the European Financial Stability Fund is being enhanced and the European Central Bank is using nonconventional monetary tools in tackling the crisis. In US, the downgrade of US treasuries ironically set-off a slide in all markets except in US treasuries themselves. US treasury bond yields have fallen to historically low levels. ...Causing volatility thresholds to be breached
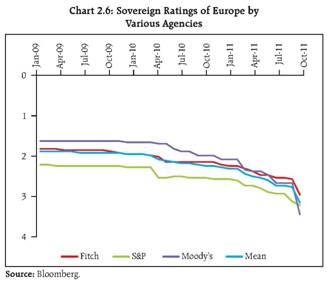
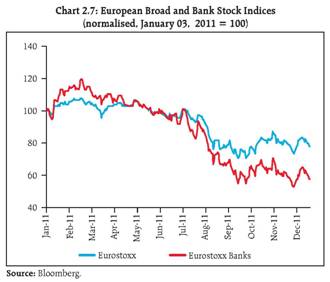
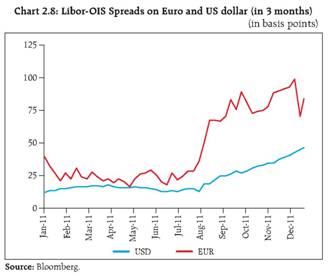
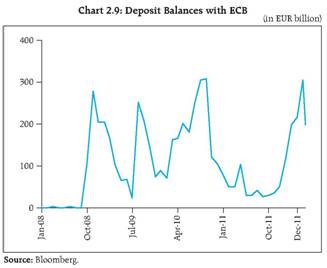
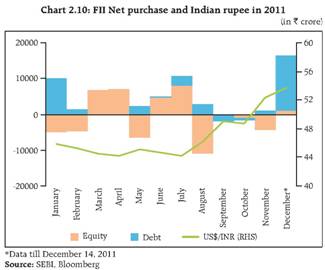
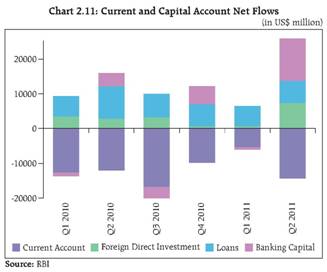
Fiscal stress has permeated into health of banks... 2.5 Recent downgrades in US and Europe (Chart 2.6) highlight the potential contagion from deterioration in sovereigns' credit quality and related market pressures. Sovereign credit risk is having a knock-on impact on banks and their funding markets in Europe. During periods of increased sovereign credit risk, a bank faces challenges in accessing capital markets to raise term funding. This is because the credit quality of a sovereign and its economic performance are key inputs into the strength of a banking system. As a result, bank stocks in Europe have corrected more sharply than broad market indices (Chart 2.7). Leading to disruptions in LIBOR markets... 2.6 As a result of the sovereign debt situation, banks are considerably less inclined to lend to each other. This is reflected in three aspects of the London Inter Bank Offered Rate (LIBOR) markets: amount, cost and maturity of lending operations. The turnover in the market has fallen, costs have risen and maturities of interbank lending are becoming shorter. The LIBOR-OIS (London Interbank Offered Rate - Overnight Indexed Swaps) spread, in both US dollars and Euros, has widened (Chart 2.8). Owing to the reduced appetite for counterparty risk, banks are preferring to park their surpluses with the ECB. Deposit balances with ECB are growing rapidly (Chart 2.9). ...and US dollar funding becoming dearer for domestic entities 2.7 Cross-country holdings of assets by banks are sizeable and credit risks have spilled over to banks from other countries, including India. Cross-border lending for trade finance and capital investment to Indian firms has fallen considerably. There is some anecdotal evidence about difficulties faced by both financial and non-financial firms in India in raising foreign currency borrowings. European bank funding concerns could pose challenge for Indian firms and banks in terms of raising foreign capital for their operations. The Cross Currency Basis Swap (CCBS) in EUR/US$ has been trading at a large discount reflecting the escalation in costs of US dollar funding for European banks. This additional cost in the form of discount on the CCBS could be passed on to Indian banks. Downward bias owing to weaker fiscal and monetary backstops in advanced economies Investors flip from risk seeking to risk aversion behaviour 2.9 Prior to the current round of sovereign and bank stress, investors were in risk seeking mode. Low interest rates in advanced economies earlier, spurred a search for yield. There were signs of portfolios being oriented towards earning higher return by investing in riskier assets like leveraged loans, distressed debt and high yield bonds. Backed by a stronger fiscal position and brighter economic prospects, the higher yielding emerging market assets like Indian bonds and equities were beneficiaries of this trend. With rise in stress, investors are reversing their actions fast (Charts 2.10 and 2.11).
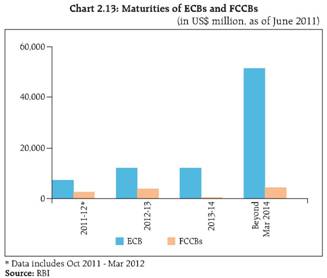
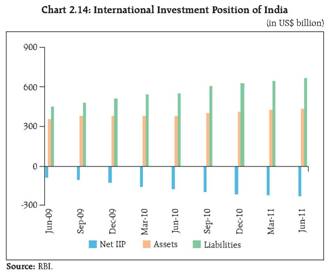
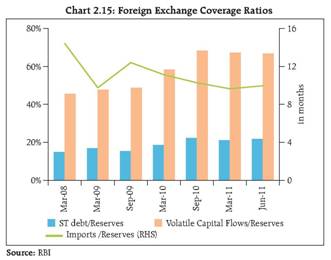
Contagion risk in Indian government bond market capped ECB Hows may be impacted 2.11 External Commercial Borrowings (ECBs) are necessary to bridge the gap between domestic savings and investment. High interest rate differentials between domestic and overseas borrowings also incentivise firms to borrow abroad resulting in high currency mismatches on some corporate balance sheets. The recent tensions arising from Europe may, however, potentially impact the flows under ECBs. Redemption pressure for FCCBs exists....sufficient precautions taken 2.12 FSR for June 2011 had highlighted the risks faced by many firms on account of Foreign Currency Convertible Bonds (FCCBs) falling due for redemption in the near future (Chart 2.13). It had also pointed out the potential systemic risk arising from many firms facing funding crunch as their equity valuations had dropped considerably making redemption necessary. Foreign sources of lending are getting reduced as a result of rise in risk aversion (Following the European debt crisis). Further, the Indian rupee has depreciated sharply in recent months, thus raising the cost of redemption. The FCCBs, raised in pre-financial crisis years carrying zero or low coupons, would need to be replaced with domestic borrowing, whose rates are much higher today, To mitigate the hardships faced by FCCB issuers, the Reserve Bank, in consultation with the Central Government, has permitted the buyback of FCCBs at a discount, extended the window for such buyback and allowed firms to refinance from overseas borrowers under the automatic route. Proposals for restructuring of FCCBs not involving change in conversion price are being considered under the approval route depending on the merits of the proposal. Net external liability position of the country has risen... 2.13 Net claims of non-residents on India (international financial assets less international financial liabilities) stood at US$ 233.6 billion in the quarter ended June 2011, an increase of US$ 14.2 billion over the quarter ended March 2011. This was due to a large increase in external liabilities, mainly direct investments and ECBs even though reserve assets and direct investment abroad also increased (Chart 2.14). Translation losses on unhedged portions of these liabilities owing to depreciation of Indian rupee cannot be ruled out. ...while foreign exchange reserves have remained stable 2.14 Size of reserves is an important parameter in gauging the ability to absorb external shocks. With the changing profile of capital flows, the traditional approach of assessing reserve adequacy in terms of import cover needs to be broadened to include a number of parameters which take into account the size, composition and risk profiles of various types of capital flows as well as the types of external shocks to which the economy is vulnerable. The trend in some reserve coverage ratios are presented in chart 2.15.
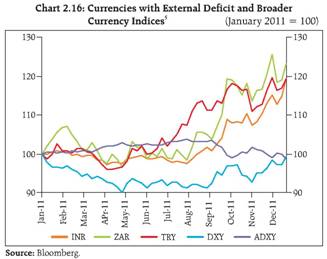
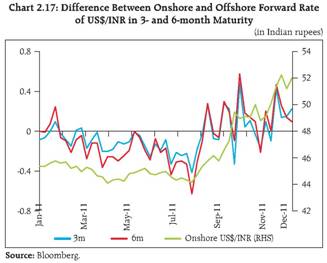
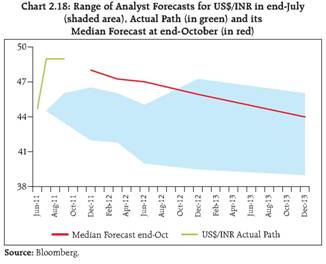
Exchange rate has moved out of an established range 2.15 Concerns over European debt sustainability have led to broader issues like the future of the monetary union itself. Further, the lack of political consensus on tackling the rising sovereign debt and poorer growth prospects in advanced economies caused a flight of capital to safe havens, thus deteriorating sentiment for emerging market currencies like the Indian rupee, Currencies of emerging markets that have a current account deficit like India, Turkey and South Africa, have, however, depreciated more than those with a current account surplus (Chart 2.16). In a repeat of the characteristic exhibited in the past, after a long period of stability, the exchange rate has broken out of an established range to touch historic highs. At times like these, attention often shifts to developments taking place in the offshore Indian rupee or non-deliverable forward (NDF) market. The difference between the prices of the onshore forward market and NDF market for Indian rupee has been changing over a period of time (Chart 2.17). 2.16 Market expectations about the path of the exchange rate have been belied (Chart 2.18). The Reserve Bank's exchange rate policy has come into focus as a result of the large swings in the exchange rate. It has been clarified that the policy aims to manage volatility in exchange rate and to ensure that exchange rate volatility does not impair macroeconomic stability. The sharp depreciation of the Indian rupee is driven by global dynamics, and the extent and direction of its movement will depend on credible resolution to external situation, particularly, the sovereign debt problem in Europe.
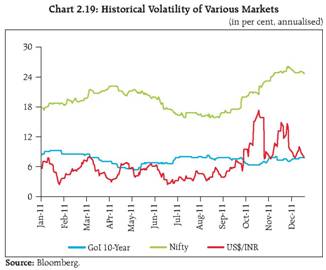
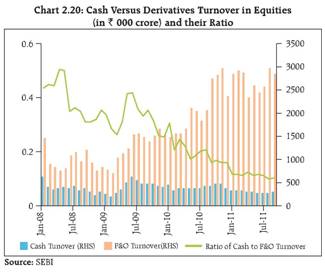
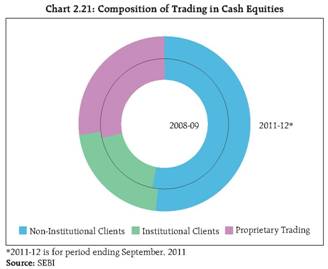
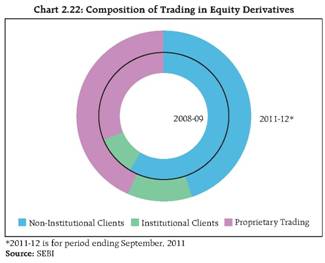
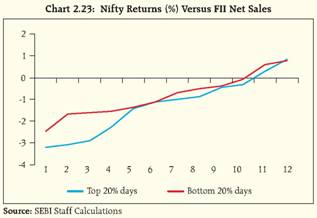
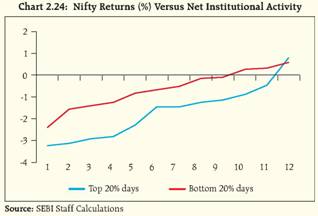
Concerns on unhedged corporate exposures being addressed through preventive actions 2.17 In 2008, a break-out from established trading ranges of the Indian rupee, similar to the recent depreciation, had caught several firms with large unhedged exposures unaware. Translation and transaction losses on their derivatives exposures drove many of them (in textiles for instance) into greater difficulty. The Reserve Bank has since tightened foreign exchange regulations to prevent the recurrence of such incidents and sale of some complex derivative structures has been barred. It has proposed6 that while extending fund based and non-fund based credit facilities to corporates, banks should rigorously evaluate the risks arising out of unhedged foreign currency exposure of the corporates and price them in the credit risk premium. Banks may also consider stipulating a limit on unhedged position of corporates on the basis of their Board's approved policy. At the same time, reporting of data by banks in respect of unhedged exposures is being strengthened. Exchange rate and equity market coupling may pose problems 2.18 Fortunes of the Indian rupee and domestic equity markets are intertwined. During times of risk aversion, correlation between the two is much higher. FIIs' selling in equities is matched by their demand for US dollars to repatriate capital to their own jurisdictions. This externality that the equity market gyrations pose on a macroeconomic variable like the exchange rate is not conducive to financial or macroeconomic stability (Chart 2.19). The interaction between two of the biggest institutional investors viz., FIIs and Mutual Funds is also interesting, with the latter often being a foil for FII activity (Box 2.1). Dominance of derivatives trading in Indian equities 2.19 The Indian securities market has undergone structural changes in both share and composition of cash as well as the derivatives segment. The average daily cash market turnover and delivery on stock exchanges during the last two years have been declining. This is in contrast to a rapid growth in value of traded contracts in equity derivatives, where index options have replaced index futures as the most traded contracts. The ratio of cash market turnover to derivatives market turnover has dipped in recent months (Chart 2.20). The transformation in composition of trading activity is also notable. While the share of institutions has remained stable, that of non-institutional clients including retail clients has fallen sharply in the cash segment (Charts 2.21 and 2.22). The share of proprietary trading in derivatives segment has gone up considerably from 35 per cent in 2008-09 to 48 per cent in 2010-11 whereas the share of non-institutional clients has declined from 59 per cent to 42 per cent during the same period. In the interest of financial stability, these micro-level developments need to be monitored as potential sources of systemic risk. Box 2.1: Trading Behaviour of FIIs and Mutual Funds in Indian Equity7 An important aspect of development of securities market in India in the last two decades has been the growing participation of institutional investors, both foreign as well as domestic. FIIs and Mutual Funds (MFs) together hold more than 10 per cent of equity market capitalisation and contribute to more than 20 per cent of the total turnover (which translates to over 65 per cent of delivery turnover as these institutions trade only on delivery basis). A preliminary study of impact of trading by FIIs and MFs revealed that equity markets are likely to be more vulnerable to FII flows. In light of the above, role played by MFs when there is heightened market activity by FIIs and its impact on the market was studied. During January 2010 - September 2011, there are 59 days when FIIs have sold more than ` 500 crore of equity on a net basis. On these 59 days, MFs were net purchasers on 39 days, i.e. FIIs and MFs had opposite investment pattern. This could possibly be attributable to the fact that whereas FIIs invest across economies, MFs invest mostly in domestic markets and hence the difference in investment perspective. The ratio of Net MF investments to Net FII investments is only 0.22. The Nifty returns posted on Top 20 per cent and Bottom 20 per cent days, in terms of FII net sales and net institutional activity (FII net sales are net of MF net activity, whether buy or sale) are presented in charts 2.23 and 2.24 below:
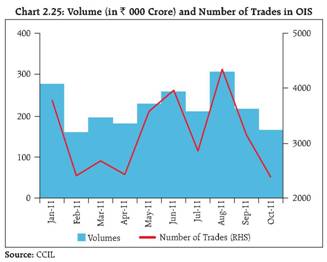
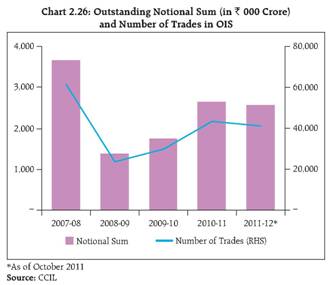
It can be observed that in both of the cases, top 20 per cent days post more negative returns than bottom 20 per cent, indicating some degree of correlation between the FII net sales/ net institutional activity and Nifty returns. The difference between the returns of top 20 per cent and bottom 20 per cent days were more prominent in case of net institutional activity, indicating that correlation between net institutional activity and Nifty returns may be stronger than that between Nifty returns and FII net sales alone.
Results of Spearman's Rank Correlation Test to ascertain the extent of correlation are tabulated below:
As can be seen, the co-efficient of correlation between Nifty returns and net institutional activity is statistically significant at 95 per cent confidence level whereas that between Nifty returns and FII net sales alone is not statistically significant. This preliminary analysis indicates that even on the days of heightened FII net sales, MF net activity plays a considerable role in price formation, although this finding needs to be buttressed with greater statistical analysis. In India, however, share of MFs in total financial assets is not substantial as brought out in the Financial Stability Report of March 2010. Augmenting the asset base of equity mutual funds, by encouraging more participation from retail clients for whom the mutual fund product was primarily designed, would deepen the institutional participation in the market. This would facilitate MFs playing more significant role in stability of Indian equity markets. Risks from pledging of shares by promoters of Indian companies 2.20 In India, most businesses are family-run and promoters play an active role in managing the affairs of firms. The average promoter holding in the listed companies is around 48 per cent. It has been observed that the equity prices of many companies in which the promoters had pledged significant portions of their shares, fell faster than the broader market on account of speculation about whether lenders were selling shares after margin call failures. Such events affect the confidence of investors and are, therefore, not conducive to financial stability. In light of the same, SEBI has prescribed disclosure requirements for promoters by making it mandatory for them to disclose the details of pledged shares and release or sale of pledged shares to the company and the company shall, in turn, inform the same to the public through the stock exchanges. Recently, it has also widened the scope of such disclosures to include encumbrances. Lack of transparency regarding the pledging of shares by promoters in respect of reasons for pledging, price at which pledge has been made and conditions for margin calls and sale by lender could contribute to uncertainty in the market. OIS markets being strengthened through guaranteed settlements 2.21 India's OTC (Over The Counter) interest rate swap markets largely comprise Overnight Indexed Swaps (OIS), and are used by banks, primary dealers and firms (Chart 2.25). The significantly large outstanding notional value of swaps in India (Chart 2.26) is being addressed through 'trade compression' by the Clearing Corporation of India Limited (CCIL). In addition, it has been proposed that the settlement of cash flows would be guaranteed by CCIL. This takes care of a large part of systemic risks emanating from this market. CCIL would be collecting an 'initial margin' for Potential Future Exposure on swap positions and also 'variation margin' for changes in mark-to-market positions of counterparts to a trade. Concluding Remarks 2.22 Domestic financial markets remained orderly but faced several headwinds from adverse developments in global financial markets. The turmoil in sovereign bond markets in Europe has spread to its banking system, a major source of capital for domestic firms. Risk aversion and flight to safety have replaced risk seeking behavior among international investors on account of higher counterparty risk perceptions and rating downgrades of sovereigns and banks. This has resulted in a large reversal of capital flows, including banking capital, and consequent difficulties faced by Indian firms and banks in raising foreign currency denominated borrowings, They have also triggered a sharp fall in domestic equity and exchange rate market accompanied by high volatility. The domestic bond markets, meanwhile, remained largely immune to these overseas developments. 2.23 Depreciation of the Indian rupee, widening current account deficit and rising net international liability position, though not a cause for undue immediate concern, have enhanced the vulnerabilities of the external sector. The environment for carrying out refinancing of FCCB (and ECB) liabilities by firms over the next few quarters has worsened due to correction in domestic equity markets, depreciation of the Indian rupee and rise in domestic interest rates. Translation and transaction exposures that remain unhedged could cause hardships to some firms. 2.24 The structure of Indian equity market, the composition and share of trading by its participants is evolving over a period of time. The rise in share of derivatives trading relative to cash market and higher proportion of proprietary trading are developments that need to be monitored from a systemic point of view. Authorities need to prevent securities market dislocations arising from information asymmetry. It needs to be ensured that there is complete disclosure of private pledging of shares by promoters, especially in case of family run business. 1 Financial Markets Stability Map is a visual depiction of increase in stress in various markets. A movement of the variable away from the center shows that stress as measured through volatility is increasing. It takes into account conditions in equity, debt and foreign exchange markets. In addition, funding conditions for banks is also taken into account in the Map. 4 VIX is an index that reflects the market's estimate of future volatility. It is based on prices of a wide range of strikes on options on the US S&P 500 stock market index. Similarly, the EU VIX and India VIX used in the chart are based on prices of options on the European Eurostoxx and Indian Nifty indexes. respectively. It is often referred to as "fear gauge" 5 DXY or US Dollar Index indicates the general value of the US dollar against major world currencies, ADXY stands for the Bloomberg - JP Morgan Asia Dollar Index and is a trade and liquidity weighted index of the value of Asian currencies, Chinese yuan, Honk Kong dollar, Indian rupee, Korean won etc. against the US dollar. Rise in chart implies depreciation except for DXY & ADXY where it denotes appreciation of US dollar and Asian currencies respectively, ZAR is South African Rand and TRY is New Turkish Lira. |
||||||||||||||||||||||||||||||||||||||||||||||||||||||||||||||

Install the RBI mobile application and get quick access to the latest news!
Scan the QR code to install our app


Page Last Updated on:


