 IST,
IST,
Chapter III : Financial Institutions: Soundness and Resilience
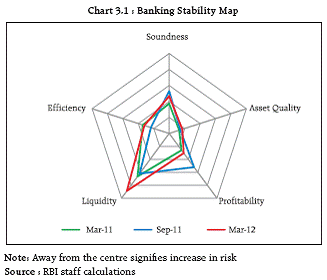
The stability of the banking sector deteriorated marginally in the period since September 2011. The soundness indicators of banks, however, remained robust. Asset quality pressures persisted while credit growth decelerated, largely reflecting the slowdown in the economy. As the divergence between credit and deposit growth widened, banks’ reliance on borrowed funds increased, heightening associated liquidity risks. Going into 2012-13, the operating conditions for the Indian banks are expected to remain challenging given the weakening global economic outlook, adverse domestic macroeconomic conditions and policy uncertainties. Banks in India are likely to be affected due to deleveraging in advanced countries though the direct impact is expected to be limited. Credit growth of the non banking financial companies has decelerated. Regulatory restraints have been put in place to rein in the risks posed by exposure of banks to gold loan companies. The stress tests carried out on banks, incorporating a range of shocks, revealed deterioration in their capital position as compared with the baseline scenario, but the banking system remained resilient even under extreme stress scenarios. A series of scenarios and sensitivity stress tests applied on select banks’ derivatives portfolio revealed that they are well positioned to manage the resultant market risks. Soundness of Financial Institutions Banking Stability Map and Indicator1 Risks to the banking sector remain elevated 3.1 Vulnerabilities in the banking sector exhibited a mixed trend at the end of March 2012 as revealed by the Banking Stability Map. The soundness and profitability indicators showed some improvement over the position as at end September 2011. Soundness indicators, however, showed a deterioration vis-à-vis their position in March 2011. Strains in asset quality intensified. The liquidity deficit added to the stress in the banking sector (Chart 3.1).
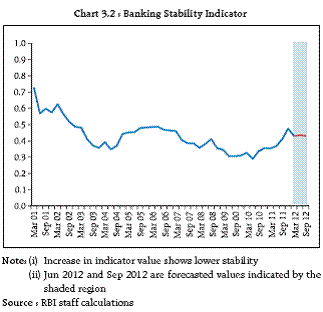
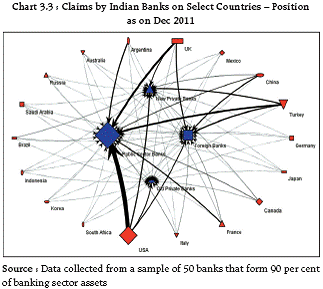
3.2 The Banking Stability Indicator, as at end March 2012, pointed to deterioration in the stability of the banking sector, compared with its position in September 2011. A forecast of the indicator for the next two quarters surmised that the risks to the banking sector are likely to remain elevated in the near term (Chart 3.2).
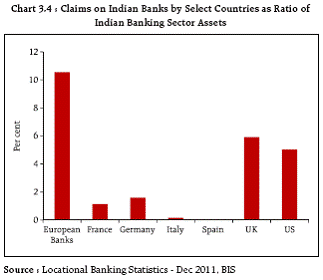
Deleveraging trends in global banking expected to continue... 3.3 The confluence of funding strains and sovereign risks led to fears of a precipitous deleveraging process that could hurt financial markets and the wider economy via asset sales and contractions in credit (Chapters I and II). Many European banks have announced mediumterm business plans for reducing assets. The impact is likely to differ significantly across regions, with larger effects expected in emerging Europe than in Asia or Latin America (Table 3.1). In the Indian context, the claims of European banks, amounting to US$ 146 billion, formed 53 per cent of total consolidated foreign claims. Of this, 56 per cent pertained to claims of banks in United Kingdom. … with limited impact possible for domestic credit availability 3.4 The direct impact of the Eurozone crisis on Indian banks is expected to be limited. The Indian banking sector is dominated by domestic banks with foreign banks accounting for only 8 per cent of total banking sector assets and 5 per cent of banking sector credit. There could, however, be indirect impact on Indian banks due to their exposures to other countries, especially in the Eurozone (Charts 3.3 and 3.4). 3.5 The direct impact of deleveraging is not expected to be significant on domestic credit availability although specialised types of financing like structured long term finance, project finance and trade finance could be impacted.
Scheduled Commercial Banks (SCBs) Credit and deposit growth weakens, reverberating slowdown concerns in the economy 3.6 Balance sheet of SCBs expanded by 14.5 per cent during 2011-12, lower than the growth of 18.8 per cent for 2010-11. The deceleration was reflected in the growth rates of both credit and deposits. Credit growth in the banking sector, at 16.3 per cent in 2011-12, was lower than the 22.6 per cent recorded in 2010-11. Deposit growth stood at 13.7 per cent and 17.7 per cent for the two years respectively. The growth rate of deposits in 2011-12 was the lowest recorded in the past 10 years. 3.7 These trends broadly reflected the slowdown in the economy, as the nominal GDP growth decelerated from 18.8 per cent in 2010-11 to 15.4 per cent in 2011-12. Benchmarking of the interest rates on small savings schemes to market determined rates of interest as well as availability of liquid funds with higher yield and associated tax benefits may have also contributed to the deceleration in growth rate of deposits of banks. Slowdown in credit driven by slowdown in some specific sectors… 3.8 The deceleration in credit growth was particularly marked in case of the priority sector, real estate and infrastructure segments, which together account for nearly 60 per cent of banking sector credit (Chart 3.5). … and amongst public sector banks 3.9 The deceleration was most pronounced in the credit growth of Public Sector Banks (PSBs) while the old private sector banks recorded a sharper credit growth of 24 per cent. Expansion of credit to retail and real estate sectors accounted for the bulk of the growth in credit among the old private sector banks – a trend which would need to be carefully monitored, if sustained (Chart 3.6). CD ratio increased consequent on divergence between credit and deposit growth rates … 3.10 The credit to deposit (CD) ratio increased to 76 per cent as at end March 2012 (as against 73.5 per cent as at end September 2011 and 74.3 per cent as at end March 2011) driven by the divergence between deposit and credit growth rates in 2011-12. The incremental CD ratio also remained high at 88 per cent. The incremental Investment to Deposit (ID) ratio rose sharply on the back of a 17 per cent growth in investments (Chart 3.7).
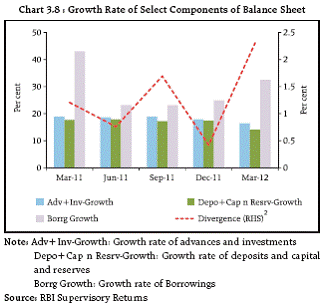
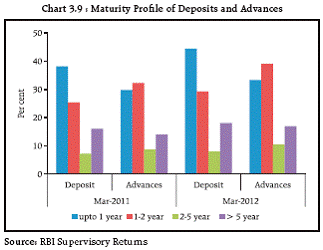
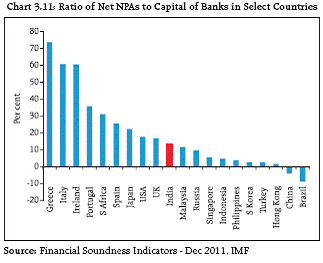
… and banks’ reliance on borrowed funds increased 3.11 Banks, during 2011-12, increasingly relied on borrowings to fund their credit and investment growth. This was evidenced by the increasing gap between the combined growth of advances and investments and that of deposits and capital (Chart 3.8). This was accompanied by the growing short term maturity mismatches in the balance sheet of banks (Chart 3.9). The rollover and liquidity risks associated with these trends will need to be assessed and managed. Capital ratios recover as credit growth slows 3.12 The capital ratios of the SCBs improved marginally since September 2011, primarily due to slowdown in growth of credit. There was, however, a marginal deterioration in comparison with the position as on March 2011. Capital to Risk weighted Assets Ratio (CRAR) fell from 14.2 per cent as at end March 2011 to 13.5 per cent as at end September 2011, but recovered to 14.1 per cent as at end March 2012. Core CRAR fell from 10 per cent as at end March 2011 to 9.6 per cent as at end September 2011, but rose to 10.3 per cent as at end March 2012 (Chart 3.10). Asset quality concerns persist as NPA ratios remain high 3.13 Asset quality concerns persist as the growth in non performing assets (NPAs) accelerated and continued to outpace credit growth. The respondents of the second Systemic Risk Survey conducted by the Reserve Bank (Chapter V) also identified asset quality as one of the critical risks faced by the Indian banking sector. 3.14 The Gross NPA ratio increased to 2.9 per cent as at end March 2012, as against 2.4 per cent as at end March 2011 and 2.8 per cent as at end September 2011. Net NPA ratio stood at 1.3 per cent as at end March 2012, as against 0.9 per cent as at end March 2011 and 1.2 per cent as at end September 2011. The ratio of NPAs (net of provisions) to capital also falls short when benchmarked against the peer economies (Chart 3.11).
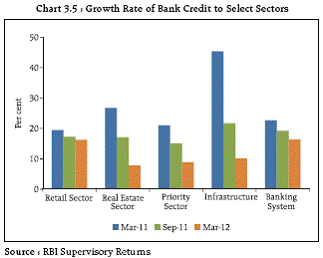
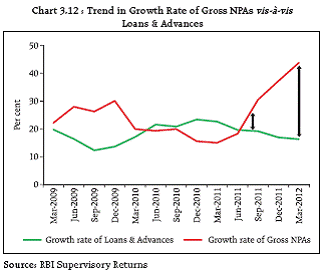
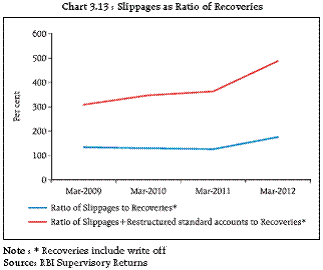
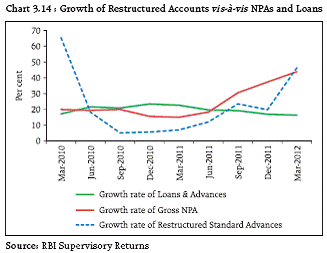
Growth in NPAs outpaced credit growth by a wide margin 3.15 NPAs grew at 43.9 per cent as at end March 2012, far outpacing credit growth of 16.3 per cent. The divergence in growth rate of credit and NPAs has widened in the recent period, which could put further pressure on asset quality in the near term (Chart 3.12). Accretions to NPAs accelerated 3.16 The slippage ratio3 increased to 2.1 per cent as at end March 2012 from 1.6 per cent at March 2011 and 1.9 per cent at September 2011.The ratio of slippages plus restructured standard advances to recoveries (excluding up-gradations) also exhibited an increasing trend underscoring the concerns with respect to asset quality, and the need for proactive management of NPAs by banks (Chart 3.13). Restructuring of advances is on the increase… 3.17 Due to a spillover of the global financial crisis to the Indian economy, certain relaxations 4 were permitted on restructuring on a temporary basis in the later part of 2008-09, which helped in tiding over the difficulties faced by the real sector. However, it led to a significant increase in the level of restructured standard assets during 2008-09 and 2009-10, after which there was a deceleration in the amount of restructured assets. In 2011-12, the quantum of restructured accounts has again increased sharply, outpacing both credit growth and growth rate of gross NPAs (Chart 3.14).
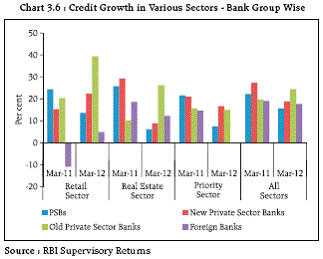
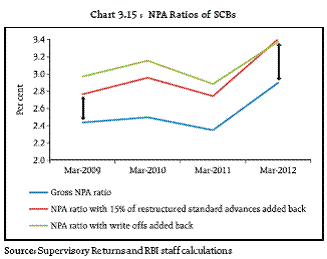
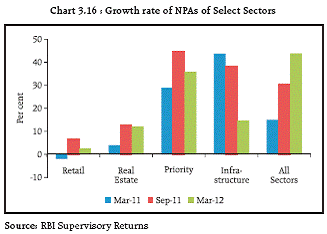
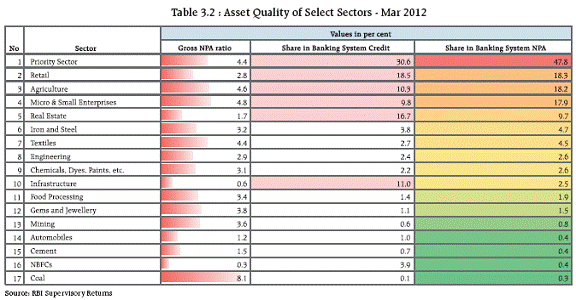
…and could weigh on NPA ratios, going forward 3.18 An empirical analysis of the asset quality of banks’ advances portfolio was conducted by adding back the advances written off by banks during the last five years and (separately) assuming that 15 per cent of restructured accounts slip into impaired category. The resultant ratios exhibited an increasing trend that calls for a closer look at the underlying management of NPAs by banks (Chart 3.15). Asset quality in some key sectors remained under strain 3.19 The increase in gross NPAs for the year ending March 2012 was largely contributed by some key sectors viz., priority sector, retail and real estate. The growth rate of NPAs in the infrastructure segment, however, decelerated as at end March 2012, partially on account of base effects and sharp moderation in credit to infrastructure projects (Table 3.2 and Chart 3.16). Certain sectors like power and airlines saw significant increase in impairments (Box 3.1).
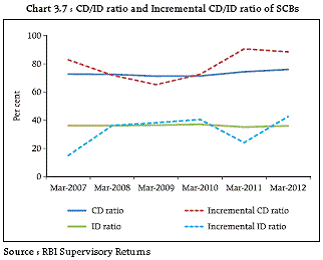
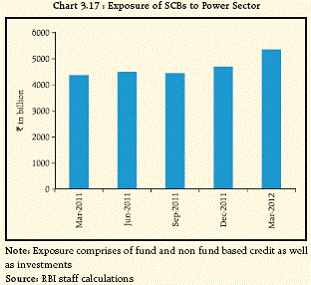
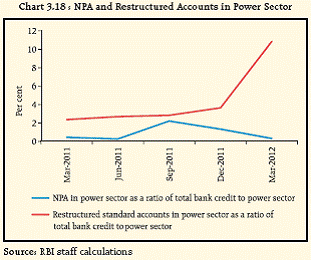
Box 3.1 : Power and Airlines : Sectors under Stress5 The risks faced by banks on their exposure to the power sector due to rising losses and debt levels in state electricity boards (SEBs) and the shortage of fuel availability for power generation were discussed in the FSR for December 2011. Potential pressures on asset quality have intensified with restructuring in bank credit to power sector registering a sharp increase, especially in the last quarter of 2011-12, even as impairments as a ratio of outstanding credit has moderated. Meanwhile, the losses of SEBs have also been mounting6, adding to the concerns about asset quality in the sector (Charts 3.17 and 3.18).
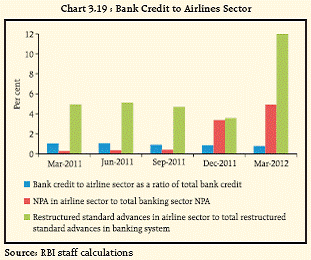
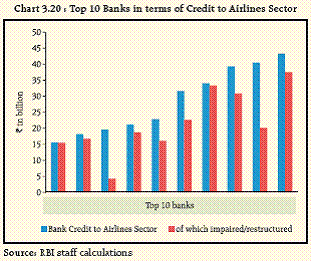
Asset quality of banks’ credit to the airlines industry came under some stress in recent periods, driven largely by the performance of some specific airline companies. Sharp increases in impairment and restructuring in the sector saw the share of this sector in aggregate banking system NPA and restructured assets rise disproportionate to its share in banking sector credit (Chart 3.19). There was significant concentration discernible in distribution of credit to the airline sector as ten banks accounted for almost 86 per cent of total bank credit to this sector. As at end-March 2012, nearly three quarters of the advances of banks, which have an exposure of above `10 billion to the airline industry, were either impaired or restructured. PSBs accounted for the major share of these exposures (Chart 3.20).
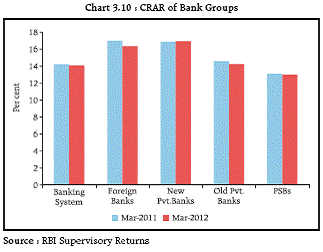
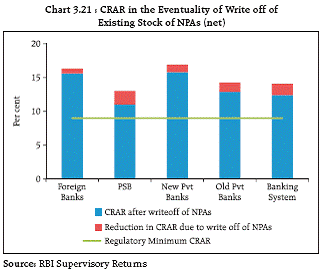
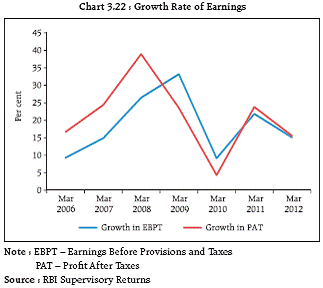
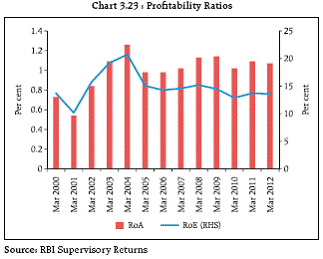
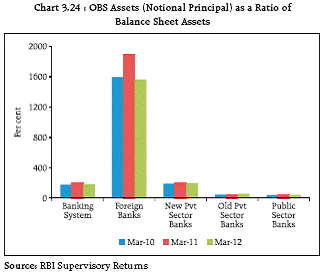
Going forward, the sectors are likely to continue facing funding constraints and could also be affected by prevalent policy uncertainties. These could pose challenges to the asset quality of credit to these sectors. Further strains on asset quality could emerge; though the strong capital position provides cushion 3.20 The muted economic backdrop and global headwinds could lead to further deterioration in asset quality. The position is not alarming at the current juncture and some comfort is provided by the strong capital adequacy of banks which ensure that the banking system remains resilient even in the unlikely contingenc y of having to absorb the entire existing stock of NPAs (Chart 3.21). A series of credit risk stress tests also testify to the resilience of banks (paragraphs 3.43 to 3.45). Profitability indicators display mixed trends 3.21 SCBs continued to register healthy profits, though the growth rate of earnings has decelerated (Chart 3.22). Return on assets (RoA), return on equity (RoE) and net interest margin (NIM) have declined marginally as at end March 2012, relative to end March 2011 (Chart 3.23). Going forward, the growth of earnings could be affected due to lower credit off-take and asset quality concerns. Interest rate swaps dominate off balance sheet assets of banks 3.22 The aggregate notional amount of off balance sheet (OBS) assets of the SCBs far exceeded the size of their on-balance sheet assets (Chart 3.24). The distribution of total OBS assets (in terms of notional amount) showed concentration of about 64 per cent in foreign banks followed by 17 per cent in case of PSBs. In the case of derivatives, foreign banks constituted 70 per cent of total notional amount, followed by new private sector banks at 16 per cent. Among the OBS constituents, the most prominent segment was Interest Rate Swaps (IRS).
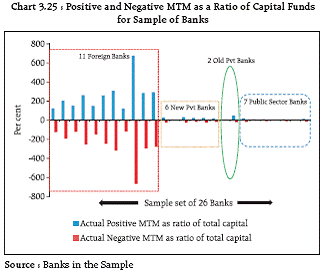
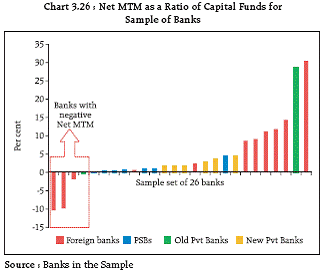
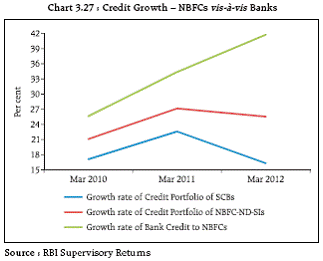
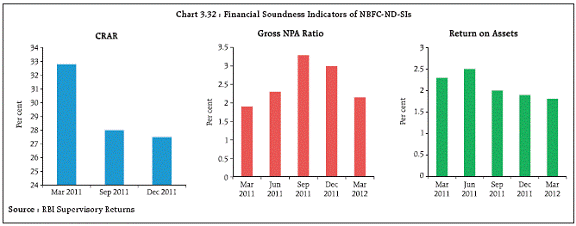
Banks geared to absorb market risks from their derivatives portfolio; will need to manage the resultant credit risks 3.23 An analysis of derivatives portfolio of a sample of banks7 revealed that most banks reported a positive net mark-to-market (MTM) position. The dominance of foreign banks in the derivatives segment was evident as the proportion of gross positive as well as negative MTM to capital stood, on an average, at around 250 per cent for foreign banks compared with 16 per cent in case of the other banks in the sample. Net MTM as a ratio of capital varied between a positive of 30 per cent to a negative of 10 per cent (Charts 3.25 and 3.26). 3.24 A series of stress tests was carried out on the derivatives portfolio by the select banks based on a common set of historical scenarios and random sensitivity shocks (Box 3.2). The post-stress net MTM position was positive for most banks suggesting that the banks are well geared to absorb adverse market movements. However, banks remained exposed to the risks of counterparty failure, especially in case of disputes with clients over payment, as had been evidenced in the past. Non Banking Financial Companies (NBFCs) Credit growth decelerated amidst declining asset quality and profitability 3.25 NBFCs experienced deceleration in growth rate of credit though the credit growth continued to outpace that of the banking sector. Bank credit to NBFCs accelerated as did the reliance of NBFCs on bank credit as a source of funding. This could pose risks for NBFCs if banks are not in a position or unwilling to extend credit to the sector (Chart 3.27). 3.26 The financial soundness indicators of systemically important non-deposit taking NBFCs (NBFC-ND-SIs) revealed a deteriorating trend with respect to soundness, asset quality and profitability (in terms of RoA). The CRAR remained above the regulatory requirement of 15 per cent, though it declined over the review period, (Chart 3.32). The downward movement in CRAR could partially be explained by the increasing asset base of the NBFCs. Further, the RoA remained healthy at around 2 per cent.
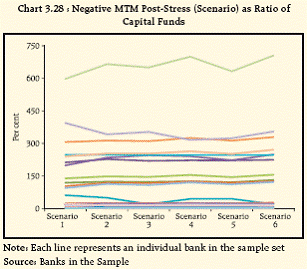
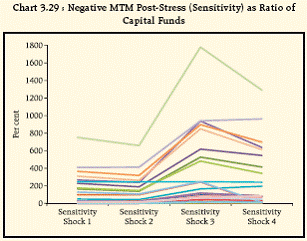
Box 3.2 : Stress Testing of Derivatives Portfolio of Select Banks A stress testing exercise on derivatives portfolio of a cross section of banks was undertaken. The stress tests consisted of six historical scenarios and four interest rate and exchange rate sensitivity shocks8. The impact of the tests exhibited considerable variance across banks and across bank groups. In terms of increase in negative MTM, foreign banks were impacted significantly while the impact on the rest of the bank groups was muted. Further, the shocks used for sensitivity analysis caused the maximum stress, in case of most banks, relative to the historical scenarios (Charts 3.28 and 3.29).
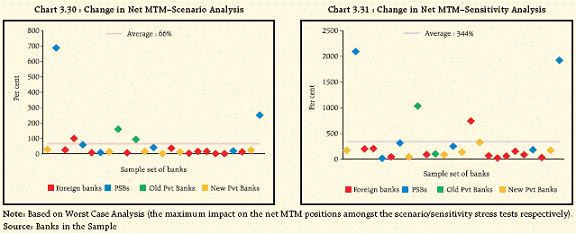
The impact on the net MTM positions of banks in the sample, post application of the stress conditions, was observed to be relatively muted in most cases. The shocks used for sensitivity analysis caused the maximum stress for most banks relative to the historical scenarios with the average change in Net MTM being around 344 per cent for the sensitivity analysis compared with 66 per cent for scenario analysis. However, there were a few outlier banks where the impact was significant and these banks would need to carefully manage the underlying risks (Charts 3.30 and 3.31).
Rapid rise of gold loan companies could be a cause of concern 3.27 The exponential growth in balance sheets of NBFCs engaged in lending against gold in recent years coupled with the rapid rise in gold prices along with expansion in the number of their branches could be a cause of concern (Box 3.3). The gold loan companies 9 exhibited high dependency on the banking system for their resources which could pose risks to the banks, in case the business model of these companies falters. This growing interconnectedness of gold loan companies with banks was sought to be addressed through recent regulatory measures viz., the de-recognition of priority sector status of bank finance to NBFCs for on-lending against gold jewellery and through the prescription of a lower exposure limits on bank finance to NBFCs. Further, as a prudential measure, the Reserve Bank also directed the gold loan companies to maintain a minimum Loanto- Value (LTV) ratio of 60 per cent for loans granted against the collateral of gold jewellery and a minimum Tier I capital of 12 per cent by April 1, 2014. Box 3.3 : Gold Loan Companies and Associated Risks Lending against the collateral of gold is not a recent phenomenon, though there has been a spurt in this activity in recent years with NBFCs emerging as prominent players in the market for ‘gold loans’. The share of NBFCs in total gold loans extended by all financial institutions, showed a marked increase between March 2010 and 2011. Individuals are the largest borrowers against gold from NBFCs and account for 95 per cent of the total gold loans. The data related to these NBFCs shows that the total asset size increased sharply from ` 54.8 billion as at end March 2009 to ` 445.1 billion as at end March 31, 2012. The growth has largely been accompanied by an escalation in borrowings. There is significant concentration among the companies, as the growth in advances is mainly contributed by two companies. The borrowings of these two companies increased by nearly 200 per cent between March 2010 and 2011. Nevertheless, there are several concerns pertaining to this segment of the NBFC sector. The main concerns being: (i) Concentration Risk With more than 90 per cent of the loan assets being collateralised by only one product viz. gold jewellery, the business model of gold loan companies has inherent concentration risks. The risks, however, would materialise only in case of a steep adverse movement in gold prices. (ii) Operational Risk The gold loan companies thrive on the promises of disbursement of quick /easy loan. Considering the extremely speedy disbursal being promised by these companies, quality of due diligence including adherence to Know Your Customer (KYC) norms, establishing ownership and quality of the gold, etc. could be compromised. (iii) Concerns on Private Placement of NCDs on a Retail Basis The gold loan companies have resorted to frequent issuances of short term retail non convertible debentures (NCDs), especially through private placement for meeting their credit needs. Concerns arise as some of these NCDs carry the features of ‘public deposits’, but these entities are not regulated in a manner akin to deposit taking NBFCs. (iv) Reliance on borrowings, especially bank funds The business model of the gold loan companies is driven by borrowings, of which, bank finance forms the major component and is increasing at a fast rate. Any adverse development in recovery by these NBFCs or an adverse movement in gold prices may have a spill-over impact on the asset quality of the banks.
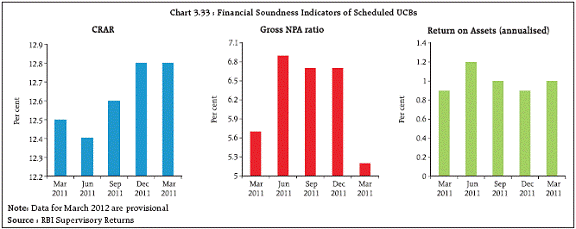
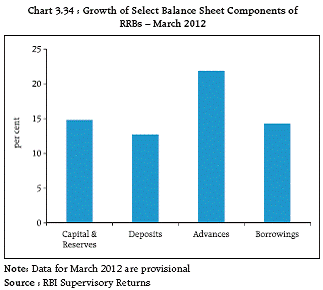
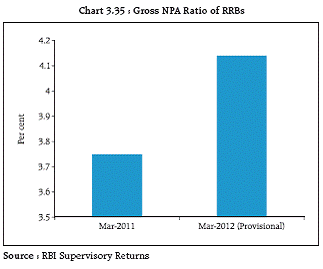
Urban Co-operative Banks (UCBs) UCBs show improvement in performance 3.28 The performance of Scheduled UCBs (SUCBs) as at end March 2012 has shown improvement during the review period (Chart 3.33). Regional Rural Banks (RRBs) Strain in asset quality evident 3.29 RRBs, which constituted about 1.5 per cent of the assets of the financial system, showed robust growth as at end March 2012, even as asset quality deteriorated (Charts 3.34 and 3.35). Insurance Sector10 Non life sector indicated robust growth while life sector declined 3.30 The non life insurance industry grew by 23.2 per cent, at end March 2012, as against a growth of 22.4 per cent as at end March 2011. The life insurance industry showed a decline of 9.2 per cent in the first year premium collected in 2011-12, against a growth of 15.1 per cent in 2010-11.
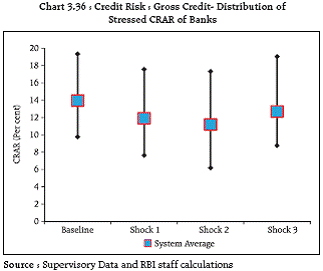
Challenges lie ahead in wake of Solvency II regime 3.31 The Indian insurance sector is governed by a factor based solvency regime which is comparable to Solvency I 11. This framework is rule based and reflects various risks at the industry level while implicit margins embedded in various elements for valuing assets, liabilities and solvency margins make the solvency framework prudent and robust. 3.32 Solvency II is a risk-based regulatory regime that will apply to almost all insurance establishments in the European Union (EU). The regime introduces economic risk-based solvency requirements and aims to bring in a change in perception that capital is not the only mitigant against failures. Instead of statutory provisioning, Solvency II provides for provisioning based on the (market consistent) ‘Best Estimate’. Given that the joint venture partners of a number of insurance companies operating in India are EU based entities, the Indian operations have also been assessed for the purpose of Solvency II. While the level of preparedness of these entities would be much higher, greater challenges exist with respect to the public sector insurers both in the life and non-life segments. 3.33 The current capital regime in India is not in complete consonance with Solvency II and embarking on the framework would necessitate addressing a range of challenges in terms of assessment of risks, development of internal models, adequacy of data, capacity building both within IRDA and in the insurance industry. As a first step in this direction, IRDA has set up a Committee to examine the solvency regime in select jurisdictions and to make its recommendations on the Solvency II regime in India. Pension Funds12 3.34 India’s pension ecosystem is enormous and is growing rapidly. At one end of the spectrum are Defined Benefit (DB) pension schemes of which the two main schemes are the pre-reform civil services pension scheme of the Centre/states (which has been replaced by the National Pension System for the new recruits) and the ‘organised sector’ social security scheme operationalised by the Employees’ Provident Fund Organisation (EPFO). Besides, in the defined benefit category, there are a number of schemes which are run by the central and state governments, of which the largest is the Indira Gandhi National Old Age Pension Scheme. The state governments run a number of occupational pension schemes, a large number of which, relate to the trades in the unorganised sector and mainly target the population below the poverty line. 3.35 At the other end of the spectrum are the Defined Contribution (DC) Schemes of which the National Pension System (NPS) introduced from January 2004 is the most important addition to the Indian pension sector. The NPS was initially introduced as a replacement pension scheme for the civil services. The scheme was first adopted by the central government and then by the state governments, except for West Bengal, Kerala and Tripura. In 2009, the NPS was extended to the private sector and, in 2010, the Government of India introduced a co-contribution scheme (called ‘Swavalamban’) on the NPS platform for the unorganised sector. The DC space is also populated by a number of schemes that are run by insurance companies for private individuals and corporates. 3.36 In the case of the DB schemes, the biggest challenge is the quantification of the liabilities. Since the pre-2004 pension scheme is indexed to inflation and wage increases recommended by the Pay Commission, it becomes difficult to project the pay-outs far into the future. The problem is compounded by the fact that it is a ‘Pay As You Go’ system which implies that this is an unfunded liability. Any large increase in the pension liability will have a direct impact on the fiscal deficit. The 2012-13 budget estimated a total outflow of `631 billion on pensions and retirement benefits of central government employees alone, which is an increase of 12 per cent over the revised estimate of `561 billion in 2011-12. In the 1970s and 1980s, recruitment by the Government expanded rapidly, though it was contained in the 1990s. Pension payments to the recruits of earlier decades will soon start looming large. The outflows are expected to rise as the cohort of recruits between 1970s and 1980s retire. In the case of the EPFO, it is a DB scheme which is partially funded by the contributions made by the employer and the employee. However, since the benefits are fixed and are sticky downwards, any shortfall will have to be made good by the Government. According to the Report of the Expert Committee on Employees’ Pension Scheme (EPS), 199513, there is underfunding in the EPS at the present rate of contributions and sustainability of the scheme would require upward revisions. Moreover, the Employees’ Pension Fund had a corpus of about `1420 billion as on March 31, 2011. The large magnitude is a pointer to systemic risk, if magnitude is any criteria. In the case of several DB schemes, currently under implementation and newly announced, the lack of liability computation especially in a world of rising life expectancy can be a potential source of fiscal stress in years where there are large payouts. 3.37 Identifying systemic risks for DC pension systems is a challenge as prima-facie, one does not find reasons when all the risks are transferred and diffused to a large number of subscribers whose benefits are left undefined, by definition. The task becomes more challenging when the pension regulator has a limited mandate to regulate only the National Pension System and no identification methodology for systemic risks is available and implemented. The miniscule size of NPS intuitively renders negligible possibilities or potentials of posing any systemic risk. The NPS (a Defined Contributionunprotected), by definition, rules out the requirement of solvency or capital requirement related stress test. At best, some kind of scenario analysis can be contemplated, not from the perspective of systemic risk threat but for effectively addressing public disclosure risk issues. This is specifically relevant for the return and benefit projection on which illustrations could be based. A sensitivity testing could also be relevant when the risk of a particular factor is tested on an institution or portfolio (such as equity market decline or adverse interest rate movements). Similarly a full range of stress tests covering broad range of modeling techniques can be contemplated to effectively communicate the risks passed on to the subscribers using historical scenarios or hypothetical (usually extreme) events. The modeling can be deterministic or stochastic. 3.38 International standard setting organisations such as International Association of Insurance Supervisors (IAIS) and Bank for International Settlements (BIS) have outlined two main roles for stress testing: (a) To ascertain whether financial institutions have sufficient financial resources to meet their commitments (not required for DC pensions which do not have set liabilities to meet) (b) As a general risk management tool, which can be used to ascertain the impact of various factors or scenarios on financial institutions (DC pensions do not have capital requirements). 3.39 However, stress tests can help to develop and assess alternative strategies for mitigating risks. There could be three different uses of stress tests. First, the pension supervisor can analyse the results of tests undertaken by pension funds as a part of general oversight. Second, supervisors can impose standard tests for all supervised entities for comparative purposes or to establish the state of the industry as a whole. Third, supervisor could optionally request particular tests to be imposed on specific institutions where they have concerns. At present, internationally, there is no guidance available to be drawn from the comparative analysis on the elements and factors that should be considered by both pension funds and pension supervisors in designing, applying and evaluating stress testing models. 3.40 Similar to the rigorous exercises undertaken by the Expert Committee, the conventional broad range of modeling techniques and solvency related tests can be applied to these DB pension plans to ensure that government has sufficient financial resources to meet their (future) commitments. Stress tests with respect to particular risk factors (such as general economic decline, interest rate movements, inflation) can help to develop and assess alternative strategies for mitigating risk. Resilience of Financial Institutions 3.41 The resilience of the financial institutions was assessed through a series of stress tests which imparted extreme but plausible shocks14 based on supervisory data pertaining to end-March 2012. The resilience of SCBs to various stress scenarios was tested using both the top down and the bottom up approaches as also through a series of macro stress tests15. A number of single factor sensitivity stress tests were also carried out on scheduled UCBs and NBFC-ND-SIs (Non deposit taking systemically important NBFCs) to assess their vulnerabilities and resilience under various scenarios. Scheduled Commercial Banks (SCBs) 3.42 A series of top down stress tests incorporating credit, foreign exchange, equity, interest rate and liquidity risks were carried out for the banking system (60 SCBs comprising 99 per cent of total banking sector assets). The same set of shocks were used by 25 select SCBs (comprising about 75 per cent of total assets) to conduct bottom up stress tests. The bottom up stress tests broadly reflected the results of the top down stress tests and reconfirmed the resilience of the banking system to a wide range of shocks. Credit risk remains the main source of vulnerability for SCBs 3.43 The impact of shocks under different credit risk scenarios for banks as on March 2012 shows that the system level CRAR remained above the required minimum of 9 per cent and the system is reasonably poised to withstand the shocks; although some banks, including a few large banks, could be under stress as their CRAR would fall below 9 per cent (Table 3.3 and Chart 3.36). Banks remain resilient to sectoral credit risk shocks 3.44 The analysis of a credit risk shock emanating from important sectors viz. agriculture, power, real estate, telecom and priority sector revealed that the maximum impact was seen in the case of shocks to the priority sector followed by shocks to the real estate and agriculture sectors. The banks were, however, able to absorb the shocks (Table 3.4).
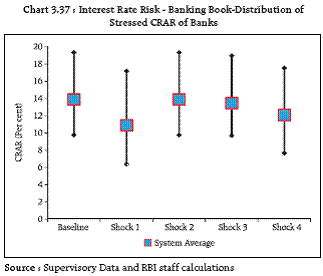
Credit concentration risk was not significant 3.45 A study of the concentration of credit portfolio of banks revealed that, at the system level, the concentration appeared moderate, though the degree of concentration was higher in some individual banks (Table 3.5). The average exposure of the banks to the largest group borrower stood at 4.7 per cent of total advances. The maximum exposure was, however, much higher at 26.1 per cent. Banks able to withstand interest rate shocks 3.46 The resilience of SCBs to shocks involving both parallel and non-parallel shifts in the yield curve was assessed. The tests were carried out separately for the banking and trading books. The results carried out on the trading book suggest that the impact of interest rate risk would be limited and no bank is impacted adversely. The results of the banking book also suggest that the banking system could withstand the assumed stressed scenarios, though the CRAR of some individual banks slip below the regulatory minimum. The impact is maximum in case of a parallel upward shift of the INR yield curve by 250 basis points (bps) (Table 3.6 and Chart 3.37). Impact of adverse exchange rate and equity price movements would be limited 3.47 The impact, of appreciation/depreciation of currencies by 10/20 per cent, on banks’ individual net open bilateral currency positions was assessed. The stress tests results indicate that the impact will not be significant. The impact of a fall in the equity prices by 40 per cent on banks’ capital revealed that the shock has a marginal impact as the equity market exposure of banks was not very significant. The system level CRAR fell to 13.4 per cent, under stress, from the baseline of 14.1 per cent. For all banks, the post-stress CRAR remained above 9 per cent. SLR investments key in mitigating liquidity risks 3.48 Stress scenarios assessing the resilience of banks to liquidity risk16 evidenced deterioration in the liquidity position of some banks. The availability of Statutory Liquidity Ratio (SLR) investments, however, helped the banks to ward off the liquidity pressure (Table 3.7).
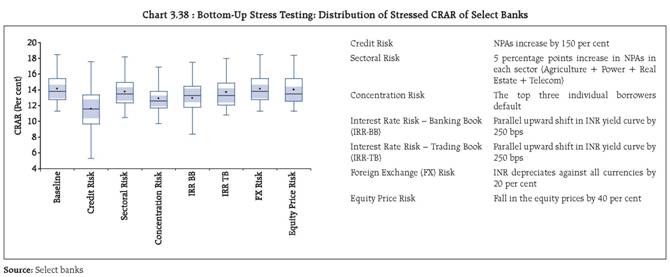
Bottom-up stress tests also reflect resilience of the banking system 3.49 The results of the bottom up stress tests carried out by select banks (paragraph 3.42) also testified to the general resilience of the banks to the different kinds of sensitivity analysis. As in the case of the top down stress tests, the impact of the stress tests were relatively more severe on some banks with their post-stress CRAR position falling below the regulatory minimum (Chart 3.38).
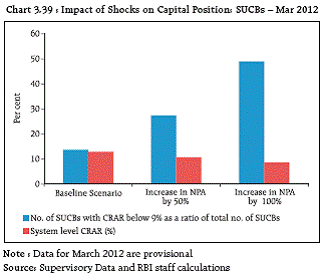
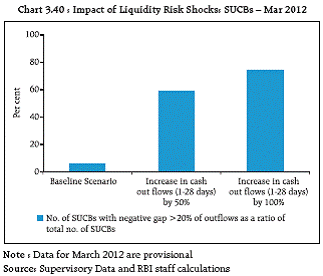
Urban Co-operative Banks UCBs vulnerable to credit risk shocks… 3.50 Stress tests on credit risk were carried out for Scheduled UCBs (SUCBs) using their balance sheet data as at end-March 2012. The impact of credit risk shocks on the CRAR of the banks was assessed under two different scenarios assuming an increase in the gross NPA ratio by 50 per cent and 100 per cent respectively. The results show that SUCBs could withstand shocks assumed under the first scenario easily, though it would come under some stress under the second scenario (Chart 3.39). …as also to liquidity risks 3.51 Stress tests on liquidity risk were carried out under two different scenarios assuming an increase in cash outflows in the 1 to 28 days time bucket by 50 per cent and 100 per cent respectively. It was assumed that there were no changes in cash inflows under both the scenarios. The banks were considered to be impacted if, as a result of the stress, the mismatch or negative gap (i.e. the cash inflow less cash outflow) in the 1 to 28 days time bucket exceeded 20 per cent of outflows. The stress test results indicate that the SUCBs would be significantly impacted even under the less severe stress scenario (Chart 3.40). Non-Banking Financial Companies NBFCs able to withstand credit risk shocks 3.52 A stress test on credit risk for NBFC-ND-SI sector for the period ended December 2011 was carried out under two scenarios assuming an increase in gross NPA by 200 per cent and 500 per cent respectively. 3.53 It was observed that, in the first scenario, CRAR reduced marginally from 27.5 to 26.8 per cent, while in the second scenario CRAR reduced to 24.3 per cent.
The sector, thus, remained resilient even to the more severe stress scenario owing largely to its comfortable CRAR position. However, the CRAR of some individual NBFCs (accounting for around 5 per cent of total assets of NBFC-ND-SIs), fell to below the regulatory requirement of 15 per cent. 1 For methodology and details, please refer to the Annex. 2 Divergence denotes the gap between growth rate of advances and investments and deposit and capital. A positive gap implies that the growth rate of deposits and capital was not sufficient to meet the growth of advances and investments leading to increased reliance on borrowed funds. 3 The slippage ratio is defined as the ratio of slippages i.e. fresh accretion to NPAs during the year to standard advances at the beginning of the year. 4 RBI Circular titled “Prudential Guidelines on Restructuring of Advances by banks” (No. RBI/2008-09/143 DBOD.No.BP.BC.No.37 /21.04.132/2008-09 dated August 27, 2008) 5 Statistics based on data collected from 67 banks that represent 91 per cent of total assets of SCBs, unless specified otherwise. 6 An estimate by CRISIL puts net losses of power distribution companies to around ` 400 billion in 2010-11. 7 Sample consists of 26 banks accounting for 88 per cent of total notional amount of derivatives exposure and 64 per cent of total assets of SCBs as on March 31, 2012. 8 For methodology and details, please refer to the Annex. 9 NBFCs which are predominantly engaged in extending loans against gold jewellery are also known as ‘gold loan companies’. 10 Source : Insurance Regulatory and Development Authority (IRDA). 11 Solvency I is the name given to changes to the EU’s insurer solvency regime made in 2002. The changes aimed to establish a common prudential framework for insurance undertakings in EU based on the concept of minimum harmonisation and mutual recognition. 12 Source: Pension Fund Regulatory and Development Authority (PFRDA). 13 www.epfindia.com/Circulars/Y2011-12/EPS95_Expert_Report.pdf 14 For methodology and details, please refer to the Annex. 15 The results of the macro stress tests are discussed in Chapter V of this Report. 16 The stress tests have been carried out on the assumption that (i) the SLR securities would be available for use during a period of system-wide run on deposits and (ii) only excess SLR securities are liquid. Five different definitions of liquid assets have been used involving different combinations of cash, CRR, Inter-bank-deposits and Investments. |
|||||||||||||||||||||||||||||||||||||||||||||||||||||||||||||||||||||||||||||||||||||||||||||||||||||||||||||||||||||||||||||||||||||||||||||||||||||||||||||
Page Last Updated on:


