 IST,
IST,
Chapter III: Regulatory Initiatives in the Financial Sector
Global regulatory efforts continued to focus on risks associated with the crypto ecosystem and the threat of decentralisation. On the domestic front, regulatory attention was engaged in deepening digitalisation in payments and other financial services, improving risk management capabilities of financial entities, facilitating retail participation in financial markets, enhancing investor protection, strengthening the framework for public issue as well as cash and derivative segments in equity markets and supervision of systemically important insurers. The Financial Stability and Development Council (FSDC) and its Sub-Committee remained committed to preserving the stability of the Indian financial system and building its resilience. Introduction 3.1 At the global level, pandemic-proofing measures to aid households, firms and financial institutions buffered financial systems and ensured their normal functioning (Box 3.1). 3.2 Recent regulatory measures have focussed on curtailing solvency risk of financial entities, promoting market-based financing and reducing moral hazard of unduly prolonged policy support. At the same time, high levels of global debt, monetary policy tightening, risks associated with the cryptocurrency ecosystem and climate related risks and more recently, geopolitical conflict posed threats to global financial stability. 3.3 Against this background, this chapter reviews regulatory initiatives undertaken globally and in India to fortify the stability and functioning of the financial system. III.1 Global Regulatory Developments and Assessments 3.4 The Financial Stability Board (FSB) laid out four key areas to promote global financial resilience in February 20221 : (a) supporting financial market adjustment to a post-COVID world; (b) reinforcing financial system resilience, especially in the non-bank financial intermediaries sector; (c) harnessing benefits of digitalisation while containing its risks; and (d) addressing financial risks from climate change. More recently, the focus has shifted from managing recovery in a post-pandemic world to dealing with the impact of the war. At the same time, aggressive tightening of monetary policy in response to the accentuating inflationary pressures presages a major shift in global liquidity conditions and repositioning has started affecting global financial flows. One of its early ramifications is reflected in the crypto ecosystem with one stablecoin losing almost all its value and another de-pegging from the US dollar, underscoring the need for regulatory guardrails to ensure financial stability and consumer and investor protection. 3.5 Another area of focus has been the build-up of debt among non-financial corporates, rising dollar-denominated debt in emerging market economies (EMEs) and the role of NBFIs. Vulnerability of the financial system to cyber risk also attracted attention of policy makers. Climate-related risks and regulatory and supervisory approaches to address them are gathering momentum. III.1.1 Crypto Ecosystem and Financial Stability 3.6 The FSB2 examined vulnerabilities associated with three closely interrelated segments, viz., unbacked crypto assets (such as Bitcoin); stablecoins and decentralised finance (DeFi); and crypto asset trading platforms. Several vulnerabilities associated with crypto asset markets have been highlighted such as linkages between crypto asset markets and the regulated financial system; liquidity mismatch, credit and operational risks, with the potential spillover to short term funding markets; increased use of leverage in investment strategies; concentration risk of trading platforms; and opacity and lack of regulatory oversight of the sector. Identification and quantification of risks posed by crypto-assets face data gap challenges. 3.7 The IOSCO3 has noted that DeFi4 is a spectrum and not a ‘binary outcome’, and that some DeFi products and services may retain a level of centralisation through concentrated ownership of the ‘governance tokens’, or by restricting the governance decisions for users. The risks associated with DeFi include speculative trading, flash loans, cross-border lending and borrowing, front running, cybersecurity, asymmetry and fraud. It has stressed the need for continuous examination of this evolving landscape and its implications for traditional financial institutions. III.1.2 Debt and Financial Stability 3.8 In its discussion paper on debt overhang issues of non-financial corporates5, the FSB observed that the debt of non-financial corporates has increased to an unprecedented level, which could pose risks to financial stability through underinvestment by viable corporates, misallocation of resources, and lower productivity due to loss of entrepreneurial capacity. It has addressed debt overhang issues through three different angles: (i) viability assessment of companies in the context of the pandemic; (ii) facilitating and incentivising timely restructuring and refinancing; and (iii) dealing with debt restructuring needs of corporates, especially MSMEs. Attracting new long-term equity investments and complementing banks’ financing through capital-market-based solutions have been suggested for restructuring of firms’ balance sheets, whereas fiscal incentives may be needed in the case of smaller firms. III.1.3 Markets and Financial Stability 3.9 The IOSCO6 analysed the corporate bond market microstructure and observed that secondary corporate bond trading has remained dependent on a small network of Over the Counter (OTC) dealers. It has stressed further exploration in improving price transparency in corporate bond markets, reducing heterogeneity of bonds and increasing standardisation. 3.10 The European Securities and Market Authority (ESMA) has proposed reforms to the regulatory framework for European Union Money Market Funds (MMFs), addressing liquidity issues and threshold effects for constant net asset value (CNAV) MMFs. It7 suggests mandatory availability of at least one liquidity management tool for all MMFs; amending daily liquid asset/weekly liquid asset ratios as well as the pool of eligible assets; and allowing temporary use of liquidity buffers in times of stress. The proposed reforms also include enhancements of reporting requirements and the stress testing framework as well as clarification of the requirements on external support and new disclosure requirements linked to the rating of MMFs. III.1.4 Cyber Risk and Financial Stability 3.11 The European Systemic Risk Board (ESRB)8 has identified the need for establishment of a systemic cyber incident coordination framework to mitigate the risk from coordination failure in the constantly evolving cyber risk landscape. It proposes a macroprudential strategy, including cyber resilience and systemic cyber resilience stress tests as a tool for testing how systemic institutions in the financial system would respond to and recover from a severe but plausible cyber incident scenario. Macroprudential authorities need to define an acceptable level of disruption to operational systems. It recommends identification of systemically important nodes at financial and operational levels through cyber mapping to increase the understanding of vulnerabilities and contagion channels in the financial system. III.1.5 Climate-related Risks and Financial Stability 3.12 The FSB9 has proposed a framework for developing approaches to monitor, manage and mitigate risks arising from climate change and to promote consistent approaches across sectors and jurisdictions. It notes that climate-related risks, including physical, transition and liability risks may get transmitted across the financial system and may be amplified by the financial system across borders and sectors. There could also be risk transfer from banks to insurers, insurers to reinsurers and reinsurers to governments. Climate-related risks may exhibit tipping points and non-linearities, which may amplify the feedback effects between the financial sector and the real economy. III.2 Domestic Regulatory Developments 3.13 Since the publication of the December 2021 issue of the FSR, the Financial Stability and Development Council (FSDC) chaired by the Union Finance Minister met once on February 22, 2022. The Council deliberated on the various mandates of the FSDC, viz., financial stability; financial sector development; inter-regulatory coordination; financial literacy; financial inclusion; and macro prudential supervision of the economy, including the functioning of large financial conglomerates, as well as major macro-financial challenges arising in view of global and domestic developments. The Council noted that Government and all regulators need to maintain constant vigil on financial conditions and functioning of important financial institutions, especially exposure to financial vulnerabilities in the medium to long-term. The Council discussed measures required for further development of the financial sector and to achieve an inclusive economic growth with macroeconomic stability. The Council also took note of the activities undertaken by the FSDC Sub-Committee chaired by the Governor, Reserve Bank of India. 3.14 In its 28th meeting, the FSDC Sub-Committee reviewed the major developments in the global and domestic economy as well as in various segments of the financial system and discussed the assessments of members about the scenario emerging from the third wave of the COVID-19 pandemic. The deliberations covered various regulatory issues and the activities of the technical groups under the Sub- Committee. The Sub-Committee also discussed the use of Aadhaar based e-KYC (e-Know Your Customer) and Aadhar Enabled Payment System by regulated entities (REs). III.3 Initiatives from Regulators/Authorities 3.15 Financial sector regulators launched several initiatives for the development of the financial system and enhancement of its robustness and resilience (Annex 3). III.3.1 Regulatory Framework for Microfinance Loans 3.16 The Reserve Bank issued a comprehensive regulatory framework for microfinance loans effective April 1, 2022, which has been made applicable to all REs of the Reserve Bank. The framework includes, inter alia, a common definition of microfinance loan for all REs, cap on outflows on account of repayment obligations of a household as a percentage of household income, no pre-payment penalty on microfinance loans, no requirement of collateral for microfinance loans, introduction of a standardised simplified fact sheet on pricing of microfinance loans, and guidelines on conduct towards microfinance borrowers. The framework is intended to address the concerns of over-indebtedness of low-income households, enable competitive forces to bring down interest rates on microfinance loans, strengthen customer protection measures for microfinance borrowers, and introduce activity-based regulation in the microfinance sector. Further, in view of interconnectedness of Section 8 companies (registered under Companies Act, 2013) with other financial intermediaries and potential transmission of any risk arising out of their business to the financial sector, Section 8 companies providing microfinance loans and having asset size of ₹100 crore and above, have been brought under the regulatory ambit of the Reserve Bank. III.3.2 Digital Banking Units (DBUs)10 3.17 Following the announcement made in the Union Budget 2022-23 to set up 75 DBUs in 75 districts to commemorate 75 years of independence (Azadi ka Amrit Mahotsav), the Reserve Bank issued guidelines on establishment of Digital Banking Units (DBUs) applicable to all Domestic SCBs {excluding RRBs, PBs and local area banks (LABs)} to widen the reach of digital banking services. III.3.3 Framework for Facilitating Small Value Digital Payments in Offline Mode 3.18 In order to improve the adoption of digital payments, especially in remote areas, the Reserve Bank has been encouraging entities to develop offline payment solutions. A pilot scheme for small value offline payments was conducted to test innovative technologies that enable retail digital payments even in situations where internet connectivity is low/not available. Based on the results, the Reserve Bank has issued a framework to enable small value digital payments in offline mode. Offline payments shall be made in proximity (face to face) mode only, using any channel or instrument like cards, wallets and mobile devices. The payment transaction may be offered without Additional Factor of Authentication (AFA). The upper limit of an offline payment transaction has been kept at ₹200 and the total limit for offline transactions on a payment instrument has been kept at ₹2,000 at any point in time. Replenishment of used limits can be done only in online mode with AFA. III.3.4 Master Direction – Reserve Bank of India (Credit Derivatives) Directions 3.19 The Reserve Bank issued Master Directions on Credit Derivatives to provide a fillip to the CDS market and to facilitate the development of a liquid market for corporate bonds, especially for bonds of lower-rated issuers. The directions shall apply to credit derivatives transactions undertaken in OTC markets and on recognised stock exchanges in India. Residents and non-residents, who are eligible to invest in corporate bonds and debentures under the Foreign Exchange Management (Debt Instruments) Regulations, 2019, can participate in the credit derivatives market. Eligible market-makers in credit derivatives consist of SCBs (except SFBs, PBs, LABs and RRBs), NBFCs including stand-alone Primary Dealers (SPDs), HFCs with minimum net owned funds (NOF) of ₹500 crore and above and subject to specific approval of the Department of Regulation, Reserve Bank, and AIFIs. Market-makers will classify users as retail or non-retail; retail users shall be allowed to buy protection only for hedging while non-retail users, viz., regulated financial entities, FPIs, etc., shall be allowed to sell protection and buy protection for hedging or otherwise. Market participants shall not enter into CDS transactions if the reference entity is a related party to either the protection buyer or the protection seller. Participants can exit their CDS contract by unwinding the contract with the original counterparty or assigning the contract to any other eligible market participant through novation. III.3.5 Legal Entity Identifier for Borrowers 3.20 The Legal Entity Identifier (LEI) code, which has been conceived as a key measure to improve the quality of financial data systems for better risk management, is a 20- digit unique code to identify parties to financial transactions worldwide. The guidelines, which were initially mandated for large borrowers of SCBs, have now been extended to primary UCBs and NBFCs. As on June 16, 2022, M/s Legal Entity Identifier India Ltd. had registered 47,483 LEIs. Non-individual borrowers enjoying aggregate exposure of ₹5 crore and above from banks and financial institutions (FIs) are required to obtain LEI codes. Borrowers with total exposure above ₹25 crores are required to obtain LEI by April 30, 2023, failing which they will not be sanctioned any new exposure. III.3.6 Retail Direct Scheme 3.21 The Reserve Bank launched the RBI Retail Direct Scheme on November 12, 2021 to provide one-stop access to facilitate investment in government securities by retail investors. Under the scheme, retail individual investors can open a Retail Direct Gilt (RDG) account with the Reserve Bank, using an online portal. Subsequent to the launch of the scheme, a market making scheme for the PDs was announced. As per the scheme, the PDs shall be present on the Negotiated Dealing System – Order Matching (NDS-OM) platform {Odd-lot and Request for Quotes (RFQ) segments} throughout market hours and respond to buy/sell requests from Retail Direct Gilt Account Holders (RDGAHs). III.3.7 Cyber-Security Risks 3.22 CSIRT-FIN (Computer Security Incident Response Team – Finance Sector), made operational under the umbrella of Indian Computer Emergency Response Team (CERT-In), has been handling security incidents related to vulnerable services, botnets, open services phishing, unauthorised access and other such cyber issues. Financial entities have been on-boarded to CERT-In’s Cyber Swachhta Kendra (CSK) for providing automated feeds regarding malware infections, botnets and vulnerable services. CSIRT-FIN has been issuing vulnerability notes and tailored threat intelligence alerts to financial entities that have been on-boarded on CERT-In’s threat intelligence platform. III.3.8 FinTech Developments 3.23 The financial technology (FinTech) industry has undergone tremendous growth over the past few years. The global FinTech market size was valued at US$ 111 billion in 2020, and is projected to reach US$ 698 billion by 2030, growing at a CAGR of 20.3 per cent11. The Indian FinTech industry, which is amongst the fastest growing FinTech markets in the world, was valued at US$ 50-60 billion in 2020 and is projected to reach US$ 150 billion by 202512. India has the highest FinTech adoption rate globally (87 per cent)13, receiving funding of US$ 8.53 billion (in 278 deals) during 2021-22. FinTech innovations are ubiquitous, especially in retail and wholesale payments, financial market infrastructures, investment management, insurance, credit provision and equity capital raising and may lead to material changes in the financial landscape. 3.24 The adoption of FinTech can promote financial inclusion, broaden offering of financial products and services, increase efficiency for delivery of financial services, better accessibility, affordability and enhanced customer experience. It may also lead to efficiency gains in credit delivery processes, better targeted products, improved risk management including, better underwriting models, improved adoption of RegTech reducing compliance cost for regulated entities etc. 3.25 The advent of FinTech has exposed the banking system to new risks which extend beyond prudential issues and often intersect with other public policy objectives relating to safeguarding of data privacy, cyber security, consumer protection, competition and compliance with AML policies. BigTechs can scale up rapidly and pose risk to financial stability, which can arise from increased disintermediation of incumbent institutions. Moreover, complex intertwined operational linkages between BigTech firms and financial institutions could lead to concentration and contagion risks and issues relating to potential anti-competitive behaviour. 3.26 Regulators and supervisors face a challenging balancing act between innovation-friendliness and managing risks to financial stability, which requires more engagement of stakeholders such as regulators, the FinTech industry, and the academia to work towards common principles for management of FinTech activities, including business and revenue models, governance, conduct, risk management, regulation aspects for promoting a sustainable ecosystem.
III.3.9 Customer Protection 3.27 As observed from the complaints received under the erstwhile Banking Ombudsman Scheme (BOS), 2006 and the Reserve Bank - Integrated Ombudsman Scheme (RB-IOS), 2021, launched on November 12, 2021, the share of complaints received under the category ‘loans and advances’ and ‘credit cards’ stood at 39.5 per cent of the total complaints received during November 12, 2021 to March 31, 2022 as compared to 29.2 per cent during April 01, 2021 to November 11, 2021 (Table 3.1).
III.3.10 Enforcement 3.28 During December 2021 - May 2022, the Reserve Bank undertook enforcement action against 74 regulated entities (three PSBs; three PVBs; sixty-four co-operative banks; two FBs; and two NBFCs) and imposed an aggregate penalty of ₹9.98 crore for non-compliance with/contravention of statutory provisions and/or directions issued by the Reserve Bank. III.3.11 Variation Margin for Non-centrally Cleared OTC Derivatives16 3.29 The Reserve Bank issued Master Directions for variation margin, which will come into effect from December 01, 2022. These Directions apply to foreign exchange derivatives, interest rate derivatives and credit derivative contracts that are non-centrally cleared. They apply to domestic covered entities regulated by a financial sector regulator (including branches of foreign banks operating in India) and resident non-financial entities with an average aggregate notional amount (AANA) of outstanding non-centrally cleared derivatives (NCCDs) of ₹25,000 crores and above and ₹60,000 crores and above, respectively, on a consolidated group wide basis. They are also applicable to foreign covered entities, including non-resident financial firms and non-resident non-financial entities having an AANA of outstanding NCCDs of US$ 3 billion and above and US$ 8 billion and above, respectively, on a consolidated group wide basis. III.3.12 Payments Infrastructure Development Fund Scheme 3.30 The Payments Infrastructure Development Fund (PIDF) Scheme was operationalised by the Reserve Bank in January 2021 to incentivise the deployment of payment acceptance infrastructure such as physical Point of Sale (PoS) terminals, mobile PoS (mPoS), Quick Response (QR) codes in Tier-3 to Tier-6 centres and north-eastern states and Union Territories (UTs) of Jammu and Kashmir (J&K) and Ladakh. Beneficiaries of the PM SVANidhi Scheme in Tier-1 and Tier-2 centres were included under the scheme in August 2021 (Table 3.2). PIDF envisages creating 30 lakh new touch points every year for digital payments. 3.31 Under the scheme, a subsidy of 60 to 75 per cent of the cost of physical PoS and 75 to 90 per cent of the cost of a Digital PoS shall be offered. Initially, 75 per cent of the subsidy amount shall be released and the balance shall be released after ensuring that performance parameters are achieved. III.3.13 Individual Housing loans – Cooperative Banks 3.32 Taking into account the increase in housing prices and customer needs, the Reserve Bank increased the limits on housing loan sanctioned by UCBs for individual borrowers. The limits for Tier-I and Tier-II UCBs are now placed at ₹60 lakh and ₹140 lakh, respectively, whereas for Rural Cooperative Banks (RCBs – State Cooperative Banks and District Central Cooperative Banks), the limits are increased to ₹50 lakh for RCBs with assessed net worth less than ₹100 crore and ₹ 75 lakh for other RCBs. It has been decided to allow RCBs to extend finance to ‘Commercial Real Estate – Residential Housing (CRE-Table RH)’ within the existing aggregate housing finance limit of 5 per cent of their total assets as per their Board-approved policy, with periodic performance monitoring. III.3.14 Cross Margin in Commodity Index Futures 3.33 The Securities and Exchange Board of India (SEBI) introduced cross margin benefits between commodity index futures and futures of its underlying constituents or its variants in June 2021 to improve the efficiency of use of margin capital by market participants. By reducing the total margin payment required on their positions, there is a reduction in the cost of trading and improvement in liquidity in index futures and underlying constituent futures. It allows a cross margin benefit of 75 per cent on the initial margin if a client arbitrages or holds offsetting positions in index futures and futures of its underlying constituents or its variants. The levy of extreme-loss margin and mark-to-market margin continue. 3.34 At the Multi-Commodity Exchange of India Limited (MCX), the cross-margin facility was introduced for futures in the MCX iCOMDEX Bullion Index (MCX BULLDEX) and the MCX iCOMDEX Base Metal Index (MCX METLDEX). The National Commodity and Derivatives Exchange Limited (NCDEX) has started providing cross margining benefit in initial margins between GUAREX17 Index futures and its underlying constituent futures. There has been an overall decline in average trading volumes in two MCX indices, viz., the MCX BULLDEX and the MCX METLDEX (Chart 3.1). This could be owing to heightened volatility in commodities since April 2021, which further intensified following the geopolitical developments since February 2022. III.3.15 Tightening Framework for Public Issues 3.35 After reviewing various aspects of the public issue framework, including price bands, non-institutional investor (NII) allocation, objects of the issue and monitoring of issue proceeds, SEBI took steps to strengthen the process for public issues. For all book built public issues opening on or after January 14, 2022, a minimum difference of 5 per cent between the lower and upper price band shall be applicable. The changed framework also specifies that one third of the portion available to NIIs should be reserved for applicants with application size of more than rupees two lakh and up to rupees ten lakh, while two-third of the portion available to NIIs should be reserved for applicants with application size of more than rupees ten lakh. 3.36 For companies not meeting eligibility criteria, including those relating to net tangible assets, average operating profit and net worth, certain limits have been placed on offer for sale (OFS) to demonstrate a higher level of skin in the game by pre-issue substantial shareholders, including promoters. 50 per cent of the portion allocated to ‘anchor investors’ under a public issue shall be locked in for a period of 90 days, whereas the remaining portion would continue to remain locked in for a period of 30 days with effect from April 01, 2022. Several measures have been prescribed for enhancing the framework for monitoring of issue proceeds such as permission to credit rating agencies (CRAs) to act as monitoring agencies instead of SCBs and public FIs, bringing amounts raised for general corporate purpose under monitoring with enhanced disclosure norms. 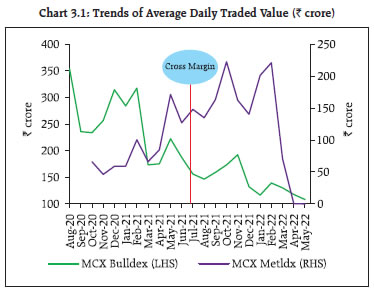 III.3.16 Retail Investor Protection 3.37 Since the outbreak of pandemic, SEBI has taken several steps to protect the retail investors from misconducts by regulated entities. In July 2021, a framework was prescribed by SEBI for segregation and monitoring of collateral by brokers at client level with an objective to tighten the mechanism of protection of client collateral from misappropriation/ misuse by the broker and to ensure safeguard against default of broker and/or other clients, and the same has been implemented w.e.f. May 02, 2022. Earlier during September 2020, in order to curb the misuse of power of attorney (POA) given by the clients to the broker, it was prescribed that margin obligations to be given in the form of securities by client would be by way of pledge or re-pledge through the depository system. Now, to significantly mitigate the misuse of POA, a separate document called “Demat Debit and Pledge Instruction” (DDPI) was introduced in April 2022, under which the clients are required to explicitly agree to authorise the stock broker and/or to access their beneficial owner account for the limited purpose of meeting pay-in obligations for settlement of trades executed by them. These measures are quite significant in context of the unprecedented surge in investors in the last 2 years. 3.38 Besides these, SEBI as well as stock exchanges have recently taken several measures to ensure robust surveillance mechanism. Moreover, market surveillance and risk management is carried out online as well as up to the end-client level. III.3.17 Capacity Building for Investors 3.39 Investor education and awareness has been a key strategy followed by the SEBI to enhance investor protection. During the pandemic, digital modes of conducting investor awareness activities were adopted. The SEBI has also introduced a programme called Securities Market Trainers (SMARTs) to conduct investor awareness programmes and media campaigns on cautioning investors against unsolicited investment tips. In these programmes, the SEBI provides free of charge centralised platforms for conduct of awareness webinars where digital educational contents is shared among the participants. III.3.18 Framework for FinTech Entity in the International Financial Service Centre (IFSC) 3.40 The International Financial Services Centres Authority (IFSCA) proposes to cover (i) FinTech solutions resulting in new business models, applications, process or products in areas/activities linked to financial services regulated by the IFSCA; and (ii) advanced/innovative technological solutions which aid and assist activities in relation to financial products, financial services and financial institutions (TechFin). It aims at fostering innovation in financial services through a regulatory/innovation sandbox for FinTech activities and enabling pure play technology companies in providing allied activities/ services to banking and financial services. The framework empowers the IFSCA to grant ‘Limited Use Authorisation’ to eligible financial technology entities. This would enable them to apply and avail of grants under the IFSCA FinTech Incentive Scheme 2022, which aims at providing financial support to FinTechs at various stages of their lifecycle. 3.41 The framework also proposes to cover areas/ activities allied to financial products, financial services and financial institutions. Some class/ categories of technology companies can obtain direct entry authorisation from the IFSCA without entering the regulatory sandbox, subject to certain conditions. The framework also includes an inter-operable regulatory sandbox (IORS) to facilitate testing of innovative hybrid financial products/ services falling within the regulatory ambit of more than one financial sector regulators in India. The IFSCA will facilitate Indian FinTech’s access to foreign markets and entry of foreign FinTechs into India. Firms with innovative ideas or solutions across banking, capital or insurance sector can benefit from seamless interaction with a single/unified regulator in the IFSCA. III.3.19 Fund Management Regulations at IFSCA 3.42 The IFSCA notified the Fund Management Regulations, 2022 under which eligibility and regulatory requirements for fund management entities (FMEs) managing retail schemes, non-retail schemes, venture capital schemes, portfolio management services and investment trusts have been prescribed. The regulations also carry requirements for exchange-traded funds (ETFs), portfolio management services (PMS), investment trusts (Real Estate Investment Trusts and Infrastructure Investment Trusts), in addition to environmental, social, and governance (ESG) related disclosures at entity level and scheme level. A FME intending to undertake a host of activities related to fund management can do so by seeking a single unified registration (Registered FME – Retail) from the IFSCA. 3.43 The regulations depending on the registration category require the FME to appoint key management personnel (KMPs) (Principal Officer; Fund Manager; Compliance and Risk Manager) and also various fiduciaries. The FME or its associate entities are required to make a skin in the game contribution to the schemes launched by them based on certain specified conditions. A detailed code of conduct has been prescribed for FME and their KMPs and fiduciaries. Requirements have also been prescribed for inter alia business continuity plans, cyber security and cyber resilience, risk management and change in control. III.4 Other Developments III.4.1 Deposit Insurance 3.44 The Deposit Insurance and Credit Guarantee Corporation (DICGC) has been extending insurance cover to depositors with the objective of maintaining the confidence of small depositors in the banking system of the country and promoting financial stability. Deposit insurance extended by the DICGC covers all commercial banks, including LABs and RRBs as well as co-operative banks in all the States and UTs. 3.45 The number of registered insured banks as on March 31, 2022 stood at 2,043, comprising 141 commercial banks (including 43 RRBs, two LABs, six payment banks and 12 small finance banks) and 1,902 co-operative banks (33 StCBs, 352 DCCBs and 1517 UCBs). As at end-March 2022, the limit of deposit insurance at ₹5 lakh fully protected 256.7 crore deposit accounts (97.9 per cent of total). In value terms, the insured deposits of ₹81 lakh crore formed 49.0 per cent of the total assessable deposits. 3.46 During the year 2021-22, deposit insurance premium of ₹19,491 crore was collected of which 93.6 per cent was contributed by commercial banks and the rest by co-operative banks. The Deposit Insurance Fund (DIF) stood at ₹1.47 lakh crore, yielding a reserve ratio (ratio of DIF to insured deposits) of 1.81 per cent (Table 3.3 and 3.4).
3.47 During the period April 2021 to March 2022, the Corporation has settled claims of five liquidated banks for an amount aggregating to ₹1,124.1 crore and 12 supplementary claims of liquidated banks aggregating to ₹100.9 crore. The aggregate of main claims and supplementary claims in respect of 16 urban co-operative banks amounted to ₹1,225 crore under Section 17 (1) of the DICGC Act 1961. In addition to the claims settled as mentioned above, an amount of ₹3,791.6 crore was provided to Unity Small Finance Bank (USFB) for making payment to the depositors of the erstwhile Punjab and Maharashtra Co-operative Bank Ltd (PMCBL) pursuant to the merger of PMCBL with USFB with effect from January 25, 2022 under Section 16 (2) of the DICGC Act, 1961. Thus, the total claims settled amounted to ₹5,059.1 crore18. As per the amended Section 18 A of DICGC Act, the Corporation shall settle the claims within 90 days of imposition of such directions. The claims settled under this channel in the case of 22 urban co-operative banks under All Inclusive Direction (AID) amounted to ₹3,457.4 crore as on March 31, 2022. Overall, the Corporation has settled aggregate claims of ₹8,516.6 crore under different channels during 2021-22. III.4.2 Corporate Insolvency Resolution Process (CIRP) 3.48 Since the inception of the Insolvency and Bankruptcy Code (IBC) in December 2016, 5,258 CIRPs have commenced by end-March 2022, of which 65 per cent have been closed. Of these, around 22 per cent were closed on appeal or review or settled, 17 per cent were withdrawn, 47 per cent ended in orders for liquidation and 14 per cent culminated in approval of resolution plans (Table 3.5). 3.49 Till March 31, 2022, 480 CIRPs have ended in resolution. Realisation by financial creditors (FCs) under resolution plans in comparison to liquidation value was 171 per cent while the realisation by them in comparison to their claims was 33 per cent. Forty seven per cent of the CIRPs, which were closed, yielded orders for liquidation, as compared with 14 per cent ending up with a resolution plan. The economic value in most of the corporate debtors (CDs) that ended in liquidation had almost completely eroded even before they were admitted into CIRP. These CDs had assets, on average, valued at less than 8 per cent of the outstanding debt amount (Table 3.6). 3.50 About 52 per cent of CIRPs initiated by operational creditors (OCs) were closed on appeal, review, or withdrawal. Such closures accounted for 71 per cent of all closures by appeal, review, or withdrawal (Table 3.7 and Table 3.8). III.4.3 Mutual Funds 3.51 The asset base of the mutual funds (MFs) industry (excluding domestic fund-of-funds or FoF) at ₹37.2 lakh crore as on May 31, 2022, has nearly doubled in a span of five years (₹19.04 lakh crore on May 31, 2017) (Table 3.9). The industry witnessed sustained inflows, despite volatile stock markets, especially since January 2022. The net inflows during November 2021 to May 2022 stood at ₹1.04 lakh crore. 3.52 Investments in MFs through systematic investment plans (SIPs) accounted for 15 per cent of the total assets under management (AUM) of the industry, as on May 31, 2022 (Table 3.10). III.4.4 Capital Market 3.53 The total capital raised in primary markets during the period 2021-22 stood at ₹8.3 lakh crore, as compared with a mobilisation of ₹10.1 lakh crore during 2020-21. Funds raised through equity public issues went up 2.4 times, whereas the total funds raised through issuances of CPs and listed NCDs went up by 5.8 per cent to ₹25.9 lakh crore during 2021-22 (Chart 3.2 a and b). 3.54 Issuances of bonds by NBFCs and HFCs were 17 per cent higher y-o-y during 2021-22. While issuances with AAA/A1+ rating dominated fund raising through corporate bonds, issuances with “AA and AA+/A1” rating categories also witnessed an increase of 24 per cent during the same period (Charts 3.3 a and b).  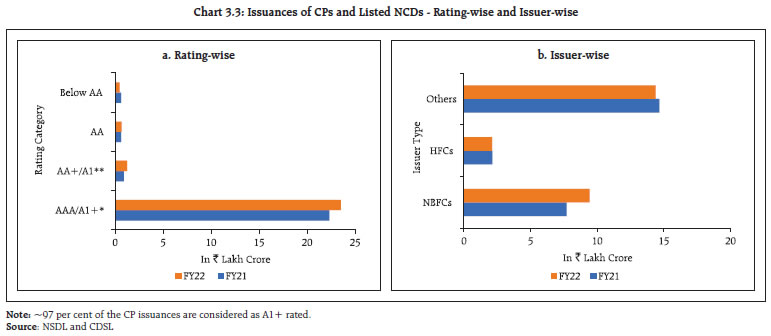 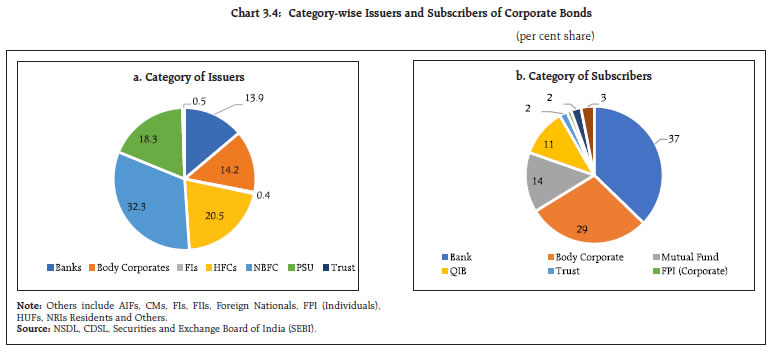 3.55 NBFCs and HFCs remained the major issuers, accounting for 53 per cent of total listed bonds during the year (Chart 3.4 a), whereas banks and body corporates were their major subscribers (Chart 3.4 b). III.4.5 Credit Ratings 3.56 The high incidence of downgrades in ratings of listed issues was arrested as the pandemic’s impact subsided. During Q4:2021-22, the share of downgraded listed issues by ICRA and CRISIL went down, whereas the same went up for CARE Ratings on a sequential basis (Chart 3.5). 3.57 The rating downgrades are distributed across sectors. The combined share of NBFCs and HFCs went up from 18 per cent to 29 per cent during Q4:2021-22 (Chart 3.6).  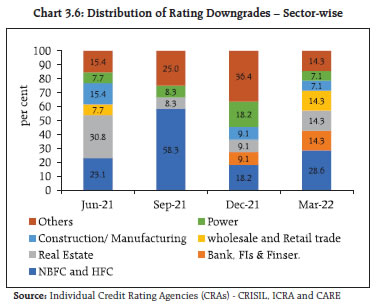 III.4.6 Insurance 3.58 During the first two months of current financial year (April-May 2022), the First Year Premium (FYP) of Life Insurance Business has gone up by 86.7 per cent when compared to the same period of last financial year say April-May 2021 (Chart 3.7). The spike in performance of Life Insurance premium during April-May 2022 vis-à-vis April-May 2021 is due to the base effect. The life insurance industry experienced low level of activities during the period April-May 2021 on account of second wave of the pandemic. However, the industry experienced normal level of activities during the period April-May 2022. 3.59 During the period April-May 2022, the Total Premium (First Year Premium + Renewal) experienced 39.1 percent growth when compared to the same period of last year say April-May 2021. (Chart 3.8). 3.60 During the period April 2020-May 2022, the life insurance industry received 2.35 lakh claims aggregating to ₹18,135 crore for COVID related deaths. Of these, 2.34 lakh death claims amounting to ₹17,606 crore were settled. The claim paid ratio in the above cases stood at 99.18 per cent in number and 97.08 per cent in amount. 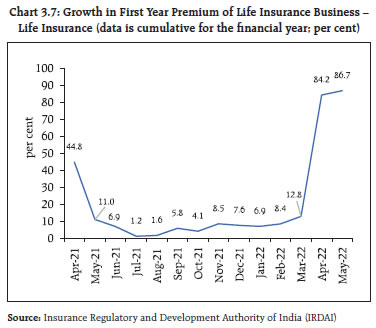 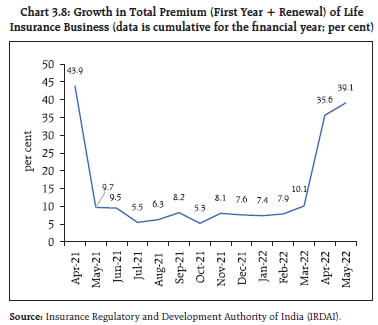 III.4.7 Pension Funds 3.61 The National Pension System (NPS) and the Atal Pension Yojana (APY) recorded a 22.6 per cent annual growth in number of subscribers and 27.3 per cent growth in the corpus during 2021-22 (Charts 3.9 and 3.10). 3.62 Both the NPS and the APY have progressed in terms of the total number of subscribers and AUM. Their combined subscriber base and AUM have reached 5.13 crores and ₹7,23,418 crores, respectively, of which APY has 3.62 crores of subscribers and AUM of ₹20,922 crores. Summary and Outlook 3.63 Amidst the major challenges facing the global financial system emanating from the pandemic, geopolitical tensions and other shocks, technological innovations that have the potential to disrupt financial stability engaged the attention of regulators and other policymakers during 2021-22. The core of the financial system continues to exhibit resilience, a triumph for the post-GFC regulatory reforms that improved banking system resilience through higher capital buffers and improved liquidity standards. The NBFI sector, however, poses a hazard as the regulatory reform agenda is still unfinished. The growing threat of the crypto-assets ecosystem warrants drastic approaches by national authorities. Ongoing challenges relating to cyber risk and climate-related financial risks are the two other major focus areas for policy makers. 3.64 On the domestic front, efforts to improve financial system resilience continues. Regulators took several measures to strengthen financial intermediaries, accelerate digitalisation of the economy, develop market segments, improve access of retail investors and protect the interests of depositors/investors. The fast-changing financial landscape is keeping regulators on the vigil to not only safeguard the financial system from shocks, but also unlock its potential to drive economic growth. 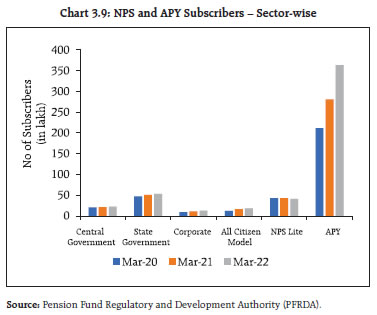 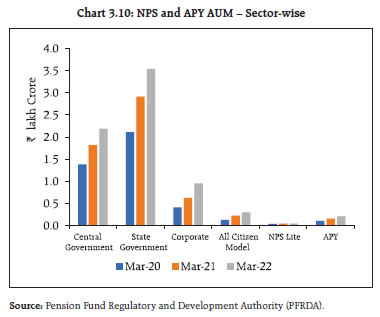 1 Financial Stability Board (2022), “FSB Chair’s letter to G20 Finance Ministers and Central Bank Governors”, February. 2 Financial Stability Board (2022), “Assessment of Risks to Financial Stability from Crypto-assets”, February. 3 International Organisation of Securities Commissions (2022), “IOSCO Decentralized Finance Report”, March. 4 DeFi refers to the provision of financial products, services, arrangements and activities that use distributed ledger technology (“DLT”) in an effort to disintermediate and decentralise legacy ecosystems by eliminating the need for some traditional financial intermediaries and centralised institutions (ibid). 5 Financial Stability Board (2020), “Approaches to Debt Overhang Issues of Non-Financial Corporates”, February. 6 IOSCO (2022), “Corporate Bond Markets – Drivers of Liquidity During COVID-19 Induced Market Stresses”, April. 7 ESMA (2022), “ESMA opinion on the review of the Money Market Fund Regulation”, February. 8 European Systemic Risk Board (2022),” Mitigating systemic cyber risk”, January. 9 Financial Stability Board (2022),” Supervisory and Regulatory Approaches to Climate-related Risks: Interim Report”, April. 10 A DBU is a specialised fixed point business unit/hub housing certain minimum digital infrastructure for delivering digital banking products and services as well as servicing existing financial products and services digitally, in both self-service and assisted mode, to enable customers to have cost effective/convenient access and enhanced digital experience to/of such products and services in an efficient, paperless, secured and connected environment with most services being available in self-service mode at any time, all year round. 11 Report by Allied Market Research, (September 2021) (weblink: https://www.alliedmarketresearch.com/fintech-technologies-market). 12 Boston Consulting Group and FICCI (2021), “Indian Fintech, A USD 100 Billion Opportunity”, March. 13 A dashboard by Invest India on BFSI-Fintech and Financial Services available at https://www.investindia.gov.in/sector/bfsi-fintech-financial-services. 14 Bains, Parma, Sugimoto, Nobuyasu and Wilson, Christopher (2022), “BigTech in Financial Services: Regulatory Approaches and Architecture”, Fin- Tech Note, International Monetary Fund, January. 15 Includes complaints related to fees/charges related to deposit accounts. 16 The Reserve bank has released draft Directions (Margining for Non-Centrally Cleared OTC Derivatives Directions, 2022) prescribing guidelines for exchange of initial margin for NCCDs on June 16, 2022. It has invited comments/feedback on the same from banks, market participants and other interested parties by July 29, 2022. 17 NCDEX GUAREX is a commodity futures price index on Guar Complex Commodities. 18 Inclusive of main claims settled under the expeditious claims settlement policy of the Corporation for an amount of ₹42.6 crore in case of three co-operative banks. | ||||||||||||||||||||||||||||||||||||||||||||||||||||||||||||||||||||||||||||||||||||||||||||||||||||||||||||||
Page Last Updated on:


