|
Today, the Reserve Bank released the results of its bi-monthly Rural Consumer Confidence Survey (RCCS)1 2 for the first time. This survey is being conducted on regular basis since September 2023. In each round, the survey targets to cover 9,000 rural and semi urban households from all Indian states and three major union territories (UTs)3. The survey collects current perceptions (vis-à-vis a year ago) and one year ahead expectations of households on general economic situation, employment scenario, overall price situation, own income and spending from the households residing in the rural and semi-urban4 areas. This survey also collates information on households' current inflation perception and their expectation for the year ahead.
The latest round of the survey was conducted from March 1 to 10, 2025, encompassing 8,964 valid responses. An article detailing the sampling method, coverage and other related information of this survey will be published in the upcoming issue of RBI Bulletin.
Highlights:
-
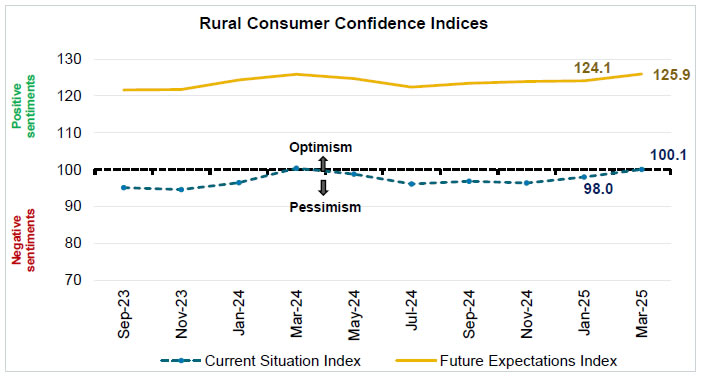
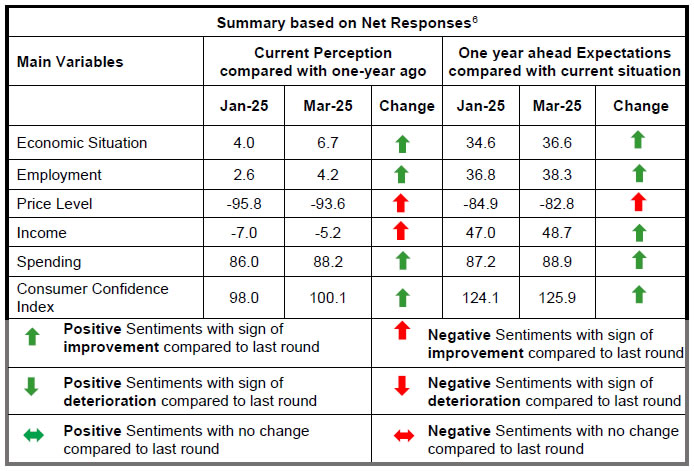
Rural consumer confidence for the current period has improved in the last two rounds; the Current Situation Index (CSI)5 has registered an uptick owing to broad-based improvement across all survey parameters in the March 2025 round and crossed the neutral line (Chart 1; Tables 1, 2, 3, 5, 6 and 9).
-
The one-year-ahead outlook, as captured by the Future Expectations Index (FEI), continued to reflect optimism, with further improvement recorded in the latest survey round (Chart 1; Tables 9).
-
The share of rural households anticipating rise in prices and inflation has declined in the current round of survey for both the time horizons (Tables 3 and 4).
-
Consequently, households' current perception of inflation eased by 40 basis points to 6.6 per cent in March 2025 compared to the previous round. Their inflation expectations for the year ahead also moderated by 30 basis points to 9.3 per cent (Table 12).
Note: Please see the excel file for time series data.
| Table 1: Perceptions and Expectations on the General Economic Situation |
| (Percentage responses) |
| Survey Round |
Current Perception |
One year ahead Expectation |
| Improve |
Remained same |
Worsened |
Net Response |
Improve |
Remains same |
Worsen |
Net Response |
| Sep-23 |
40.8 |
20.4 |
38.8 |
2.0 |
58.0 |
16.5 |
25.6 |
32.4 |
| Nov-23 |
39.0 |
21.7 |
39.3 |
-0.3 |
58.5 |
16.4 |
25.2 |
33.3 |
| Jan-24 |
41.7 |
23.3 |
35.1 |
6.6 |
61.8 |
16.4 |
21.8 |
40.0 |
| Mar-24 |
45.9 |
23.1 |
31.0 |
14.9 |
63.3 |
15.8 |
20.9 |
42.4 |
| May-24 |
44.6 |
22.4 |
33.0 |
11.6 |
61.2 |
17.2 |
21.7 |
39.5 |
| Jul-24 |
39.6 |
25.6 |
34.8 |
4.8 |
58.1 |
16.9 |
25.0 |
33.1 |
| Sep-24 |
39.9 |
25.4 |
34.8 |
5.1 |
57.2 |
19.2 |
23.6 |
33.6 |
| Nov-24 |
38.2 |
24.7 |
37.1 |
1.1 |
57.9 |
18.1 |
24.0 |
34.0 |
| Jan-25 |
39.4 |
25.2 |
35.4 |
4.0 |
58.8 |
17.0 |
24.2 |
34.6 |
| Mar-25 |
41.4 |
23.8 |
34.7 |
6.7 |
60.0 |
16.6 |
23.4 |
36.6 |
| Notes: Up to May 2024, figures are based on 26 states/ UTs; from July 2024, figures are compiled based on 31 states/ UTs; |
| Table 2: Perceptions and Expectations on Employment |
| (Percentage responses) |
| Survey Round |
Current Perception |
One year ahead Expectation |
| Improved |
Remained same |
Worsened |
Net Response |
Improve |
Remains same |
Worsen |
Net Response |
| Sep-23 |
36.9 |
25.1 |
38.1 |
-1.2 |
56.3 |
19.9 |
23.8 |
32.5 |
| Nov-23 |
36.9 |
24.4 |
38.7 |
-1.8 |
57.7 |
19.0 |
23.3 |
34.4 |
| Jan-24 |
37.8 |
25.6 |
36.6 |
1.2 |
61.0 |
18.1 |
20.9 |
40.1 |
| Mar-24 |
40.6 |
24.8 |
34.6 |
6.0 |
62.1 |
17.5 |
20.4 |
41.7 |
| May-24 |
39.4 |
23.8 |
36.8 |
2.5 |
60.4 |
18.5 |
21.2 |
39.2 |
| Jul-24 |
35.0 |
27.1 |
37.9 |
-2.9 |
57.7 |
19.0 |
23.3 |
34.4 |
| Sep-24 |
35.9 |
26.2 |
37.9 |
-2.0 |
57.1 |
20.9 |
22.1 |
35.0 |
| Nov-24 |
36.6 |
25.6 |
37.8 |
-1.2 |
58.4 |
19.4 |
22.2 |
36.1 |
| Jan-25 |
38.4 |
25.8 |
35.8 |
2.6 |
58.9 |
19.0 |
22.1 |
36.8 |
| Mar-25 |
39.6 |
24.9 |
35.4 |
4.2 |
59.8 |
18.8 |
21.5 |
38.3 |
| Notes: Up to May 2024, figures are based on 26 states/ UTs; from July 2024, figures are compiled based on 31 states/ UTs; |
| Table 3: Perceptions and Expectations on Price Level |
| (Percentage responses) |
| Survey Round |
Current Perception |
One year ahead Expectation |
| Increased |
Remained Same |
Decreased |
Net Response |
Will Increase |
Will Remain Same |
Will Decrease |
Net Response |
| Sep-23 |
94.9 |
3.9 |
1.2 |
-93.7 |
87.8 |
5.7 |
6.5 |
-81.3 |
| Nov-23 |
95.4 |
3.7 |
0.9 |
-94.4 |
90.2 |
5.2 |
4.6 |
-85.5 |
| Jan-24 |
94.7 |
4.6 |
0.7 |
-94.0 |
90.0 |
5.2 |
4.8 |
-85.2 |
| Mar-24 |
94.6 |
4.3 |
1.1 |
-93.5 |
90.2 |
5.7 |
4.1 |
-86.1 |
| May-24 |
94.6 |
4.3 |
1.1 |
-93.5 |
90.3 |
5.3 |
4.4 |
-85.9 |
| Jul-24 |
96.2 |
3.2 |
0.6 |
-95.6 |
91.2 |
4.7 |
4.1 |
-87.1 |
| Sep-24 |
96.1 |
2.7 |
1.1 |
-95.0 |
89.6 |
5.2 |
5.2 |
-84.5 |
| Nov-24 |
96.6 |
3.0 |
0.4 |
-96.3 |
90.0 |
5.0 |
5.0 |
-85.0 |
| Jan-25 |
96.2 |
3.3 |
0.4 |
-95.8 |
90.0 |
5.0 |
5.1 |
-84.9 |
| Mar-25 |
95.1 |
3.4 |
1.5 |
-93.6 |
88.7 |
5.4 |
5.9 |
-82.8 |
| Notes: Up to May 2024, figures are based on 26 states/ UTs; from July 2024, figures are compiled based on 31 states/ UTs; |
| Table 4: Perceptions and Expectations on Rate of Change in Price Level (Inflation)* |
| (Percentage responses) |
| Survey Round |
Current Perception |
One year ahead Expectation |
| Price increase more than last year |
Price increase similar to last year |
Price increase less than last year |
Net Response |
Price increase more than current rate |
Price increase similar to current rate |
Price increase less than current rate |
Net Response |
| Sep-23 |
89.9 |
7.5 |
2.7 |
-87.2 |
88.8 |
6.6 |
4.6 |
-84.3 |
| Nov-23 |
89.8 |
7.1 |
3.1 |
-86.7 |
91.4 |
5.7 |
2.9 |
-88.5 |
| Jan-24 |
88.8 |
8.0 |
3.2 |
-85.6 |
91.6 |
5.1 |
3.3 |
-88.3 |
| Mar-24 |
78.1 |
17.2 |
4.7 |
-73.4 |
82.5 |
14.3 |
3.1 |
-79.4 |
| May-24 |
78.9 |
15.4 |
5.7 |
-73.2 |
82.3 |
15.3 |
2.4 |
-80.0 |
| Jul-24 |
80.5 |
15.2 |
4.3 |
-76.2 |
83.6 |
13.5 |
2.9 |
-80.7 |
| Sep-24 |
80.6 |
14.6 |
4.8 |
-75.8 |
81.8 |
15.4 |
2.8 |
-79.0 |
| Nov-24 |
82.3 |
14.2 |
3.5 |
-78.8 |
83.6 |
12.3 |
4.2 |
-79.4 |
| Jan-25 |
80.4 |
16.5 |
3.1 |
-77.3 |
80.5 |
16.3 |
3.2 |
-77.2 |
| Mar-25 |
78.3 |
17.4 |
4.3 |
-74.0 |
79.3 |
16.0 |
4.7 |
-74.6 |
Notes: *Applicable only for those respondents who felt price has increased/price will increase.
Up to May 2024, figures are based on 26 states/ UTs; from July 2024, figures are compiled based on 31 states/ UTs; |
| Table 5: Perceptions and Expectations on Income |
| (Percentage responses) |
| Survey Round |
Current Perception |
One year ahead Expectation |
| Increased |
Remained Same |
Decreased |
Net Response |
Will Increase |
Will Remain Same |
Will Decrease |
Net Response |
| Sep-23 |
23.6 |
43.9 |
32.5 |
-8.9 |
55.8 |
32.3 |
11.9 |
43.9 |
| Nov-23 |
24.5 |
43.1 |
32.4 |
-8.0 |
56.8 |
31.3 |
11.9 |
45.0 |
| Jan-24 |
22.4 |
47.3 |
30.3 |
-7.9 |
57.4 |
30.7 |
11.9 |
45.5 |
| Mar-24 |
23.8 |
47.6 |
28.6 |
-4.8 |
59.0 |
30.3 |
10.7 |
48.4 |
| May-24 |
22.5 |
46.4 |
31.2 |
-8.7 |
57.4 |
31.0 |
11.6 |
45.8 |
| Jul-24 |
22.7 |
45.0 |
32.4 |
-9.7 |
57.5 |
30.5 |
12.0 |
45.5 |
| Sep-24 |
23.3 |
44.1 |
32.6 |
-9.3 |
57.1 |
31.9 |
11.0 |
46.2 |
| Nov-24 |
24.2 |
43.3 |
32.5 |
-8.3 |
58.2 |
30.1 |
11.7 |
46.5 |
| Jan-25 |
23.7 |
45.6 |
30.7 |
-7.0 |
58.4 |
30.1 |
11.5 |
47.0 |
| Mar-25 |
24.7 |
45.3 |
29.9 |
-5.2 |
59.0 |
30.8 |
10.3 |
48.7 |
| Notes: Up to May 2024, figures are based on 26 states/ UTs; from July 2024, figures are compiled based on 31 states/ UTs; |
| Table 6: Perceptions and Expectations on Spending |
| (Percentage responses) |
| Survey Round |
Current Perception |
One year ahead Expectation |
| Increased |
Remained Same |
Decreased |
Net Response |
Will Increase |
Will Remain Same |
Will Decrease |
Net Response |
| Sep-23 |
81.2 |
15.0 |
3.8 |
77.4 |
84.2 |
12.3 |
3.5 |
80.6 |
| Nov-23 |
80.8 |
16.0 |
3.2 |
77.6 |
84.6 |
12.4 |
3.0 |
81.6 |
| Jan-24 |
80.0 |
16.5 |
3.5 |
76.5 |
84.4 |
12.2 |
3.3 |
81.1 |
| Mar-24 |
82.5 |
14.4 |
3.1 |
79.5 |
85.7 |
11.6 |
2.8 |
82.9 |
| May-24 |
85.0 |
12.3 |
2.7 |
82.3 |
87.1 |
10.4 |
2.5 |
84.7 |
| Jul-24 |
86.2 |
11.5 |
2.2 |
84.0 |
88.5 |
9.1 |
2.4 |
86.1 |
| Sep-24 |
87.9 |
9.7 |
2.5 |
85.4 |
88.8 |
9.2 |
2.0 |
86.9 |
| Nov-24 |
88.5 |
9.6 |
1.9 |
86.6 |
90.0 |
8.0 |
2.0 |
88.0 |
| Jan-25 |
87.9 |
10.3 |
1.9 |
86.0 |
89.0 |
9.3 |
1.8 |
87.2 |
| Mar-25 |
90.5 |
7.3 |
2.2 |
88.2 |
90.8 |
7.4 |
1.9 |
88.9 |
| Notes: Up to May 2024, figures are based on 26 states/ UTs; from July 2024, figures are compiled based on 31 states/ UTs; |
| Table 7: Perceptions and Expectations on Spending- Essential Items |
| (Percentage responses) |
| Survey Round |
Current Perception |
One year ahead Expectation |
| Increased |
Remained Same |
Decreased |
Net Response |
Will Increase |
Will Remain Same |
Will Decrease |
Net Response |
| Sep-23 |
86.5 |
10.4 |
3.1 |
83.4 |
86.8 |
9.9 |
3.4 |
83.4 |
| Nov-23 |
86.8 |
10.3 |
2.9 |
83.9 |
88.2 |
9.2 |
2.6 |
85.6 |
| Jan-24 |
85.8 |
11.7 |
2.5 |
83.3 |
87.4 |
9.5 |
3.1 |
84.3 |
| Mar-24 |
85.1 |
12.1 |
2.8 |
82.3 |
88.0 |
9.4 |
2.6 |
85.4 |
| May-24 |
87.2 |
10.4 |
2.4 |
84.8 |
88.8 |
8.6 |
2.5 |
86.3 |
| Jul-24 |
88.1 |
9.6 |
2.3 |
85.8 |
89.2 |
8.4 |
2.5 |
86.7 |
| Sep-24 |
89.1 |
8.5 |
2.4 |
86.7 |
89.9 |
8.0 |
2.1 |
87.8 |
| Nov-24 |
89.1 |
8.9 |
2.1 |
87.0 |
90.0 |
7.9 |
2.1 |
87.9 |
| Jan-25 |
87.9 |
9.5 |
2.6 |
85.4 |
89.5 |
8.2 |
2.3 |
87.2 |
| Mar-25 |
89.8 |
8.0 |
2.2 |
87.6 |
91.2 |
6.9 |
2.0 |
89.2 |
| Notes: Up to May 2024, figures are based on 26 states/ UTs; from July 2024, figures are compiled based on 31 states/ UTs; |
| Table 8: Perceptions and Expectations on Spending- Non-Essential Items |
| (Percentage responses) |
| Survey Round |
Current Perception |
One year ahead Expectation |
| Increased |
Remained Same |
Decreased |
Net Response |
Will Increase |
Will Remain Same |
Will Decrease |
Net Response |
| Sep-23 |
44.4 |
31.9 |
23.7 |
20.7 |
53.6 |
28.1 |
18.3 |
35.4 |
| Nov-23 |
47.2 |
30.5 |
22.3 |
24.9 |
56.1 |
27.5 |
16.4 |
39.6 |
| Jan-24 |
46.5 |
30.9 |
22.6 |
23.9 |
56.4 |
26.5 |
17.1 |
39.3 |
| Mar-24 |
51.8 |
25.5 |
22.8 |
29.0 |
63.8 |
23.2 |
13.0 |
50.8 |
| May-24 |
53.6 |
22.3 |
24.1 |
29.5 |
66.3 |
21.3 |
12.5 |
53.9 |
| Jul-24 |
53.9 |
21.0 |
25.2 |
28.7 |
67.5 |
19.6 |
12.9 |
54.5 |
| Sep-24 |
55.6 |
18.3 |
26.1 |
29.4 |
68.2 |
18.7 |
13.0 |
55.2 |
| Nov-24 |
57.3 |
18.5 |
24.2 |
33.2 |
68.1 |
19.1 |
12.8 |
55.4 |
| Jan-25 |
57.3 |
19.7 |
23.1 |
34.2 |
68.1 |
19.6 |
12.4 |
55.7 |
| Mar-25 |
58.4 |
19.1 |
22.5 |
35.9 |
69.6 |
18.2 |
12.3 |
57.3 |
| Notes: Up to May 2024, figures are based on 26 states/ UTs; from July 2024, figures are compiled based on 31 states/ UTs; |
| Table 9: Rural Consumer Confidence Indices |
| Survey Round |
Current Situation Index (CSI) |
Future Expectations Index (FEI) |
| Sep-23 |
95.1 |
121.6 |
| Nov-23 |
94.6 |
121.7 |
| Jan-24 |
96.5 |
124.3 |
| Mar-24 |
100.4 |
125.9 |
| May-24 |
98.8 |
124.7 |
| Jul-24 |
96.1 |
122.4 |
| Sep-24 |
96.9 |
123.4 |
| Nov-24 |
96.4 |
123.9 |
| Jan-25 |
98.0 |
124.1 |
| Mar-25 |
100.1 |
125.9 |
| Table 10: Current Period Median Inflation Perception of the Various Groups |
| |
Sep-23 |
Nov-23 |
Jan-24 |
| Estimate |
SE |
Estimate |
SE |
Estimate |
SE |
| Overall |
7.1 |
0.29 |
7.0 |
0.30 |
6.7 |
0.18 |
| Gender-wise |
|
|
|
|
|
|
| Male |
7.2 |
0.28 |
7.1 |
0.29 |
7.1 |
0.23 |
| Female |
7.0 |
0.44 |
7.0 |
0.56 |
6.4 |
0.26 |
| Category-wise |
|
|
|
|
|
|
| Salaried Employees |
7.5 |
0.41 |
7.0 |
0.36 |
6.7 |
0.43 |
| Self Employed |
6.9 |
0.41 |
6.9 |
0.52 |
7.5 |
0.41 |
| Homemakers |
7.3 |
0.48 |
7.0 |
0.61 |
6.2 |
0.24 |
| Retired Persons |
5.9 |
0.17 |
6.8 |
0.55 |
7.6 |
0.55 |
| Daily Workers |
6.9 |
0.51 |
7.2 |
0.54 |
6.7 |
0.32 |
| Other category |
6.7 |
0.35 |
6.5 |
0.43 |
6.6 |
0.40 |
| Age Group-wise |
|
|
|
|
|
|
| 21 to 29 years |
6.9 |
0.31 |
6.7 |
0.32 |
6.4 |
0.27 |
| 30 to 39 years |
7.2 |
0.45 |
7.3 |
0.40 |
6.8 |
0.28 |
| 40 to 59 years |
7.0 |
0.44 |
6.9 |
0.59 |
6.7 |
0.34 |
| 60 years and above |
7.0 |
0.54 |
6.6 |
0.35 |
7.7 |
0.59 |
| |
Mar-24 |
May-24 |
Jul-24 |
| Estimate |
SE |
Estimate |
SE |
Estimate |
SE |
| Overall |
6.5 |
0.21 |
6.4 |
0.21 |
6.8 |
0.22 |
| Gender-wise |
|
|
|
|
|
|
| Male |
6.5 |
0.27 |
6.4 |
0.26 |
7.1 |
0.24 |
| Female |
6.7 |
0.32 |
6.3 |
0.23 |
6.7 |
0.30 |
| Category-wise |
|
|
|
|
|
|
| Salaried Employees |
6.8 |
0.39 |
6.4 |
0.41 |
6.9 |
0.49 |
| Self Employed |
6.3 |
0.28 |
6.4 |
0.38 |
7.5 |
0.34 |
| Homemakers |
6.8 |
0.34 |
6.2 |
0.24 |
6.5 |
0.31 |
| Retired Persons |
6.4 |
0.50 |
6.7 |
0.68 |
6.8 |
0.65 |
| Daily Workers |
6.4 |
0.35 |
6.4 |
0.31 |
6.8 |
0.33 |
| Other category |
6.4 |
0.34 |
6.2 |
0.37 |
7.1 |
0.36 |
| Age Group-wise |
|
|
|
|
|
|
| 21 to 29 years |
6.4 |
0.24 |
6.5 |
0.29 |
6.6 |
0.25 |
| 30 to 39 years |
7.0 |
0.46 |
6.4 |
0.32 |
7.0 |
0.32 |
| 40 to 59 years |
6.5 |
0.33 |
6.4 |
0.35 |
6.9 |
0.34 |
| 60 years and above |
6.2 |
0.55 |
7.6 |
0.74 |
7.1 |
0.45 |
| |
Sep-24 |
Nov-24 |
Jan-25 |
| Estimate |
SE |
Estimate |
SE |
Estimate |
SE |
| Overall |
6.7 |
0.23 |
7.1 |
0.19 |
7.0 |
0.19 |
| Gender-wise |
|
|
|
|
|
|
| Male |
6.9 |
0.26 |
7.6 |
0.22 |
7.5 |
0.21 |
| Female |
6.5 |
0.29 |
6.8 |
0.28 |
6.7 |
0.22 |
| Category-wise |
|
|
|
|
|
|
| Salaried Employees |
6.9 |
0.39 |
7.6 |
0.33 |
7.6 |
0.35 |
| Self Employed |
7.1 |
0.39 |
7.3 |
0.29 |
7.1 |
0.37 |
| Homemakers |
6.3 |
0.30 |
6.8 |
0.27 |
6.7 |
0.24 |
| Retired Persons |
7.6 |
0.60 |
8.7 |
0.97 |
9.3 |
0.61 |
| Daily Workers |
6.6 |
0.36 |
7.4 |
0.34 |
7.0 |
0.43 |
| Other category |
7.0 |
0.33 |
7.1 |
0.36 |
7.2 |
0.25 |
| Age Group-wise |
|
|
|
|
|
|
| 21 to 29 years |
6.9 |
0.27 |
6.4 |
0.22 |
6.7 |
0.22 |
| 30 to 39 years |
6.5 |
0.29 |
7.2 |
0.25 |
6.9 |
0.31 |
| 40 to 59 years |
6.8 |
0.33 |
7.6 |
0.31 |
7.1 |
0.29 |
| 60 years and above |
6.8 |
0.41 |
8.0 |
0.56 |
8.7 |
0.56 |
| |
Mar-25 |
|
|
| Estimate |
SE |
|
|
|
|
| Overall |
6.6 |
0.23 |
|
|
|
|
| Gender-wise |
|
|
|
|
|
|
| Male |
6.7 |
0.27 |
|
|
|
|
| Female |
6.4 |
0.26 |
|
|
|
|
| Category-wise |
|
|
|
|
|
|
| Salaried Employees |
6.5 |
0.35 |
|
|
|
|
| Self Employed |
6.9 |
0.38 |
|
|
|
|
| Homemakers |
6.4 |
0.29 |
|
|
|
|
| Retired Persons |
7.6 |
0.83 |
|
|
|
|
| Daily Workers |
6.6 |
0.39 |
|
|
|
|
| Other category |
6.1 |
0.25 |
|
|
|
|
| Age Group-wise |
|
|
|
|
|
|
| 21 to 29 years |
6.5 |
0.24 |
|
|
|
|
| 30 to 39 years |
6.8 |
0.29 |
|
|
|
|
| 40 to 59 years |
6.4 |
0.30 |
|
|
|
|
| 60 years and above |
7.2 |
0.59 |
|
|
|
|
Notes: The table provides estimates and standard errors (SE) for quantitative responses.
Up to May 2024, figures are based on 26 states/ UTs; from July 2024, figures are compiled based on 31 states/ UTs; |
| Table 11: One Year Ahead Median Inflation Expectations of Various Groups |
| |
Sep-23 |
Nov-23 |
Jan-24 |
| Estimate |
SE |
Estimate |
SE |
Estimate |
SE |
| Overall |
9.0 |
0.25 |
10.1 |
0.24 |
9.5 |
0.37 |
| Gender-wise |
|
|
|
|
|
|
| Male |
9.0 |
0.31 |
10.1 |
0.22 |
9.8 |
0.35 |
| Female |
8.9 |
0.31 |
9.8 |
0.48 |
8.9 |
0.34 |
| Category-wise |
|
|
|
|
|
|
| Salaried Employees |
9.0 |
0.34 |
9.4 |
0.44 |
9.3 |
0.60 |
| Self Employed |
8.6 |
0.34 |
10.1 |
0.25 |
9.9 |
0.38 |
| Homemakers |
9.3 |
0.47 |
9.6 |
0.53 |
8.8 |
0.34 |
| Retired Persons |
8.2 |
0.25 |
10.1 |
0.33 |
10.2 |
0.54 |
| Daily Workers |
9.3 |
0.54 |
10.5 |
0.35 |
9.3 |
0.54 |
| Other category |
8.8 |
0.32 |
9.8 |
0.49 |
9.5 |
0.48 |
| Age Group-wise |
|
|
|
|
|
|
| 21 to 29 years |
8.9 |
0.26 |
9.7 |
0.39 |
9.2 |
0.41 |
| 30 to 39 years |
9.5 |
0.48 |
10.2 |
0.20 |
9.2 |
0.47 |
| 40 to 59 years |
8.7 |
0.32 |
10.0 |
0.46 |
9.4 |
0.40 |
| 60 years and above |
9.9 |
0.49 |
9.6 |
0.64 |
10.3 |
0.37 |
| |
Mar-24 |
May-24 |
Jul-24 |
| Estimate |
SE |
Estimate |
SE |
Estimate |
SE |
| Overall |
9.4 |
0.20 |
9.6 |
0.23 |
9.8 |
0.22 |
| Gender-wise |
|
|
|
|
|
|
| Male |
9.6 |
0.26 |
9.6 |
0.29 |
9.8 |
0.24 |
| Female |
9.4 |
0.30 |
9.8 |
0.25 |
9.9 |
0.21 |
| Category-wise |
|
|
|
|
|
|
| Salaried Employees |
9.9 |
0.25 |
9.8 |
0.45 |
9.6 |
0.41 |
| Self Employed |
9.5 |
0.32 |
9.5 |
0.41 |
9.8 |
0.29 |
| Homemakers |
9.7 |
0.32 |
9.8 |
0.30 |
9.9 |
0.25 |
| Retired Persons |
9.6 |
0.49 |
9.1 |
1.01 |
9.4 |
0.64 |
| Daily Workers |
9.8 |
0.27 |
9.5 |
0.39 |
9.7 |
0.36 |
| Other category |
9.0 |
0.42 |
9.9 |
0.31 |
10.0 |
0.28 |
| Age Group-wise |
|
|
|
|
|
|
| 21 to 29 years |
9.3 |
0.24 |
9.6 |
0.29 |
9.6 |
0.29 |
| 30 to 39 years |
9.5 |
0.44 |
10.0 |
0.24 |
9.8 |
0.27 |
| 40 to 59 years |
9.3 |
0.32 |
9.6 |
0.31 |
9.8 |
0.32 |
| 60 years and above |
9.8 |
0.44 |
9.6 |
0.52 |
9.5 |
0.39 |
| |
Sep-24 |
Nov-24 |
Jan-25 |
| Estimate |
SE |
Estimate |
SE |
Estimate |
SE |
| Overall |
9.6 |
0.24 |
9.7 |
0.23 |
9.6 |
0.24 |
| Gender-wise |
|
|
|
|
|
|
| Male |
9.5 |
0.26 |
10.0 |
0.22 |
9.7 |
0.30 |
| Female |
9.7 |
0.28 |
9.5 |
0.32 |
9.6 |
0.29 |
| Category-wise |
|
|
|
|
|
|
| Salaried Employees |
9.8 |
0.35 |
9.3 |
0.33 |
10.0 |
0.30 |
| Self Employed |
9.3 |
0.30 |
9.7 |
0.41 |
9.3 |
0.32 |
| Homemakers |
9.4 |
0.34 |
9.5 |
0.31 |
9.6 |
0.31 |
| Retired Persons |
10.0 |
0.63 |
10.5 |
1.39 |
9.9 |
0.66 |
| Daily Workers |
9.5 |
0.47 |
9.9 |
0.37 |
9.4 |
0.45 |
| Other category |
9.7 |
0.38 |
9.4 |
0.47 |
9.1 |
0.33 |
| Age Group-wise |
|
|
|
|
|
|
| 21 to 29 years |
9.6 |
0.25 |
9.1 |
0.30 |
9.4 |
0.28 |
| 30 to 39 years |
9.4 |
0.29 |
9.5 |
0.33 |
9.7 |
0.29 |
| 40 to 59 years |
9.5 |
0.30 |
9.9 |
0.27 |
9.3 |
0.37 |
| 60 years and above |
9.3 |
0.49 |
10.1 |
0.46 |
10.0 |
0.40 |
| |
Mar-25 |
|
|
| Estimate |
SE |
|
|
|
|
| Overall |
9.3 |
0.23 |
|
|
|
|
| Gender-wise |
|
|
|
|
|
|
| Male |
9.3 |
0.29 |
|
|
|
|
| Female |
9.2 |
0.28 |
|
|
|
|
| Category-wise |
|
|
|
|
|
|
| Salaried Employees |
9.1 |
0.32 |
|
|
|
|
| Self Employed |
9.0 |
0.34 |
|
|
|
|
| Homemakers |
9.5 |
0.31 |
|
|
|
|
| Retired Persons |
9.5 |
0.79 |
|
|
|
|
| Daily Workers |
9.3 |
0.36 |
|
|
|
|
| Other category |
8.8 |
0.29 |
|
|
|
|
| Age Group-wise |
|
|
|
|
|
|
| 21 to 29 years |
9.2 |
0.31 |
|
|
|
|
| 30 to 39 years |
9.0 |
0.29 |
|
|
|
|
| 40 to 59 years |
9.2 |
0.28 |
|
|
|
|
| 60 years and above |
9.8 |
0.46 |
|
|
|
|
Notes: The table provides estimates and standard errors (SE) for quantitative responses.
Up to May 2024, figures are based on 26 states/ UTs; from July 2024, figures are compiled based on 31 states/ UTs; |
| Table 12: Household Inflation Expectations – Current Perception and One Year Ahead Expectations |
| Survey Round |
Current Perception |
One Year ahead Expectation |
| Median |
Median |
| Estimate |
SE |
Estimate |
SE |
| Sep-23 |
7.1 |
0.29 |
9.0 |
0.25 |
| Nov-23 |
7.0 |
0.30 |
10.1 |
0.24 |
| Jan-24 |
6.7 |
0.18 |
9.5 |
0.37 |
| Mar-24 |
6.5 |
0.21 |
9.4 |
0.20 |
| May-24 |
6.4 |
0.21 |
9.6 |
0.23 |
| Jul-24 |
6.8 |
0.22 |
9.8 |
0.22 |
| Sep-24 |
6.7 |
0.23 |
9.6 |
0.24 |
| Nov-24 |
7.1 |
0.19 |
9.7 |
0.23 |
| Jan-25 |
7.0 |
0.19 |
9.6 |
0.24 |
| Mar-25 |
6.6 |
0.23 |
9.3 |
0.23 |
Notes: The table provides estimates and standard errors (SE) for quantitative responses.
Up to May 2024, figures are based on 26 states/ UTs; from July 2024, figures are compiled based on 31 states/ UTs; |
| Table 13: Cross-tabulation of Number of Respondents by Current Inflation Perception and One Year Ahead Inflation Expectations: Mar-25 |
| One Year Ahead Inflation Rate (per cent) |
| Current Inflation Rate (per cent) |
|
<1 |
1-<2 |
2-<3 |
3-<4 |
4-<5 |
5-<6 |
6-<7 |
7-<8 |
8-<9 |
9-<10 |
10-<11 |
11-<12 |
12-<13 |
13-<14 |
14-<15 |
15-<16 |
>=16 |
No idea |
Total |
| <1 |
279 |
19 |
21 |
12 |
14 |
50 |
4 |
13 |
10 |
5 |
21 |
- |
3 |
1 |
- |
2 |
9 |
1 |
464 |
| 1-<2 |
57 |
25 |
46 |
18 |
5 |
3 |
- |
1 |
- |
1 |
2 |
- |
- |
- |
- |
- |
- |
- |
158 |
| 2-<3 |
43 |
9 |
48 |
111 |
122 |
62 |
19 |
7 |
3 |
1 |
2 |
1 |
1 |
- |
- |
- |
1 |
- |
430 |
| 3-<4 |
51 |
3 |
4 |
43 |
86 |
118 |
65 |
22 |
11 |
2 |
5 |
- |
- |
1 |
1 |
- |
- |
- |
412 |
| 4-<5 |
70 |
1 |
14 |
20 |
98 |
141 |
144 |
82 |
56 |
107 |
18 |
4 |
3 |
- |
5 |
5 |
2 |
- |
770 |
| 5-<6 |
209 |
2 |
13 |
20 |
34 |
290 |
286 |
406 |
235 |
95 |
533 |
17 |
12 |
2 |
7 |
27 |
10 |
- |
2198 |
| 6-<7 |
56 |
1 |
2 |
1 |
8 |
17 |
69 |
181 |
155 |
64 |
55 |
9 |
15 |
3 |
8 |
4 |
1 |
- |
649 |
| 7-<8 |
46 |
- |
- |
1 |
2 |
28 |
9 |
88 |
139 |
115 |
139 |
12 |
25 |
5 |
13 |
7 |
4 |
- |
633 |
| 8-<9 |
42 |
- |
1 |
- |
3 |
6 |
5 |
7 |
34 |
94 |
123 |
22 |
45 |
13 |
11 |
7 |
9 |
1 |
423 |
| 9-<10 |
32 |
1 |
2 |
- |
3 |
2 |
2 |
6 |
7 |
62 |
66 |
40 |
29 |
11 |
47 |
20 |
73 |
- |
403 |
| 10-<11 |
93 |
- |
2 |
- |
- |
40 |
2 |
7 |
9 |
7 |
216 |
34 |
115 |
25 |
31 |
383 |
331 |
3 |
1298 |
| 11-<12 |
4 |
- |
- |
- |
1 |
2 |
2 |
2 |
- |
1 |
- |
17 |
16 |
4 |
5 |
4 |
10 |
1 |
69 |
| 12-<13 |
2 |
1 |
- |
- |
- |
- |
- |
1 |
2 |
- |
2 |
- |
9 |
12 |
8 |
22 |
17 |
1 |
77 |
| 13-<14 |
- |
- |
- |
- |
- |
1 |
- |
- |
- |
3 |
2 |
- |
- |
5 |
7 |
9 |
6 |
- |
33 |
| 14-<15 |
2 |
- |
- |
- |
- |
- |
1 |
4 |
2 |
14 |
- |
- |
- |
- |
7 |
4 |
18 |
2 |
54 |
| 15-<16 |
17 |
- |
- |
- |
- |
6 |
3 |
4 |
- |
2 |
4 |
1 |
- |
- |
- |
33 |
113 |
1 |
184 |
| >=16 |
63 |
1 |
2 |
15 |
13 |
16 |
3 |
1 |
21 |
3 |
6 |
- |
- |
- |
1 |
- |
561 |
3 |
709 |
| Total |
1066 |
63 |
155 |
241 |
389 |
782 |
614 |
832 |
684 |
576 |
1194 |
157 |
273 |
82 |
151 |
527 |
1165 |
13 |
8964 |
|
 IST,
IST,