 IST,
IST,


V Current Account Dynamics (Part 1 of 2)
Introduction
5.1 Large and persistent current account deficits across developed and developing countries alike posed considerable challenges for macroeconomic stability and growth during the 1980s and the 1990s. The two decades, however, present interesting contrasts in the underlying dynamics of the current account outturn. In most developing countries during the 1980s, large and unsustainable fiscal deficits were the key causal factor, spilling over into large current account deficits which were predominantly financed by debt flows. When the current account deficits turned unsustainable, they triggered off debt crises, impaired debt servicing and led to loss of growth. The painful debt reorganisation that followed had pervasive and lasting effects in the form of financial instability. During the 1990s, however, excessive current account deficits were mainly driven by large private sector saving-investment gaps which exploded into contagious currency crises that entailed substantial output and welfare losses, wrecked domestic financial systems and posed the most serious threat to global financial stability in recent decades. These diverse experiences have necessitated a reappraisal of the determinants of the behaviour of the current account and issues relating to its sustainability.
5.2 The Indian experience reveals significant differences from the international developments, especially in the 1990s. In the late 1980s, the unrelenting expansion of the fiscal deficit was reflected in rising external current account deficits, culminating in the balance of payments crisis of 1991, a haemorrhage of international reserves and a situation perilously close to debt default. Nevertheless, a combination of prudent and unorthodox policies for stabilisation and structural change ensured that the crisis did not translate into generalised financial instability. In the 1990s, the lessons drawn from managing the crisis led to external sector policies that emphasised the competitiveness of exports of both goods and services, a realistic and market-based exchange rate regime, external debt consolidation and a policy preference for non-debt creating capital flows. These policies ensured that the current account deficit remained around one per cent of gross domestic product (GDP) and was comfortably financed even as the degree of openness of the economy rose significantly relative to preceding decades and capital
flows began to dominate the balance of payments. In retrospect, the policy choice for non-debt flows turned out to be eminently successful in terms of ensuring a sustainable current account and a reduction of external debt ratio to ‘least indebted’ levels. In contrast to the general developing country experience, there were subtle shifts in external competitiveness which underpinned the low current account deficit in India during the 1990s. Although merchandise exports did not grow as fast as those of other emerging market economies (EMEs) in terms of pace and technological content, a rapid expansion of software and IT exports as well as a prolonged surge in workers’ remittances kept the current account deficit comfortably low, eventually turning it into a surplus in 2001-02 and 2002-03. Furthermore, although fiscal deficits remained inflexible downwards, they did not spill over into the external sector in India during the 1990s, in contrast to several other developing countries. Fiscal deficits were almost entirely financed by domestic saving. There was also a shift in the composition of the fiscal deficit between the late 1980s and the 1990s. In the 1980s, over 70 per cent of Government sector borrowings were undertaken to finance capital expenditures. On the other hand, it was large revenue deficits which dominated the fiscal accounts in the 1990s, constituting more than 54 per cent of the GFD whereas the share of capital expenditure in the GFD declined from around 55 per cent in the early 1990s to around 34 per cent in the late 1990s. The resulting stagnation in public investment, accompanied by the downturn in private investment in the second half of the 1990s dampened the demand for imports and contributed to the favourable current account outcome. Thus, in many significant ways, the underlying dynamics of the current account gap in India provide interesting divergences from the conventional wisdom and the cross-country experience.
5.3 Several key issues emerge from the foregoing with direct relevance for understanding and evaluating the behaviour of the current account in the context of the evolving macroeconomic scenario in India, particularly in the context of a growing degree of outward orientation of the economy. First, do current account deficits matter and if so, what level of current account deficit is sustainable? Second, do higher budget deficits cause current account imbalances, i.e., are they twins or only distant cousins? If the fiscal
accounts are in balance, should a current account deficit caused by a widening private sector saving-investment gap be a matter of policy concern, revisiting the Lawson’s doctrine (1987). Third, are rising shares of services in GDP reflected in international competitiveness? And fourth, what pulls in workers’ remittances - the largest source of foreign exchange after goods and service exports and a stable source of external financing vis-à-vis private capital flows? These questions are addressed in this Chapter by reviewing the available cross-country experience, surveying the literature and conducting empirical tests in the Indian situation. Section I provides analytical underpinnings of the current account in an open economy framework with particular emphasis on current account sustainability under Indian conditions. Section II sets out the static as well as dynamic benefits for current account sustainability arising from trade in services. In view of the preponderant role of workers’ remittances in India’s balance of payments, this Section also undertakes an in-depth examination of these flows, including issues relating to sources, determinants and stability. Section III deals with India-specific issues in the ongoing debate under the General Agreement of Trade in Services (GATS). The Chapter ends with some concluding observations.
5.4 The main conclusion that emerges is consistent with the received wisdom in that excessive current account deficits tend to enhance vulnerability to external shocks and financial instability. In the current international context, movements in national current account balances are increasingly being recognised as manifestations of the global imbalances. The empirical evidence indicates that even current account deficits which appear optimising from an inter-temporal perspective or are on account of private sector imbalances run the risk of sharp reversals. This stresses, therefore, the need to keep current account deficits within sustainable limits – an approach followed by India in its external sector management since the early 1990s. On the other hand, the modest levels of current account deficits in India during the 1990s could be a reflection of stagnation in investment demand in the economy. The negative public sector saving-investment gap in India seems to have been adjusted within the economy without spilling over to the external sector. Reasonably strong evidence on the presence of ‘J-curve’ effects suggests the need for an integrated application of monetary, fiscal and exchange rate policies while targeting the appropriate current account balance for policy purposes. This has significant implications for invisible exports which have played an important role in offsetting structural trade deficits in
India. The high labour-intensity of the principal components - workers’ remittances, software and IT services - indicates that the service intensity of India’s exports is likely to be determined by the orientation of domestic output and employment in favour of these categories of services as well as a higher income elasticity of external demand for services exports vis-à-vis domestic demand for services imports. In the years ahead, these factors need to be explicitly recognised in formulating India’s position in the ongoing debate on the GATS.
I. CURRENT ACCOUNT BALANCE AND
SUSTAINABILITY
Stylised Facts from Cross-Country Experience
5.5 Large current account deficits began to characterise the balance of payments of developing countries during the second half of the 1970s under the impact of oil price shocks. The debt crisis of the early 1980s interrupted this trend. Between 1983 and 1989, current account deficits in developing countries shrank in response to structural adjustment policies as well as a generalised risk aversion to developing country debt which dominated international financial markets. In general, the period from the mid-1980s to mid-1990s was characterised by removal of official restrictions on current transactions as part of the wider market-oriented reforms under taken in these countries. Investor confidence returned to the developing world in the aftermath of the Brady Plan and net capital flows surged to pre-1914 levels by 1996. Sizeable current account deficits began to reappear for a few developing countries in the 1990s. In the 1990s, however, countries running large current account deficits received severe shocks – Mexico in 1994, East Asia in 1997, Brazil in 1998 and Argentina in 2001. Net capital flows to developing countries declined almost continuously after 1997 and it is only in 2003 that a hesitant recovery set in. The adjustment to the severe financial crises produced a dramatic turnaround and current account surpluses were recorded under the impact of import compression and dynamic export efforts, particularly in the crisis-affected economies (Table 5.1).
5.6 An important aspect of the current account dynamics is the degree of trade openness. During the last two decades, the trend towards greater openness of economies is reflected in significant reduction in the mean tariff rates as well as in improvements in the openness indicator, measured as the ratio of exports plus imports to GDP (Table 5.2). Reflecting the global trends, the weighted mean tariff rate for India declined
| Table 5.1: Cross-Country Comparison of Current Account and Fiscal Balances | ||||||||||||
(Per cent to GDP) | ||||||||||||
Country | 1976-80 | 1981-85 | 1986-90 | 1991-95 | 1996-00 | 2001 | 2002 | |||||
1 | 2 | 3 | 4 | 5 | 6 | 7 | 8 | |||||
Argentina | CAD | .. | -2.1 | -1.3 | -2.5 | -3.8 | -1.7 | 9.4 | ||||
GFD | -5.0 | -5.3 | -1.5 | -0.5 | -2.0 | -3.3 | -1.1 | |||||
Brazil | CAD | .. | .. | -0.3 | -0.4 | -4.0 | -4.6 | -1.7 | ||||
GFD | -1.2 | -5.1 | -13.0 | -4.9 | -7.5 | .. | 2.4 | |||||
Chile | CAD | -4.5 | -9.8 | -3.1 | -2.5 | -2.9 | -1.8 | -0.8 | ||||
GFD | -0.1 | -1.3 | 0.9 | 1.9 | 0.6 | .. | .. | |||||
China | CAD | .. | 0.0 | -0.2 | 0.9 | 2.5 | 1.5 | 2.9 | ||||
GFD | -3.5 | -0.4 | -0.8 | -2.4 | -1.9 | -4.4 | -3.0 | |||||
| India | CAD | 0.6 | -1.4 | -2.2 | -1.2 | -1.1 | -0.2 | 1.0 | ||||
| GFD | -5.0 | -6.8 | -8.1 | -5.7 | -5.1 | -6.1 | -5.9 | |||||
Indonesia | CAD | .. | -3.6 | -2.5 | -2.3 | 1.6 | 4.7 | .. | ||||
GFD | -2.9 | -1.7 | -1.7 | 0.7 | -0.7 | -1.2 | .. | |||||
Korea | CAD | -3.6 | -2.8 | 4.3 | -1.3 | 3.1 | 1.9 | 1.3 | ||||
GFD | -1.7 | -1.9 | 0.3 | -0.2 | -0.6 | .. | .. | |||||
Malaysia | CAD | 2.6 | -8.3 | 2.4 | -6.5 | 5.6 | 8.3 | .. | ||||
GFD | -6.0 | -10.8 | -5.6 | 0.1 | -0.4 | .. | .. | |||||
Mexico | CAD | -4.7 | -0.6 | -1.0 | -5.2 | -2.5 | -2.9 | -2.2 | ||||
GFD | -3.0 | -8.3 | -8.9 | 2.5 | -1.1 | -0.7 | -1.8 | |||||
Philippines | CAD | -4.8 | -5.4 | -1.7 | -3.4 | 2.8 | 1.8 | 5.4 | ||||
GFD | -1.3 | -2.9 | -3.2 | -0.6 | -1.2 | -4.0 | -5.2 | |||||
Thailand | CAD | -5.4 | -5.3 | -3.0 | -6.4 | 4.1 | 5.4 | 6.0 | ||||
GFD | -3.3 | -3.4 | 1.4 | 2.9 | -1.5 | -2.4 | -1.4 | |||||
Turkey | CAD | .. | .. | -0.01 | -0.7 | -1.5 | 2.3 | -1.0 | ||||
GFD | .. | .. | -3.2 | -4.9 | -9.9 | -19.6 | .. | |||||
UK | CAD | 0.2 | 1.3 | -3.1 | -1.6 | -1.2 | -1.3 | -0.9 | ||||
GFD | -4.9 | -3.7 | -1.2 | -4.7 | -1.0 | 0.9 | -1.3 | |||||
USA | CAD | -0.2 | -1.4 | -2.4 | -1.0 | -2.5 | -3.9 | -4.6 | ||||
GFD | -2.2 | -4.5 | -3.6 | -3.5 | 0.7 | 0.9 | -2.2 | |||||
(+) | : Surplus | (-) | : | Deficit | .. | Not Available. | ||||||
| Note | : CAD : Current Account Balance to GDP ratio. | GFD : Gross Fiscal Balance to GDP ratio. | ||||||||||
| Source | : International Financial Statistics, IMF. | |||||||||||
from 79.0 per cent in 1990 to 30.9 per cent in 2001 while trade openness improved from 14.9 per cent to 19.7 per cent between 1992 and 2001. Cross-country evidence suggests that higher trade openness is generally associated with export-oriented economies (See Chapter IV). The East Asian experience is an archetypal case in point. As the events of the late 1990s unfolded, it also became clear, however, that a high degree of trade openness implies that external developments are quickly transmitted to the domestic economy and vice versa.
Exchange Rates and the Current Account
5.7 The exchange rate is widely accepted as a key determinant of the current account balance. Belonging to the rich tradition of the elasticities approach in the theory of balance of payments, movements in the exchange rate impact on relative prices and ‘switch’ resources/consumption
| Table 5.2: Indicators of Trade Openness of | |||||
| Select Countries | |||||
| (Per cent) | |||||
| Mean Tariff Rates | Trade/GDP | ||||
| Country | 1992 | 2001 | 1992 | 2001 | |
| 1 | 2 | 3 | 4 | 5 | |
| Argentina | 12.2 | 11.6 | 11.4 | 17.4 | |
| Brazil | 42.2 | 12.9 | 19.6 | 27.8 | |
| Chile | 11.0 | 8.0 | 43.4 | 53.1 | |
| China | 41.2 | 15.3 | 28.5 | 43.3 | |
| India | 79.0 | * | 30.9 | 14.9 | 19.7 |
| Indonesia | 22.0 | # | 8.4 | 43.5 | 61.8 |
| Japan | 6.0 | + | 5.1 | 14.2 | 18.0 |
| Mexico | 13.4 | 16.2 | 32.3 | 53.6 | |
| Philippines | 28.0 | + | 7.0 | 45.9 | 94.5 |
| Sri Lanka | 28.3 | * | 9.8 | 54.8 | 73.0 |
| Thailand | 38.5 | # | 17.0 | 61.3 | 105.5 |
| USA | 5.6 | # | 4.0 | 15.5 | 18.2 |
| * Refers to 1990 | # | Refers to 1989 | + Refers to 1988 | ||
| Source: | International | Financial Statistics, IMF | and World | ||
| Development Indicators, World Bank. | |||||
expenditures between the production and consumption of tradables (exports/imports of goods and services) and non-tradables. Thus, when the exchange rate is adjusted downwards, prices of exports of goods and services fall in foreign currency terms and induce an increase in foreign demand. Imports become costlier in domestic currency terms and this dampens domestic demand. These effects, in turn, bring about changes in the current account balance. From a policy perspective, the desired effects of exchange rate changes on the current account depend upon the Marshall-Lerner axiom –the sum of the price elasticities of foreign demand for exports and the domestic demand for imports should exceed one. The salutary effects of a change in the exchange rate on the current account depends critically on the extent to which the exchange rate adjustment is transmitted to foreign currency export prices and import prices in domestic currency, i.e., the degree of pass-through (a useful survey of studies on exchange rate pass-through as well as empirical estimates for India are given in Patra and Pattanaik, 1994; Ranjan, 1995; see also Chapter IV).
Moreover, the impact of exchange rates on the current account is lagged, formalised in the literature as the J-curve effect (Box V.1). An exchange rate depreciation initially worsens the current account but improvement sets in over time. On the other hand, if there is a currency appreciation, there may be an inverted J-curve. The period of transmission could be characterised by compensating variations in domestic prices which may nullify the desired effect of the exchange rate change. Indeed, empirical evidence points to a succession of J-curves such that the losses of the initial exchange rate action are never recouped.
5.8 In the Indian context, studies have found that the trade balance of India is sensitive to exchange rate changes (Patra and Pattanaik, 1994; Singh, 2002), indicating a significant role for monetary and fiscal policies in conjunction with the exchange rate in influencing the behaviour of the current account. An empirical exercise undertaken for India within the framework of a bi-variate vector auto-regression model indicates bi-directional causality between the current account deficit and the exchange rate.1
Box V.1
J- and S- Curve Effect: Theory and Evidence
The J-curve hypothesis generated a series of empirical research that investigated the existence of J-curve both in the US and other countries data. The evidence on J-curve is mixed. Earlier studies like Krugman and Baldwin (1987) found evidence of a J-curve in the US data. However, Rose and Yellen (1989) and Rose (1990 and 1991) not only reject the J-curve hypothesis but also argue that there is no significant effect of the real exchange rate on the trade balance for both the developing and the developed countries, including the US. A more recent study on US data by Bahmani-Oskoee and Brooks (1999) found that in the short run there is no effect of real exchange rate on the trade balance, but in the long-run the real depreciation of the US dollar is found to have a favourable effect. Kulkarni and Bhatia (2002) empirically show the existence of the J-curve phenomena in six countries including the inverted J-curve in the case of Japan with an appreciating yen.
Recent research using dynamic general equilibrium models has found that the trade balance is negatively correlated with current and future movements in the terms of trade (measured by the real exchange rate), but positively correlated with past movements (Backus et al., 1994). This is called the S-curve because of the asymmetric shape of the cross-correlation function for the trade balance and the real exchange rate. Backus et al. (1994) developed an international real business cycle model and found that the trade balance is counter-cyclical and the cross-correlation function of the trade balance and the terms of trade displays an S-shape. Marwah and Klein (1996) while estimating trade balance equations for the US and Canada found that, after a depreciation, there is a tendency for trade balances to worsen first and then to improve. After several quarters, there appears to be a tendency to worsen again, which produces an S-pattern that was suggested by Backus et al. (1994).
| 1 | Granger Causality between Exchange Rate and Current Account Deficit in India : 1951-2002 | |||
| Null Hypothesis | LR Test: Chi - square statistic | Result | ||
| (level of significance) | ||||
| 1 | 2 | 3 | ||
| Changes in nominal exchange rate (DEXCHRATE) do not Granger cause the CAD/GDP ratio | 6.41 (0.04) | Reject Null | ||
| CAD/GDP ratio does not Granger cause the changes in nominal exchange rate (DEXCHRATE) | 8.02(0.02) | Reject Null | ||
| Changes in real exchange rate do not Granger cause the CAD/GDP ratio | 3.98 (0.05) | Reject Null | ||
| CAD/GDP ratio does not Granger cause the changes in real exchange rate | 7.75(0.005) | Reject Null | ||
| LR : Likelihood Ratio | ||||
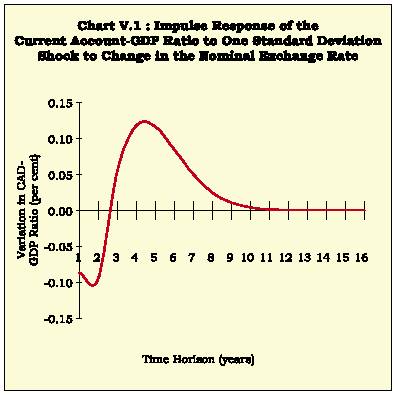
5.9 The impulse response of the current account deficit-GDP ratio to a nominal exchange rate shock shows the expected ‘J’ curve response over a short to medium term time horizon, i.e., up to five years. Thereafter, the response function shows a downward slope, characteristic of the ‘S’ curve effect. This suggests that demand effects resulting from the nominal exchange rate change are transitory and cannot persist over a long period (Chart V.1).
Fiscal Deficits and the Current Account
5.10 Over the 1980s and 1990s, the role of fiscal deficits in the evolution of the current account has dominated the policy debate on sustainability. Indeed, unviable fiscal deficits have been the usual suspects in IMF programs for developing countries seeking recourse to it under balance of payments difficulties, whether in the standard absorption approach type demand management programs or the supply-side approach of the 1980s. In this tradition, it is axiomatic under the national accounting identity that if the private sector is in balance, the government deficit will be fully reflected in the current account deficit.2 The concomitant increase in debt creating flows has implications for future debt servicing and solvency. A contrarian view in the face of this orthodoxy takes the form of the new classical resurrection of the Ricardian equivalence hypothesis. Movements in the fiscal deficit lead to offsetting changes in households’ saving behaviour. Future taxes to cover present-day fiscal
deficits are fully anticipated through an equivalent increase in private saving and, therefore, there is no spillover of the fiscal deficit into the current account of the balance of payments. Empirical evidence in support of the Ricardian equivalence is weak and in the real world, therefore, the fiscal roots of the current account are widely recognised. Relatively stronger links between the current account and the fiscal balance are observed in underdeveloped financial systems where liquidity constraints are likely to be more binding (Milesi-Ferretti and Razin, 1996), and where macroeconomic policies rely predominantly on fiscal deficits for the acceleration of capital accumulation and growth.
5.11 Stylised evidence on the relationship between the fiscal deficit and the current account deficit in EMEs and industrial countries is somewhat ambiguous. For example, widening fiscal deficits in Brazil (7.5 per cent of GDP in the latter half of the 1990s) were associated with significantly high current account deficits (averaging 4.0 per cent of GDP). In the US, large fiscal deficits were accompanied by high current account deficits during the 1980s (Table 5.1). Similar co-movement was recorded in Malaysia and Thailand in the early 1980s. On the other hand, the deterioration in the current account deficit and consequent crises in UK (late 1980s) and in East Asia (1997) were not associated with widening fiscal imbalances.
5.12 The mixed cross-country experience is borne out by tests of Granger causality between fiscal deficit to GDP ratio and current account deficit to GDP ratio undertaken for a sample of 14 developing and industrial countries (Table 5.3). For most developing countries such as China, India, Indonesia, Malaysia, Mexico and Thailand, fiscal deficits Granger cause current account deficits. On the other hand, the results for countries such as Korea, UK and USA reveal causality running from current account deficits to fiscal deficits. In the case of Argentina and Chile, a significant bi-directional causality is observed, suggesting a self-reinforcing vicious circle.
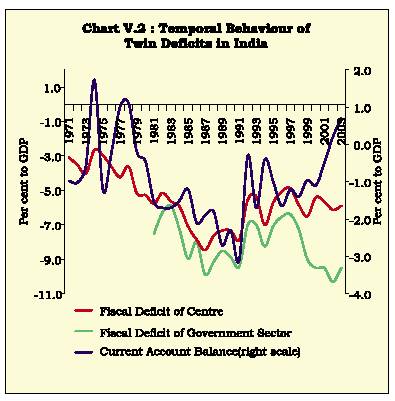
5.13 As noted earlier, the deterioration of the fiscal deficit-GDP ratio in India was reflected in widening of the current account deficit during the 1980s (Chart V.2). In 1990-91, the current account deficit at 3.1 per cent of GDP turned unsustainable, leading to an unprecedented external payments crisis. In retrospect, it was the swift and massive macroeconomic stabilisation programme which prevented the balance of payments crisis from turning into financial instability.
| Table 5.3: Causality Between Current Account | |||||
| Balance and Fiscal Deficit: Cross-Country Evidence | |||||
| Sample: 1971-2001 | |||||
| Country | Null Hypothesis | F-Statistic | Probability | Lag | |
| 1 | 2 | 3 | 4 | 5 | |
| Argentina | A | 3.31027 | 0.08761 | 1 | |
| B | 7.03976 | 0.01735 | |||
| Chile | A | 13.0573 | 0.00154 | 1 | |
| B | 13.7626 | 0.00122 | |||
| China | A | 4.11967 | 0.05834 | 1 | |
| B | 2.42527 | 0.13781 | |||
| Germany | A | 1.26028 | 0.30416 | 2 | |
| B | 3.12585 | 0.06481 | |||
| India | A | 12.5321 | 0.00153 | 1 | |
| B | 0.00224 | 0.96259 | |||
| Indonesia | A | 11.1951 | 0.0018 | 2 | |
| B | 0.42945 | 0.66049 | |||
| Korea | A | 1.98268 | 0.17615 | 1 | |
| B | 7.23427 | 0.01498 | |||
| Malaysia | A | 4.11831 | 0.05747 | 1 | |
| B | 0.83301 | 0.37347 | |||
| Mexico | A | 7.48098 | 0.01315 | 1 | |
| B | 0.20264 | 0.65769 | |||
| Philippines | A | 0.25602 | 0.6179 | 1 | |
| B | 1.86254 | 0.18613 | |||
| Thailand | A | 7.45608 | 0.01166 | 1 | |
| B | 2.47309 | 0.1289 | |||
| Turkey | A | 2.26422 | 0.14729 | 1 | |
| B | 4.15526 | 0.05429 | |||
| UK | A | 2.04733 | 0.14131 | 3 | |
| B | 4.00364 | 0.02293 | |||
| USA | A | 0.14993 | 0.86153 | 2 | |
| B | 4.44409 | 0.02232 | |||
| Note : | A = | GFD does not Granger Cause CAD | |||
| B = | CAD does not Granger Cause GFD | ||||
5.14 Since the mid-1990s, the relationship between the fiscal deficit and the current account in India seems to have blurred. Higher fiscal deficits have been accompanied by a narrowing of the current account deficit, implying that a major part of the fiscal deficit has been absorbed by a surplus in domestic saving of the private sector. A significant decline in the correlation coefficient during 1990-91 to 2002-03 corroborates this weakening co-movement (Table 5.4).
| Table 5.4: Correlation Between Fiscal Deficit and | |
| Current Account Deficit in India | |
| Period | Correlation Coefficient |
| 1 | 2 |
| 1970-71 to 1980-81 | 0.10 |
| 1980-81 to 1989-90 | 0.43 |
| 1990-91 to 2002-03 | 0.24 |
| 1970-71 to 2002-03 | 0.60 |
5.15 The weakening of the link between fiscal and current account deficits during the second half of 1990s could be attributed to the changing composition of the fiscal deficit. In the 1980s, the high fiscal deficits were mainly due to high investment spending while in the 1990s fiscal deficits mainly reflected the expansion in revenue deficits (Table 5.5). Lower public investment could have had a dampening effect on private investment, thereby constraining the overall investment demand in the economy. This explains the absence of twin deficits during the 1990s.
| Table 5.5: Composition of Gross Fiscal Deficit of | |||
| Central and State Governments in India | |||
| (Per cent) | |||
| Fiscal | Gross Fiscal | Composition of Fiscal Deficit | |
| Year | Deficit-GDP | (Percentage Share) | |
| Revenue Deficit | Capital Expenditure | ||
| 1 | 2 | 3 | 4 |
| 1980-81 | 7.5 | 5.1 | 94.9 |
| 1985-86 | 8.0 | 23.6 | 76.4 |
| 1990-91 | 9.4 | 44.6 | 55.4 |
| 1995-96 | 6.5 | 48.8 | 51.2 |
| 1999-00 | 9.5 | 65.7 | 34.3 |
| 2002-03 | 10.1 | 66.7 | 33.3 |
Current Account and the Saving-Investment Balance
5.16 By the standard national accounting identity, current account is the mirror image of the domestic saving-investment balance. Accordingly, developing countries strive to finance the predominant portion of domestic investment with domestic saving in order to economise on the reliance on foreign saving and
thereby ensure current account sustainability. The massive cross-border movements of capital since the 1970s and widespread liberalisation in many developing economies in order to harness foreign capital for growth have subjected this identity to closer scrutiny. In a period of perfect capital mobility, it is argued that investment need not be constrained by availability of domestic savings, and that domestic savings and investment could have a low correlation (Box V.2). Correlation between domestic saving and investment may indicate the prevalent degree of capital mobility (Feldstein and Horioka, 1980).
5.17 Further analytical insights into the saving-investment and current account balance relationship in India can be obtained from components of saving and investment. First, a negative but low saving-investment gap during the period 1995-96 to 2001-02 was due to stagnation in the rate of investment (Table 5.6). Second, in the public sector, investment has remained above saving leading to a negative and
stable saving-investment gap since the 1980s. While there was a sharp decline in the public saving rate, the investment rate also shrank with adverse implications for the overall rate of investment in the economy. This also reflects the rising share of current consumption and consequent crowding out of investment outlays of the Government. Third, the private investment rate has remained relatively stagnant since the second half of the 1990s, whereas the private saving rate improved significantly. The rise in private saving has sustained the overall saving rate in the economy, compensating for the decline in public sector saving and the deterioration in the efficiency of capital use. The spillover of the private sector saving investment surplus is being reflected in the modest surplus in the current account in the recent period.
5.18 A high saving rate, given a current account deficit, is an indicator of inter-temporal solvency of a country because it implies higher investment and debt servicing capacity. A key issue regarding the level of
Box V.2
The Feldstein-Horioka Puzzle
Testing the Feldstein-Horioka (FH) hypothesis involves finding correlation between savings and investment as an indicator to measure the degree of capital mobility. The long-term relationship between savings and investment provides a reflection of the future sustainability of the current account deficit. Empirical estimates show that in Argentina, Chile, Honduras, Venezuela, Guatemala, Peru, Algeria, China, Indonesia, Thailand and Turkey, high saving-investment correlations were associated with a stationary current account (Schneider, 1999). On the other hand, a low saving-investment correlation and current account non-stationarity were observed in Mexico, India, South Korea, Brazil, Egypt, Uganda, Madagascar, Cote de Ivory, Mauritania, Haiti and Trinidad and Tobago. A low saving-investment correlation with a non-stationary current account indicates a greater degree of capital mobility.
Several studies found that inclusion of developing countries in the cross-section analysis reduced the strength of saving-investment correlation (Dooley et al., 1986; Summers, 1988). Developing countries recorded lower saving-investment coefficients as compared with the industrialised countries (Wong, 1990; Montiel, 1993; Schneider, 1999). It is further estimated that the long run current account deficit of a developing country is expected to be 0.22 per cent higher than the average if its long run savings rate is one per cent higher than the average (Ventura, 2002).
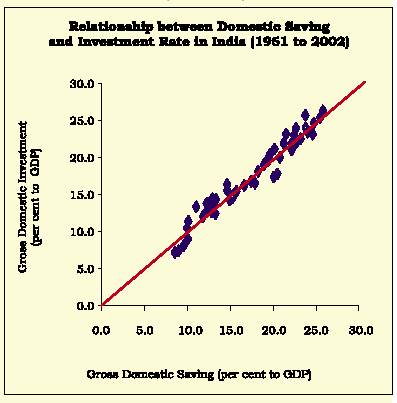
In the Indian context, studies have provided conflicting results, i.e., very high saving-investment correlation coefficients indicating capital immobility on the one hand, and a low saving-investment correlation in 1970-97 as also a non-stationary current account, on the other. Unit root tests for the current account balances for India for the period 1950-51 to 2001-02 indicate that the current account deficits are stationary. Stationarity of the current account is further reinforced by high correlation (r = 0.82) between savings
and investment. In the recent period, this co-movement has further strengthened. The long run current account deficit is estimated to be higher by 0.16 per cent in response to one per cent change in long run saving rate. This implies that changes in domestic savings induce a more or less equivalent change in investment. The coordinates of savings and investment for the period 1950-51 to 2001-02 also reveal that these two variables have moved in close tandem during the entire period (Chart). Thus, the lower current account deficits during the 1990s are perhaps a reflection of high correlation between changes in saving and investment rates.
| Table 5.6: Saving-Investment Gap of Private and Public Sectors in India | |||||||||
| (Per cent to GDP) | |||||||||
| Period | Private Sector | Public Sector | Overall | ||||||
| S | I | S-I | S | I | S-I | S | I* | S-I | |
| 1 | 2 | 3 | 4 | 5 | 6 | 7 | 8 | 9 | 10 |
| 1970-71 to 74-75 | 12.4 | 9.7 | 2.7 | 3.0 | 7.1 | -4.1 | 15.4 | 16.2 | -0.8 |
| 1975-76 to 79-80 | 15.2 | 10.5 | 4.7 | 4.5 | 9.3 | -4.8 | 19.6 | 19.1 | 0.5 |
| 1980-81 to 84-85 | 14.7 | 10.9 | 3.8 | 3.7 | 9.9 | -6.2 | 18.4 | 19.8 | -1.4 |
| 1985-86 to 89-90 | 18.0 | 13.2 | 4.8 | 2.4 | 10.1 | -7.7 | 20.4 | 22.7 | -2.3 |
| 1990-91 to 94-95 | 21.5 | 14.2 | 7.3 | 1.4 | 8.7 | -7.3 | 22.9 | 24.3 | -1.5 |
| 1995-96 to 99-00 | 22.8 | 16.2 | 6.6 | 0.6 | 7.0 | -6.4 | 23.4 | 24.8 | -1.3 |
| 2000-01 to 01-02 | 26.1 | 16.1 | 9.9 | -2.4 | 6.3 | -8.7 | 23.7 | 23.9 | -0.2 |
| S = Gross Domestic Saving, I = Gross Capital Formation, S-I = Saving-Investment Gap. * : Relates to Gross Domestic Capital Formation. | |||||||||
| Source : Central Statistical Organisation. | |||||||||
current account deficit to be incurred by a growing economy is the absorptive capacity of the economy. Moreover, a necessary condition for sustained capital inflows is that the rate of return on investment must be greater than the cost of external borrowings. Infrastructure and human capital formation raise the absorptive capacity of a country to sustain higher current account deficits and the resultant capital inflows (World Bank, 2001). In India, CADs have generally been modest except in the mid-1950s, the 1960s and the 1980s (Table 5.7). The decline in the CAD/GDP ratio during the 1990s is seen as reflective of the limited absorptive capacity and infrastructural and other bottlenecks in the economy that hamper higher levels of investment. It needs to be noted that although the investment rate did improve in the 1990s indicating an expansion in absorptive capacity, a rise in the domestic saving rate appears to have economised on the reliance on foreign saving.
Inter-Temporal Approach to the Current Account
5.19 The current account deficits/surpluses being mirror images of saving and investment decisions of public and private sectors, the analysis of saving-investment relationship over time provides insights into the behaviour of the current account. In an open economy framework, the inter-temporal approach to the current account provides a valuable framework to assess the appropriate (i.e., threshold) level of the current account balance for a particular country. According to this approach, current account balances (surplus/deficit) reflect consumption smoothing, emanating from the forward-looking saving and investment decisions of economic agents (Box V.3).
5.20 The crises of the 1980s and the 1990s suggest that some important policy implications of the inter-temporal approach to the current account are flawed (Edwards, 2001). The recent experience indicates that
| Table 5.7: Savings and Investment Rates and Current Account Deficits in India | ||||
| (Per cent to GDP) | ||||
| Period | Domestic Savings Rate | Investment Rate | ICOR* | Current Account Deficit |
| 1 | 2 | 3 | 4 | 5 |
| 1950-51 to 54-55 | 8.8 | 9.0 | 2.2 | 0.0 |
| 1955-56 to 59-60 | 11.2 | 13.3 | -4.5 | -1.8 |
| 1960-61 to 64-65 | 12.0 | 14.3 | -9.7 | -1.8 |
| 1965-66 to 69-70 | 13.3 | 15.1 | -12.7 | -1.7 |
| 1970-71 to 74-75 | 15.4 | 16.2 | -2.9 | -0.4 |
| 1975-76 to 79-80 | 19.6 | 19.1 | 3.4 | 0.2 |
| 1980-81 to 84-85 | 18.4 | 19.8 | 4.5 | -1.5 |
| 1985-86 to 89-90 | 20.4 | 22.7 | 5.5 | -2.2 |
| 1990-91 to 94-95 | 22.9 | 24.3 | 6.2 | -1.3 |
| 1995-96 to 2001-02 | 23.5 | 24.5 | 5.0 | -0.9 |
| * Incremental Capital-Output Ratio (ICOR) denotes the underlying trend derived using the Hodrick-Prescott Filter. | ||||
| Source : Central Statistical Organisation. | ||||
Box V.3
Inter-Temporal Consumption Optimisation Approach to Current Account
The inter-temporal approach to the current account is based on the familiar permanent income hypothesis, which predicts that when current income falls below the permanent income level, the level of saving would fall in order to maintain the level of consumption and vice versa. This hypothesis when extended to an open economy translates into borrowing and lending from the international markets to smoothen out consumption in the event of fluctuation in current income. Accordingly, in an open economy, inter-temporal consumption optimisation could be used to predict the level of desired capital flows. A country would run into current account deficit if the national cash flow, defined as output less investment and government spending, is expected to rise over time and vice versa. If the saving and investment decisions of the private sector are optimal, the current account is also optimal, irrespective of whether it is in deficit, surplus or balance. Imperfections in international capital markets could, however, result in unsustainable current accounts
even if it is the outcome of economic agents optimising their inter-temporal consumption paths.
A number of studies have provided evidence validating the inter-temporal model in several countries (Ghosh and Ostry, 1995; Agenor et al., 1999; Kim et al., 2002). An inter-temporal model for the period 1951 to 2002 is estimated for India using the saving-investment gap as a proxy for the current account in view of limitations in the data on private consumption. The results indicate that the simple inter-temporal consumption optimisation model is able to explain the direction and turning point of the consumption-smoothing component of the current account balance fairly well. The correlation coefficient between the optimal and actual current account balance is close to one. Thus, fluctuations in the current account balance in India are the outcome of residents trying to smoothen their consumption paths when the national cash flow fluctuates. The result is noteworthy, given the restrictions on capital flows and the intermittent external shocks experienced.
current account deficits need not be regarded as benign even if generated by the private sector. This raises question about the celebrated Lawson’s Doctrine which holds that if the fiscal accounts are in balance, a high current account deficit driven by a private sector imbalance is not an issue of policy concern. The more recent period has seen a sharp turnaround in EMEs current account balances from large deficits to surpluses. In the Asian region, current account surpluses and high official foreign exchange reserves are recognised as manifestations of the global imbalance, especially the US twin deficits. As stronger recovery takes root across the globe, these countries would have to confront again with the challenge of the early 1990s, i.e., whether global savings are adequate to meet the investment demand of emerging markets and what order of imbalance could be considered as
appropriate from the stand point of ensuring global monetary and financial stability (Mohan, 2003). Ultimately, sustainability of the current account deficit depends upon foreign investors’ confidence in the domestic economy. As the recent crises showed, investors’ assessment can change suddenly and capital flows can dry up due to herd behaviour.
Operational Issues in Current Account Sustainability
5.21 In an open economy framework, where dynamic linkages of domestic financial and real sectors with the external sector become more vivid, the issue of maintaining the current account deficit at sustainable levels becomes crucial. There are various approaches to assess the sustainability of current account position in terms of its size, composition and financing (Box V.4).
Box V.4
Operational Concepts of Current Account Sustainability
Determination of sustainability of the current account is not amenable to simple rules. Nevertheless, a number of criteria have emerged to assess sustainability. A current account deficit can be sustained as long as the growth rate of national income exceeds the rate of interest on the nation’s liabilities even if the debt-GDP ratio rises over time. It is argued, however, that a non-increasing foreign debt-GDP ratio is a practical sufficient condition for sustainability. From an operational point of view, the current account deficit can be assumed to be sustainable as long as no exchange rate or external debt crises occur. Three situations can be
visualised under which the current account is likely to be unsustainable: (i) current account imbalance is large relative to GDP; (ii) the imbalance is caused by a reduction in the domestic saving rate rather than a rise in the investment rate; and (iii) domestic saving rates are low.
The concept of sustainability is somewhat difficult to operationalise and is therefore gauged, in practice, by examining a set of indicators that reflects the soundness of the external sector of the country and the perception of risks. These indicators can be excessive fiscal deficits, credit growth and various reserve adequacy measures.
Does Size of the Current Account Matter?
5.22 The level of the current account deficits is typically focussed upon in the context of assessing sustainability. Large current account deficits are likely to be unsustainable irrespective of origin, whether in the public sector or private sector (Loser and Williams, 1997). The Chilean crisis in the early 1980s was associated with a CAD/GDP ratio exceeding 14 per cent. The Mexican crisis of 1994 and the East Asian crisis of 1997 have reinforced the view that the size of the current account deficits does matter. While it is argued that a CAD/GDP ratio above 5 per cent is a cause of alarm (Summers, 1996), there is also the view that this is a cause for concern if the deficit is financed by short-term debt (Milesi-Ferreti and Razin, 1996). A large CAD emanating from high investment growth may not be particularly inimical to growth (Bruno, 1995); another view, however, is that any CAD above a threshold level is an early warning of impending crisis. It is also argued that the current account deficit alone is neither a necessary nor a sufficient condition to define solvency. The solvency ratio for a country depends, inter alia, on the stability and outlook for current receipts (Reddy, 1999). In an inter-temporal framework, short-run sustainable CADs for most developing countries are estimated at 3 to 5 per cent of GDP (Goldman Sachs, 1997). For most countries, the steady state (long-run) sustainable CAD/GDP ratio is estimated at below 4 per cent of GDP. The actual outturn during 2001 reveals that out of 25 sample developing countries, most countries recorded CAD-GDP within the long run sustainable levels (Table 5.8).
5.23 The record of the current account deficit of India, when benchmarked against these findings, shows that it remained well below the critical limit during the period 1970-71 to 2002-03, ranging from a surplus of 0.2 per cent in the period 1976-80 to a deficit of 2.2 per cent in the period 1986-90. Operational indicators of current account sustainability for India indicate a steady improvement since the 1990s except for the ratio of fiscal deficit to GDP (Table 5.9).
Does Composition Matter for Current Account Sustainability?
5.24 Beyond the size, the composition of the current account and its financing can be an important criterion in determining its sustainability. Capital flows with higher foreign direct investment (FDI) content can ensure sustainability even if the CAD/GDP ratio is
| Table 5.8: Sustainable Current Account Deficit: | ||||
| Cross-Country Evidence | ||||
| (Per cent of GDP) | ||||
| Country | Actual Current | Short-run | Steady State | |
| Account Deficit | Sustainable | (Long-run) | ||
| 1997 | 2001 | Current | Sustainable | |
| Account | Current | |||
| Deficit | Account | |||
| Deficit | ||||
| 1 | 2 | 3 | 4 | 5 |
| Argentina | -4.2 | -1.7 | -3.9 | -2.9 |
| Brazil | -3.8 | -4.6 | -2.9 | -1.9 |
| Bulgaria | 4.1 | -6.2 | -0.4 | -2.4 |
| Chile | -4.4 | -1.8 | -4.2 | -2.9 |
| China | 4.1 | 1.5 | -12.9 | -11.1 |
| Colombia | -5.4 | -1.5 | -2.6 | -1.9 |
| Czech Republic | -6.8 | -4.6 | -2.1 | -1.3 |
| Ecuador | -2.3 | -4.7 | 0.5 | -1.3 |
| Hungary | -2.1 | -2.1 | -0.8 | -1.3 |
| India | -0.7 | 0.2 | -3.8 | -2.8 |
| Indonesia | -2.3 | 4.7 | -4.0 | -3.4 |
| Korea | -1.7 | 1.9 | -4.9 | -3.6 |
| Malaysia | -5.9 | 8.3 | -4.9 | -3.4 |
| Mexico | -1.9 | -2.9 | -2.1 | -1.9 |
| Morocco | -0.5 | 4.7 | -0.3 | -1.3 |
| Panama | -5.3 | -4.5 | -0.8 | -1.9 |
| Peru | -5.8 | -2.0 | -3.3 | -2.9 |
| Philippines | -5.3 | 1.8 | -4.5 | -3.8 |
| Poland | -4.0 | -2.9 | -4.7 | -3.6 |
| Romania | -6.1 | -5.5 | -2.3 | -1.9 |
| Russia | 0.0 | 11.3 | -2.5 | -1.9 |
| South Africa | -1.5 | -0.3 | -3.0 | -1.9 |
| Thailand | -2.0 | 5.4 | -6.0 | -4.5 |
| Turkey | -1.4 | 2.3 | -2.1 | -1.9 |
| Venezuela | 3.9 | 3.1 | -2.2 | -1.9 |
| Source: Goldman Sachs, 1997; International Financial Statistics, IMF. | ||||
relatively high. For instance, Singapore, on an average, sustained a CAD of 12 per cent of GDP during the period 1970-1982, with nearly one half of the capital inflows comprising FDI. Real GDP grew at about 8-9 per cent and subsequently the domestic savings rate accelerated to about 40 per cent in 1982. It is argued that higher FDI inflows created positive externalities by augmenting the production function of the host country (Borensztein, et al., 1995). Furthermore, it is also contended that while FDI raises the domestic investment rate, the positive direct and indirect effects of FDI on domestic savings in reality lead to an improvement in the CAD in the long-run. Australia and New Zealand are more recent examples in this genre.
| Table 5.9: Indicators of Current Account Sustainability for India | ||||||||
| (Per cent) | ||||||||
| Indicator | 1971-75 | 1976-80 | 1981-85 | 1986-90 | 1991-95 | 1996-00 | 2001-03 | |
| 1 | 2 | 3 | 4 | 5 | 6 | 7 | 8 | |
| Trade Deficit/ Gross Domestic Product | -0.9 | -1.4 | -2.5 | -2.1 | -1.2 | -2.5 | -2.2 | |
| Current Account Deficit/Gross Domestic Product | -0.4 | 0.2 | -1.5 | -2.2 | -1.3 | -1.3 | 0.2 | |
| Gross Fiscal Deficit/Gross Domestic Product | -3.3 | -5.0 | -6.8 | -8.1 | -5.7 | -5.1 | -5.9 | |
| Private Sector: SI Gap | 2.7 | 4.7 | 3.8 | 4.8 | 7.3 | 6.6 | 9.9 | |
| External Debt/Gross Domestic Product | 15.3* | 12.8* | 13.2* | 15.8* | 33.9 | 24.3 | 21.2 | |
| Short-term Debt/Total Debt | .. | .. | .. | 10.0 | 6.7 | 5.3 | 3.6 | |
| Non-Debt Capital Flows/Total Capital Flows | .. | .. | .. | 6.0 | 27.1 | 49.3 | 94.8 | |
| Debt Servicing | .. | .. | .. | 30.2 | 28.9 | 19.7 | 15.3 | |
| Changes in Real Effective Exchange Rate | .. | -2.1 | 0.8 | -4.9 | -2.9 | -0.8 | 4.8 | |
| Import Cover (Months) | 4.3 | 7.4 | 4.2 | 3.3 | 5.9 | 7.2 | 11.2 | |
| * Comprising of external assistance, commercial borrowings and IMF loans only. Thus, the external debt-GDP ratio for these periods | is not | |||||||
| comparable with the subsequent period. | ||||||||
| SI Gap : Saving Investment Gap | .. | Not Available | ||||||
| Source : Reserve Bank of India. | ||||||||
5.25 A current account imbalance caused by widening trade deficits is deemed to be less sustainable and may indicate structural competitiveness problems (Roubine and Wachtel, 1997). These structural constraints may be reflected in lower exports-GDP ratios and higher imports as domestically produced goods may not be able to compete with imported goods within the domestic market. Among a sample of 15 countries, it is found that countries such as Argentina, Chile, Indonesia and Malaysia generally witnessed significant trade surpluses during the last two decades mainly due to an export led growth strategy (Table 5.10). On the other hand, India and US recorded trade account deficits consistently.
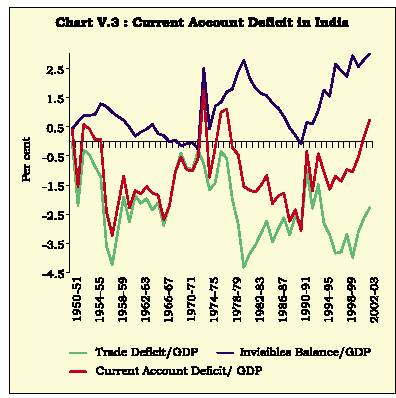
5.26 From the viewpoint of assessing current account sustainability in India, examination of the sources of current account deficits/surpluses assumes significance. The history of the current account in India follows distinct phases: (i) late 1950s to early 1960s when the current account deficit simply mirrored the deficits in merchandise trade; (ii) mid-1970s till early 1980s when the trade deficit was moderated to a significant extent by surpluses in the invisible account; (iii) second half of the 1980s when a distinct decline in support from invisible surpluses turned out to be a key factor in precipitating the crisis of 1990-91; and (iv) the post 1990-91 period when resumption of growth in net invisible earnings underpinned the favourable movements in India’s current account balance (Chart V.3).
| Table 5.10: Cross-Country Comparison of Trade Balance | ||||||||||
| (Per cent to GDP) | ||||||||||
| Country | 1980s | 1990-94 | 1995 | 1996 | 1997 | 1998 | 1999 | 2000 | 2001 | 2002 |
| (Average) | (Average) | |||||||||
| 1 | 2 | 3 | 4 | 5 | 6 | 7 | 8 | 9 | 10 | 11 |
| Argentina | 1.2 | 1.0 | 0.9 | 0.6 | -0.7 | -1.0 | -0.3 | 0.9 | 2.7 | 16.9 |
| Chile | 3.0 | 1.8 | 1.9 | -1.4 | -1.7 | -2.6 | 3.3 | 2.8 | 3.0 | 3.8 |
| China Mainland | -0.6 | 1.0 | 2.6 | 2.4 | 5.1 | 4.9 | 3.6 | 3.2 | 2.9 | 3.6 |
| Germany | 4.3 | 2.3 | 2.6 | 2.9 | 3.3 | 3.6 | 1.7 | 1.6 | 2.5 | 3.1 |
| India | -2.4 | -1.1 | -1.8 | -2.6 | -2.4 | -2.5 | -1.9 | -3.1 | -2.6 | -2.2 |
| Indonesia | 4.6 | 4.6 | 3.2 | 2.6 | 4.7 | 19.3 | 14.7 | 16.4 | 15.6 | .. |
| Japan | 2.7 | 2.9 | 2.5 | 1.8 | 2.4 | 3.1 | 2.7 | 2.4 | 1.7 | 2.4 |
| Korea | -0.2 | -0.8 | -0.9 | -2..9 | -0.7 | 13.1 | 7.0 | 3.7 | 3.2 | 3.0 |
| Malaysia | 8.2 | 3.7 | -0.1 | 3.8 | 3.5 | 24.2 | 28.6 | 23.1 | 20.9 | 19.1 |
| Mexico | 3.2 | -3.1 | 2.5 | 2.0 | 0.2 | -1.9 | -1.2 | -1.4 | -1.6 | -1.2 |
| Philippines | -4.8 | -9.7 | -12.1 | -13.7 | -13.5 | 0.0 | 6.5 | 5.0 | -1.0 | 0.5 |
| Thailand | -4.0 | -4.8 | -4.7 | -5.2 | 1.0 | 14.5 | 11.4 | 9.5 | 7.4 | 7.7 |
| Turkey | .. | -4.9 | -7.8 | -5.8 | -8.1 | -7.1 | -5.7 | -11.2 | -3.1 | -4.6 |
| UK | -1.7 | -2.2 | -1.7 | -1.8 | -1.5 | -2.5 | -3.0 | -3.2 | -3.4 | -3.4 |
| USA | -2.2 | -1.8 | -2.3 | -2.4 | -2.4 | -2.8 | -3.7 | -4.6 | -4.2 | -4.6 |
| .. Not Available | ||||||||||
| Source: International Financial Statistics, IMF. | ||||||||||
5.27 In the wake of the 1991 crisis, the issue of a sustainable current account deficit assumed crucial significance from an operational point of view. The path of the CAD in India during the period 1952-53 to 1998-99 is observed to be consistent with inter-temporal solvency, as it did not violate the inter-temporal budget constraint (Callen and Cashin, 1999). Their estimates of long-run sustainability suggest that a current account deficit in the range of 1.5 to 2.5 per cent of GDP could be consistent with the stabilisation of India’s net external liabilities to GDP ratio. The High Level Committee on Balance of Payments (Chairman: C. Rangarajan) recommended a CAD-GDP ratio of 1.6 per cent. The Tenth Five Year Plan (TFYP) projects a current account deficit consistent with macro parameters on domestic saving, investment and incremental capital-output ratio to achieve a growth rate of 8 per cent over the Plan period (i.e., 2002-03 to 2006-07). Domestic saving would be supplemented by a modest expansion in the inflow of external savings (CAD) from 0.9 per cent of GDP in the Ninth Plan to 1.6 per cent of GDP in the Tenth Plan period (Table 5.11). Given the experience of the 1990s and the macroeconomic targets set for the Tenth Plan, it is important that durable policies be put in place to increase the economy’s absorptive capacity commensurately (RBI, 2003).
5.28 To sum up, there is a growing consensus that high current account deficits have been at the core of external payments crises worldwide. The available literature suggests that a CAD-GDP ratio of about 5 per cent should be a cause for concern from the viewpoint of sustainability. In the Indian case, however,
| Table 5.11: Current Account Balances in India: | ||||
| Planned and Actual | ||||
| (Per cent to GDP) | ||||
| Year | Gross | Gross | Planned | Actual |
| Domestic | Domestic | Current | Current | |
| Savings | Investment | Account | Account | |
| Deficits | Deficits | |||
| 1 | 2 | 3 | 4 | 5 |
| 1991-92 | 22.0 | 22.6 | -1.6 | -0.3 |
| 1992-93 | 21.8 | 23.6 | -1.6 | -1.7 |
| 1993-94 | 22.5 | 23.1 | -1.6 | -0.4 |
| 1994-95 | 24.8 | 26.0 | -1.6 | -1.0 |
| 1995-96 | 25.1 | 26.9 | -1.6 | -1.7 |
| 1996-97 | 23.2 | 24.5 | -1.6 | -1.2 |
| 1997-98 | 23.1 | 24.6 | -2.1 | -1.4 |
| 1998-99 | 21.5 | 22.6 | -2.1 | -1.0 |
| 1999-00 | 24.1 | 25.2 | -2.1 | -1.1 |
| 2000-01 | 23.4 | 24.0 | -2.1 | -0.8 |
| 2001-02 | 24.0 | 23.7 | -2.1 | 0.2 |
| Tenth Plan (2002-03 to 28.4 | 26.8 | -1.6 | .. | |
| 2006-07) | ||||
| .. Not Available | ||||
| Source : CSO, Planning Commission, Government of India and | ||||
| Reserve Bank of India. | ||||
a current account deficit of a little above 3 per cent of GDP triggered off a payments crisis. This underscores the need to take a country-specific view of current account sustainability. J-curve and S-curve effects of nominal exchange rate changes on the current account are found to be significant in India, suggesting that demand effects generated by nominal exchange rate adjustments are transitory in nature. This implies a limited role for wielding the exchange rate as a policy instrument to influence the behaviour of the current account in the medium term. Second, it is observed that saving-investment correlations are smaller in developing countries as compared with the developed countries, implying financing of domestic investment through higher capital mobility. The Indian experience, however, turns out to be different from the developing country experience with high saving-investment correlation and low capital mobility. Furthermore, in India, a high positive saving-investment gap of the private sector is a reflection of stagnation in investment demand during the greater part of the 1990s. Thus, the negative public sector saving-investment gap in India seems to have been adjusted within the economy without spilling over to the external sector. Finally, in case of developing countries, unidirectional causality from fiscal deficits to current account deficits is detected. In India, even as fiscal deficits have remained downwardly inflexible, the current account deficit has remained insulated by buoyant private saving. Apart from the size, the composition of the financing of current account also matters for sustainability.

Share this page:


Install the RBI mobile application and get quick access to the latest news!
Scan the QR code to install our app


Page Last Updated on:


