 IST,
IST,
V. Domestic Financial Markets
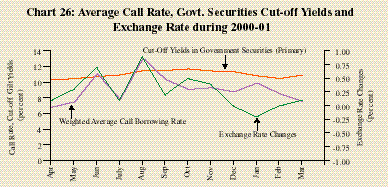
Financial markets, particularly money, foreign exchange, government securities and credit markets, exhibited a distinct co-movement during 2000-01. In turn, this necessitated active management of market liquidity; as a consequence, liquidity operations conducted during 2000-01 were enmeshed in market developments (Table 12 and Chart 26). Three phases can be distinguished in this growing integration: (i) easy liquidity conditions in April mid-May, 2000 i.e. Phase I, (ii) tightening of market conditions in May October 2000 i.e. Phase II and (iii) improvement in market sentiment in November 2000 onwards, i.e. Phase III.
Table 12: Developments in the Money, Gilt and Foreign Exchange Markets, 2000-01 |
Month | Commercial | Average | Turnover | Exchange | RBI’s Net | Net | Average | Average | Liquidity | Average | Average | 3-month | |||||||||
Banks’ | Daily | in | Rate | Foreign | OMO | Daily | Daily | Support | Daily | Call | Forward | ||||||||||
Borrowings | Inter- | Central | (Rs. per | Currency | Sales(-)/ | Repos | Reverse | to PDs** | Call/ | Money | premia | ||||||||||
from the | bank | Govt. | US Dollar) | Sale(-)/ | Pur- | (LAF) | Repo | (Rs. crore) | Notice | Borrowing | (per cent) | ||||||||||
RBI* | Foreign | Dated | Purchase(+) | chase (+) # | out- | (LAF) | Turnover | Rate | |||||||||||||
(Rs. crore) | Exchange | Securities | (US$ mn) | (Rs. crore) | standing | out- | (Rs. crore) | (per cent) | |||||||||||||
Turnover | Market £ | (Rs. crore) | standing | ||||||||||||||||||
(US$ mn) | (Rs. crore) | (Rs. crore) | |||||||||||||||||||
1 | 2 | 3 | 4 | 5 | 6 | 7 | 8 | 9 | 10 | 11 | 12 | 13 | |||||||||
2000 | |||||||||||||||||||||
April | 5,068 | 3,802 | 79,072 | 43.6388 | 368 | -36 | | | 466 | 44,687 | 6.79 | 2.59 | |||||||||
May | 10,341 | 4,781 | 78,198 | 43.9829 | -897 | -1,479 | | | 1,543 | 39,214 | 7.48 | 2.29 | |||||||||
June | 8,713 | 5,115 | 37,602 | 44.6893 | -1,051 | -510 | 0 | 1,327 | 4,136 | 27,089 | 11.08 | 3.32 | |||||||||
July | 5,847 | 4,253 | 86,571 | 44.7788 | -408 | -6,299 | 1,150 | 34 | 3,972 | 28,418 | 7.77 | 3.69 | |||||||||
August | 6,251 | 5,213 | 36,490 | 45.6800 | -467 | 1,197 | 8,807 | 36 | 5,614 | 21,809 | 13.06 | 5.10 | |||||||||
September | 5,292 | 4,603 | 45.660 | 45.8883 | -287 | -1,335 | 10,672 | 2 | 5,141 | 23,981 | 10.31 | 5.19 | |||||||||
October | 6,225 | 4,344 | 50,930 | 46.3445 | -494 | -66 | 8,321 | 166 | 4,716 | 30,218 | 9.07 | 4.40 | |||||||||
November | 5,624 | 4,282 | 1,07,696 | 46.7789 | 3,686 | -11,565 | 2,634 | 1403 | 1,229 | 32,148 | 9.28 | 4.05 | |||||||||
December | 6,692 | 4,173 | 87,004 | 46.7496 | -155 | -1,671 | 1,206 | 565 | 5,519 | 30,159 | 8.76 | 3.48 | |||||||||
2001 | |||||||||||||||||||||
January | 6,099 | 4,670 | 1,51,498 | 46.5439 | 832 | -87 | 0 | 1,762 | 5,333 | 38,530 | 9.89 | 4.24 | |||||||||
February | 5,130 | 5,156P | 1,41,793 | 46.5167 | 623 | -2 | 2,802 | 160 | 3,788 | 33,412 | 8.51 | 4.15 | |||||||||
March | 3,896 | 5,339P | 1,15,710P | 46.6205 | -40 | 3,952 | 650 | 5,010 | 36,217 | 7.52 | 4.44 | ||||||||||
P: Provisional. * Outstanding as on last reporting Friday of the month. £ Outright only. |
** As at the end of the month. # Inclusive of Treasury Bills. |
In April 2000, easy liquidity conditions, buoyed by strong capital flows brought stability to the foreign exchange market and enabled an easing of monetary conditions. There was a softening of interest rates across the spectrum. Commercial banks and primary dealers reduced their refinance drawals from the Reserve Bank. The government securities market witnessed a small rally. The yield curve shifted downwards, with a more pronounced steepening at the short end. Scheduled commercial banks' deposit and lending rates also declined. Prime lending rates of public sector banks (PSBs) eased to 11.25-12.50 per cent as on April 7, 2000 from 12.0-13.5 per cent as on February 25, 2000.
In the second phase, the return of excess demand conditions in the foreign exchange market was tackled with monetary tightening. The exchange rate depreciated and the turnover in the inter-bank segment of the foreign exchange market increased significantly. Money markets began to firm up, reflecting the twin impact of the monetary measures and heightened market activity. With the tightening of liquidity conditions, the turnover in the Central Government dated securities market plummeted. The rupee, which was range bound during the first half of July 2000, fell to Rs.45.02 per US dollar on July 21, 2000. Repo auctions hardened call rates, setting off a general firming up of interest rates. Scheduled commercial banks' deposit and lending rates began to edge upwards.
In the third phase, easy liquidity conditions prevailed due to the inflow of proceeds under the India Millennium Deposit (IMD) scheme from abroad. The return of comfortable liquidity conditions generated interest in gilts. This enabled the market off-take of government paper either through government securities auctions or through the OMO window. The exchange rate stabilised from November 2000. There was a softening of interest rates across the spectrum.
Credit Market
The deposit and lending rates of banks were also influenced by the phases of monetary and liquidity conditions during 2000-01. The reduction of the savings deposit rate by 0.5 percentage point to 4.0 per cent in the beginning of 2000-01 reduced the cost of funds in the banking system. The easing of interest rates in term deposits, however, commenced in June 2000 across all the maturity periods for public sector, private sector and foreign banks. The dynamics, however, depended on the maturity period of the deposits. The interest rates on one-year deposits were decreased by the PSBs from 5.0-9.0 per cent in May 2000 to 4.0-8.0 per cent in December 2000 and by foreign banks from 4.0-11.0 per cent to 4.0-10.5 per cent, albeit with some increase in August-September for both the bank groups. The interest rates on such deposits remained almost unchanged for PSBs but declined for foreign banks to 4.25-10.75 per cent during the last quarter of 2000-01. The private banks reduced the interest rates on deposits under this tenor from 5.0-10.5 per cent to 4.5-10.25 per cent during May-December 2000 with some firming up during September-October as well as during the last quarter of 2000-01. In case of deposits for a maturity period of 1-3 years, only the peak interest rates came down by 100 basis points and 25 basis points over May-December 2000 for PSBs, and private sector and foreign banks, respectively. During the fourth quarter of 2000-01, while the interest rates on deposits of 1-3 years of private sector banks remained more or less unchanged, those for public sector and foreign banks firmed up. In case of deposits above 3-year maturity, interest rates for PSBs declined from 9.75-11.0 per cent and those for private sector banks moved from 10.0-12.5 per cent to 9.50-10.25 and 9.25-11.5 per cent, respectively, during May-December 2000. In the case of foreign banks, only the trough interest rates decreased for these deposits by 50 basis points since November 2000. During the fourth quarter of 2000-01, the interest rate on such deposits for public sector banks declined but remained unchanged for private and foreign banks.
Under easy liquidity conditions prime lending rates (PLRs) of the PSBs and foreign banks declined from 12.0-13.5 per cent and 10.5-17.5 per cent in March 2000 to 11.25-12.5 per cent and 9.75-17.50 per cent, respectively, in April 2000. As monetary conditions tightened in August 2000, the PLRs of the PSBs and foreign banks also rose to 11.75-13.0 per cent and 10-17.5 per cent, respectively. However, during September-December 2000, while the PLR range for the PSBs remained around 11.75-13.00 per cent, the PLRs of foreign banks decreased by 75 basis points at the lower end by November 2000. The private banks, however, responded with some lag to the conditions, easing their interest rates only in July and August 2000 and hiking them since September 2000. During the fourth quarter of 2000-01, the PLR was reduced at the lower end from 11.75 per cent to 10.0 per cent by PSBs and 10.25 per cent to 8.0 per cent by private sector banks but remained unchanged for foreign banks.
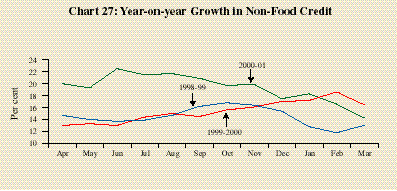
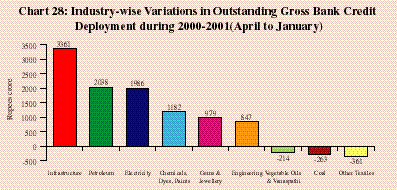
The year-on-year growth of non-food bank credit during 2000-01 kept above the growth rates recorded in the previous year up to January 2001 (Chart 27). A sectoral deployment analysis of non-food gross bank credit of 50 reporting banks up to January 2001 shows that the expansion of credit was absorbed by medium and large industry (Rs.16,127 crore), followed by the priority sector (Rs.15,464 crore), other sectors (Rs.9,232 crore) and wholesale trade (Rs.2,394 crore). The increase in bank credit partly reflected build up inventories of fertilisers, sugar, petroleum and automobiles. In addition, there was significant increase in credit for infrastructure such as power, telecommunications, roads and ports. Credit flow to petroleum, electricity, gems and jewellery and retail segments was also relatively high. At the same time, other textiles, vegetable oils and coal registered moderate decline in credit (Chart 28). The pace of credit expansion decelerated since December 2000 in line with subdued industrial activity. For the year as a whole, the rate of expansion of non-food credit at 14.3 per cent (Rs.58,664 crore) was lower as compared with that of 16.5 per cent (Rs.58,246 crore) in the corresponding period of the previous year.
The investments by scheduled commercial banks in government and other approved securities showed a higher increase of Rs.60,889 crore during 2000-01 than Rs.54,349 crore during 1999-2000. Investments by scheduled commercial banks in non-SLR securities recorded lower increase of Rs.12,367 crore (up to March 9, 2001) than Rs.13,161 crore deployed during 1999-2000.
As per provisional information available so far, the resource flow from bank and non-bank sources, inclusive of capital issues, GDRs/ADRs/FCCBs, CPs subscribed by non-banks and borrowings as well as bills rediscounted with financial institutions, to the commercial sector increased by Rs.1,47,420 crore during 2000-01 as compared with Rs.1,59,935 crore during the preceding year (Table 13).
Table 13: Total Flow of Non-Food Resources to Commercial Sector |
(Rupees crore) | |||||||||||||||||||||
Item | 1999-2000 | 2000-01P | |||||||||||||||||||
1 | 2 | 3 | |||||||||||||||||||
I. | Scheduled Commercial Banks (I.1+I.2) | 71,407 | 71,191 | ||||||||||||||||||
I.1. Non-food credit | 58,246 | 58,824 | |||||||||||||||||||
I.2. Other Investments (2.1+2.2+2.3) | 13,161 | 12,367* | |||||||||||||||||||
2.1. Commercial Paper (CP) | 1,030 | 2,196 | |||||||||||||||||||
2.2. Bonds/Debentures/Preference Shares Issued by | 11,635 | 9,818 | |||||||||||||||||||
2.2.1 Public Sector Undertakings (PSU) | 6,430 | 6,322 | |||||||||||||||||||
2.2.2 Private Corporate Sector | 5,205 | 3,496 | |||||||||||||||||||
2.3 Equity Shares issued by PSUs and Private Corporate Sector | 497 | 353 | |||||||||||||||||||
II. | Other Banks | 20,395 | 11,913@ | ||||||||||||||||||
III. | Other Sources (III.1+III.2+III.3+III.4+III.5) | 68,133 | 64,316 | ||||||||||||||||||
III.1 Bills rediscounted with financial institutions | -96 | 291** | |||||||||||||||||||
III.2 Capital Issues $ (2.1+2.2) | -617 | 1,815*** | |||||||||||||||||||
2.1 Non-Government Public Companies | -617 | 1,815 | |||||||||||||||||||
2.1.1 Debentures and Preference Shares | -2,804 | -371 | |||||||||||||||||||
2.1.2 Equity shares | 2,187 | 2,186 | |||||||||||||||||||
2.2 PSU and Government Companies | 0 | 0 | |||||||||||||||||||
III.3 Global Depository Receipts (GDRs) and Foreign Currency | 1,721 | 5,549** | |||||||||||||||||||
Convertible Bonds (FCCBs) | |||||||||||||||||||||
III.4 Issue of CPs # | -137 | -869@@ | |||||||||||||||||||
III.5 Borrowings from Financial Institutions (FIs) ## | 67,264 | 57,531** | |||||||||||||||||||
Total Flow of Non-food Resources (I+II+III) | 1,59,935 | 1,47,420 | |||||||||||||||||||
Memo Items | |||||||||||||||||||||
1. | Loans to Corporates against shares held by them to enable Them | -44 | -5* | ||||||||||||||||||
to meet the promoters' contribution to equity of new companies | |||||||||||||||||||||
in anticipation of raising resources | |||||||||||||||||||||
2. | Private Placements | 61,259 | 46,241$$ | ||||||||||||||||||
P Provisional. | $ Adjusted for banks' investments in shares and debentures. |
# Excluding CPs issued to banks. | ## Excludes bills rediscounted with FIs. |
* Up to March 9, 2001. | *** Up to January 2001@ Preliminary Estimate. |
** Up to February, 2001. | @@ Up to March 15, 2001. $$ Up to December 2000. |
Money Market
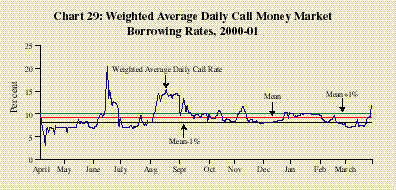
Money market conditions during 2000-01 were determined, to a large extent, by the interplay between the short-term influences from exchange market developments and the Reserve Bank's liquidity operations. Inter-bank call money borrowing rates generally remained easy during 2000-01 except for spurts in June and in August (Chart 29). The volatility in the daily weighted average call money borrowing rates was also high in June and August.
Easy liquidity conditions prevailing in April-mid-May 2000 kept the call rates moving generally in a range defined by the fixed repo rate (5 per cent) and slightly above the Bank Rate (7 per cent). Devolvement of government securities upon the Reserve Bank absorbed pressures on market liquidity and call rates ruled easy up to the first week of June 2000. Advance tax payments and volatility in the foreign exchange market in the second week caused a spurt in call rates to 20.34 per cent on June 17, 2000. Spot sales of foreign exchange and reverse repo auctions, averaging about Rs.1,327 crore, at increasing interest rates (9.05 per cent on June 9 to 10.85 per cent on June 14) under the newly introduced Liquidity Adjustment Facility (LAF) helped to ease liquidity conditions. The call rate tended to move in tandem with the reverse repo rates (Table 14).
Average (%) | Standard | Coefficient of | |||||||||||||||||
Deviation (%) | Variation | ||||||||||||||||||
1 | 2 | 3 | 4 | ||||||||||||||||
April | 6.79 | 1.21 | 0.18 | ||||||||||||||||
May | 7.48 | 0.67 | 0.09 | ||||||||||||||||
June | 11.08 | 3.67 | 0.33 | ||||||||||||||||
July | 7.77 | 0.86 | 0.11 | ||||||||||||||||
August | 13.06 | 2.12 | 0.16 | ||||||||||||||||
September | 10.31 | 1.28 | 0.12 | ||||||||||||||||
October | 9.07 | 0.77 | 0.08 | ||||||||||||||||
November | 9.28 | 1.27 | 0.14 | ||||||||||||||||
December | 8.76 | 0.84 | 0.10 | ||||||||||||||||
January | 9.89 | 0.20 | 0.02 | ||||||||||||||||
February | 8.51 | 0.59 | 0.07 | ||||||||||||||||
March | 7.52 | 0.55 | 0.07 | ||||||||||||||||
The inflow of funds in the form of coupon payments and redemption of zero coupon bonds enabled easy market conditions in July 2000 except for some edging up of the rates associated with measures to counter foreign exchange market pressures. After August 3, however, with pressures resuming in the foreign exchange market, liquidity was absorbed through repo (including multi-period repo) auctions. The call rates spurted for the second time during 2000-01, remaining in two digits during August 4-31, 2000 with the monthly average call money borrowing rate at 13.06 per cent.
The call money rates softened during September-October 2000 following the restoration of stability in the foreign exchange market, a reduction in repo cut-off rates and the expectations of inflow of funds through India Millennium Deposits (IMDs). Despite some hardening of call rates around mid-September, the inflows from coupon payments and redemption of government securities effectively balanced the advance tax outflows and subscriptions to government securities. The rates remained range bound at 9.5-10.0 per cent in the latter half of September, declining to 8.21 per cent by end-October as cut-off repo rates were brought down to 8 per cent and the IMD inflows trickled into the system.
While the call rates steadily inched up during the first ten days of November following auction outflows and strong appetite for open market sales, reverse repo operations met the demand for liquidity. With IMD funds and coupon inflows, call rates hovered around the Bank Rate of 8.0 per cent for the most part of November and December. Call rates firmed up towards end-December 2000 in the wake of advance tax payments, the rally in gilts and government securities auctions. They softened in February 2001 with a cut in the Bank Rate by 50 basis points effective February 17, 2001 followed by the injection of liquidity on account of the CRR cuts of 0.25 percentage points each effective February 24 and March 10. Call rates softened further with another cut on the Bank Rate by 50 basis points effective March 2, 2001. Monthly average call rates declined from 8.5 per cent in February 2001 to 7.5 per cent in March 2001.
Treasury Bills
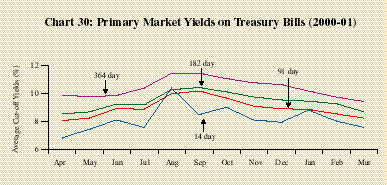
Easy liquidity conditions during April 2000 facilitated a small rally in Treasury Bills, which provided a conducive environment for successful auctions at lower implicit cut-off yields as compared with March 2000. While average cutoff yields of Treasury Bills increased (except for 364-day paper) in May and June (Table 15) due to tightened conditions in the money market, the Reserve Bank took substantial devolvement in June and prevented further rise in primary yields. Easy liquidity conditions in July till the announcement of monetary tightening measures on July 21, 2000 facilitated successful auctioning of Treasury Bills of all durations by the Reserve Bank with no devolvement on the Reserve Bank (except for 364-day Treasury Bills in the July 12 auction). Treasury Bill rates (except for 364-day Treasury Bills) eased further in July. In the later half of July, the Reserve Bank revised the implicit cut-off yields upwards in consonance with the monetary measures on July 21 and there was no devolvement of Treasury Bills on the Reserve Bank during the month. During August 2000, although the Reserve Bank allowed higher cut-off yields in the primary Treasury Bill market, there was devolvement in every Treasury Bill auction on the Reserve Bank during the month on account of inversion of the short-term curve.
Table 15: Average Treasury Bill Cut-off Yields During 2000-01 |
(Per cent) | |||||||||||||||||||
14-day | 91-day | 182-day | 364-day | ||||||||||||||||
Treasury Bills | Treasury Bills | Treasury Bills | Treasury Bills | ||||||||||||||||
1 | 2 | 3 | 4 | 5 | |||||||||||||||
2000-01 | |||||||||||||||||||
April | 6.78 | 8.05 | 8.53 | 9.27 | |||||||||||||||
May | 7.43 | 8.23 | 8.67 | 9.15 | |||||||||||||||
June | 8.09 | 8.91 | 9.23 | 9.24 | |||||||||||||||
July | 7.56 | 8.86 | 9.17 | 9.77 | |||||||||||||||
August | 10.39 | 9.97 | 10.27 | 10.82 | |||||||||||||||
September | 8.48 | 10.17 | 10.42 | 10.85 | |||||||||||||||
October | 9.00 | 9.67 | 10.11 | 10.45 | |||||||||||||||
November | 8.09 | 9.08 | 9.74 | 10.15 | |||||||||||||||
December | 7.93 | 8.90 | 9.53 | 10.02 | |||||||||||||||
January | 8.80 | 8.85 | 9.44 | 9.55 | |||||||||||||||
February | 8.02 | 8.53 | 9.26 | 9.13 | |||||||||||||||
March | 7.56 | 8.23 | 8.69 | 8.81 | |||||||||||||||
The improved market sentiment and the accompanying decline in repo and call rates during September 2000 was reflected in the bidding amounts exceeding the notified amounts in the Treasury Bill auctions with little or no devolvement on the Reserve Bank and only a slight increase in cut-off yields. With market clearing yields being offered in the auctions in October and November 2000 the cut-off yields reflected the movement in call rates, liquidity conditions and improved price expectations associated with IMD flows. With a view to offering the market increased amount of short-term paper, the notified amount of 364-day Treasury Bills was increased from Rs.500 crore for each auction to Rs.750 crore for the rest of 2000-01 from December onwards. The comfortable medium term outlook was reflected in the declining yields in respect of all Treasury Bills during December 2000 and January 2001 This resulted in flattening the yield curve at the shorter end. Yields of all Treasury Bills declined in February-March 2001 in response to monetary easing (Chart 30).
Other Money Market Instruments
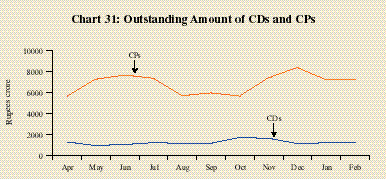
The commercial paper (CP) market slowly started picking up amidst easy liquidity conditions and the outstanding amount of CPs progressively increased from Rs.5,634 crore on April 15 to Rs.7,627 crore on June 30, 2000 with rates of discount easing from a range of 9.58-12.25 per cent to 9.25-11.75 per cent (Chart 31). However, the CP market remained subdued during July-October 2000. The outstanding amount declined to Rs.5,574 crore on October 15, 2000 and the rates of discount hardened due to firming up of interest rates consequent upon monetary tightening measures announced on July 21. Thereafter, as the interest rate situation turned easy with a decline in the cut-off repo rates and softening of call rates, the rates of discount declined and the outstanding amount increased to Rs.8,343 crore on December 31, 2000 but decreased to Rs.7,246 crore on February 28, 2001. Amidst generally comfortable liquidity conditions during 2000-01 (up to February 2001), the outstanding amount of CDs remained low.
Government Securities Market
During 2000-01, the developments in Government securities market were largely influenced by the size of the Government borrowing programme, foreign exchange market conditions and market expectations of declining yields in the wake of reduction in administered interest rates on small savings and provident funds, and the Bank Rate cut in February 2001. The yield curve shifted upwards and became steeper in the first half of the year, reflecting a greater preference for shorter maturity paper. The yield curve flattened from November 2000 with the inflow of IMD proceeds and the restoration of stability in the foreign exchange market.
The easy liquidity conditions of April 2000 allowed for an overwhelming response to the commencement of the market borrowing programme of the Central Government. The first auction of Rs. 5,000 crore was absorbed at the cut-off yield-to-maturity at 10.26 per cent. The market sentiment turned unfavourable in May with pressures building up in the foreign exchange market. The yields firmed up with expectations of monetary tightening in response to the exchange market developments. Unfavourable market conditions continued in July and August and the Reserve Bank undertook substantial devolvements and private placements during this period in order to assuage market pressures and smoothen the yield curve. Sentiment improved with the IMD inflows and the market absorption became substantial at Rs. 34,625 crore out of a mobilisation of Rs.36,000 crore between September 2000 and March 2001. Interest in longer term paper revived with rate cut expectations and new issuances of muturities beyond 10 years.
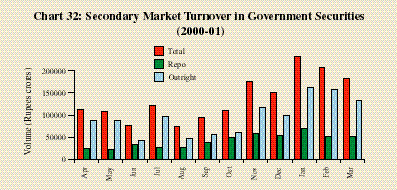
Secondary market activity during 2000-01 tracked the sentiment in the liquidity conditions in the primary segment both in terms of yield movements and turnover (Chart 32). In tandem with the easing of call rates during April-mid-May 2000, the government securities market witnessed a small rally and the yield curve shifted downwards, tilting more at the short-end, as the issuance of long tenor securities by the Reserve Bank somewhat contained the price increase at the long end. As the liquidity conditions tightened and foreign exchange market uncertainties surfaced, the yield curve shifted up with shorter maturity paper displaying a relatively higher than proportionate increase. There was some easing of yields during the first half of July 2000 on account of inflows of coupon payments and redemptions of government securities as well as private placement of Government securities with the Reserve Bank.
The gains in Government security prices, however, petered off during the second half of July and August. Yields again crept upwards in face of uncertainties in the foreign exchange market, the impact of monetary measures to counter these movements and the absorbing of liquidity through repos in the second half of July and August. The illiquidity of longer maturity paper prompted the Reserve Bank to offer to PDs, on a temporary basis, switches from three medium to long dated Government securities to 364-day treasury-bills. The higher returns in the repo, call money and the foreign exchange markets encouraged participants to divert their funds away from dated Government securities.
As the foreign currency market stabilised, the cut-off repo rates were progressively brought down during September-October 2000 and interest in the government securities market improved. Yields at the short and medium ends declined. As the proceeds of IMDs entered the system, the exchange market stabilised and activity picked up for the first time in 2000-01 at the longer end of the maturity spectrum. The yields of the longer dated maturities came down in the face of a bullish rally in Government securities. The aggressive auctioning of government securities could arrest this rally temporarily. In December, the rally resumed at the long end with improved sentiment on account of a stable rupee, declining oil prices and expectations of cut in international interest rates. The two-stage cut in the U.S. interest rates by 100 basis points provided the backdrop for a sharp rally in the secondary market for gilts in January 2001. It also fuelled market expectations of an interest rate cut in India to restore the pre-July 2000 position. Reduction in the Bank Rate and CRR by 50 basis points each partly met the market expectations. The Government’s resolve to contain the fiscal deficit as also to address structural issues related to administered interest rates on small savings enabled the Reserve Bank to further reduce the Bank Rate by 50 basis points on March 3, 2001. Yields did not fall any further after the second Bank Rate cut, indicating that this reduction had already been discounted. In March 2001, the market remained somewhat volatile for a very brief period on year-end considerations viz. profit booking and reluctance to take fresh positions as also the developments in the capital market.
Foreign Exchange Market
Developments in the foreign exchange market during 2000-01 alternated between conditions of excess supply during April 2000, excess demand conditions on account of higher oil imports and reduced capital flows during mid-May to early November and the return to normalcy thereafter in response to improved supply of foreign exchange led by funds mobilised under India Millennium Deposits (IMDs) and the associated turnaround in market sentiment.
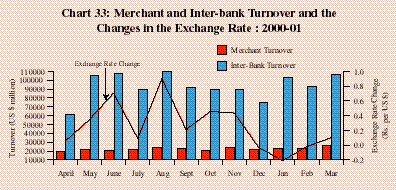
Activity in the inter-bank segment of the market reflected these alternating phases, with heightened inter-bank turnover during periods of market volatility (Chart 33).
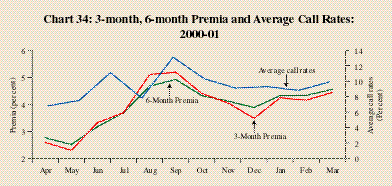
As both market sentiment and liquidity improved the forward premia eased across all maturities during October-December 2000 after rising during May-September 2000. From January 2001 onwards forward premia firmed up reflecting interest rate cuts in the US. The forward premia generally tracked the behaviour of the call money rates (Chart 34).
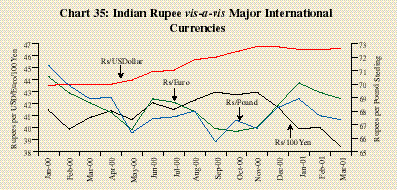
The strengthening of the US dollar vis-a-vis the major international currencies was mirrored in the movements of the rupee vis-a-vis these international currencies. In July 2000, although the rupee depreciated by 0.2 per cent against the US dollar, it appreciated against the Euro (by 0.6 per cent), and the Japanese Yen (by 1.3 per cent). From November 2000 onwards, the rupee depreciated against the Euro and the Pound sterling. Over the year as a whole, while the rupee depreciated by 6.5 per cent and 0.9 per cent vis-a-vis the US dollar and the Euro, it appreciated by 6.2 per cent and 2.3 per cent against the Japanese Yen and the British Pound (Chart 35).
The primary objective of the Reserve Bank in regard to the management of the exchange rate continues to be the maintenance of orderly conditions in the foreign exchange market, meeting temporary supply-demand gaps which may arise due to uncertainties or other reasons, and curbing destabilising and self-fulfilling speculative activities. To this end, as in the past, the Reserve Bank continued to monitor closely the developments in the financial markets at home and abroad, and carefully coordinated its market operations with appropriate monetary, administrative and other measures as was considered necessary from time to time.
Capital Market
Equity Market
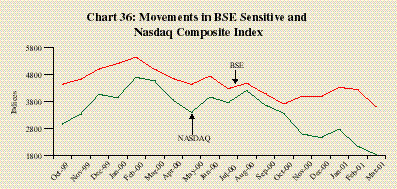
The stock market remained generally subdued during 2000-01. The decline in the BSE Sensitive Index (Sensex) reflected large sell-offs in global equity markets particularly in ‘new economy’ stocks on the NASDAQ, slowdown in Foreign Institutional Investors (FIIs) inflows, deceleration in industrial growth and the increase in international oil prices (Chart 36).
Towards the end of February 2001, the stock market turned buoyant in response to the Union Budget for 2001-02, with the BSE Sensex gaining 4.4 per cent on February 28, 2001 the day of the presentation of the Budget. Market optimism was, however, interrupted during the first week of March 2001 due to the sharp decline in the NASDAQ and certain adverse developments including apprehensions of payment difficulties. The Securities and Exchange Board of India (SEBI) undertook several measures to restore orderly conditions in the stock exchanges including banning of short sales, imposition of additional deposit margins on net outstanding sales of all shares, restraining broker-directors from acting as directors on the Governing Board of the BSE. Settlements in various stock exchanges were completed smoothly with shortfalls of some brokers being met by drawing down the trade/settlement guarantee funds set up by the exchanges. The market responded positively to the measures initiated by the SEBI and stability was restored by the end of the month.
The Reserve Bank has also been monitoring conditions in other segments of the financial markets, which have remained unaffected by the disturbance in the capital market. In the foreign exchange market, there have been net inflows, particularly on account of investment in the stock market by the FIIs. Thus, despite temporary seizures in the capital market, international investor sentiment continued to be positive.
The BSE Sensex (Base: 1978-79 = 100), which stood at 5001.28 at end-March 2000 declined to touch a low of 3540.65 on March 13, 2001. The index recovered to close at 3604.38 as at end-March 2001. Nevertheless, it declined by 1396.90 points (27.93 per cent) over the end-March 2000 level. In terms of monthly averages, the Sensex, which stood at 5,261.77 in March 2000, declined to touch 3807.64 by March 2001, registering a decline of 1454.13 points (27.64 per cent).
The market capitalisation at BSE declined by 21.54 per cent from Rs.9,12,842 crore as at end-March 2000 to Rs.7,16,173 crore as at end-February 2001. The Price/Earnings (P/E) ratio of BSE Sensex based scrips increased marginally from 21.60 as at end-March 2000 to 21.98 as at end-February 2001. The average daily turnover at BSE increased sharply from Rs.4050.64 crore in March 2000 to Rs.5071.36 crore in February 2001. The volatility in share prices as measured by coefficient of variation in respect of BSE Sensex increased to 4.77 per cent during March 2001 from 3.6 per cent during March 2000. Deliveries as a percentage of turnover which was 25.33 per cent during March 2000 declined sharply to 15.90 per cent during February 2001.
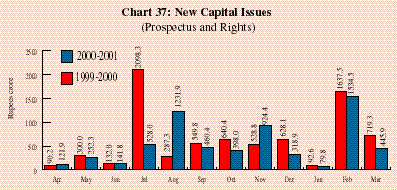
The new issue market (public issues) witnessed subdued activity during 2000-01 mainly due to decline in the resource mobilisation by the public sector. Overall resource mobilisation from the primary market declined by 16.4 per cent to Rs.6,439 crore from Rs.7,704 crore during 1999-2000 even as the number of issues floated in the public issues market increased markedly to 146 issues from 83 issues during the previous year (Chart 37). While resource mobilisation by the private sector decreased by 3.6 per cent to Rs.4,966 crore as compared with Rs.5,153 crore during 1999-2000, that by the public sector declined by 42.3 per cent to Rs.1,472 crore. The average size of the issue in the private sector came down to Rs.35 crore from Rs.65 crore primarily due to the marked increase in the small sized issues floated mainly by the information technology sector (80 issues for an aggregate amount of Rs.664 crore).
The private placement market (almost entirely dominated by debt issues) continued to be the primary route of resource mobilisation. Resources mobilised during April-December 2000 at Rs.46,241 crore witnessed an increase of 7.5 per cent as compared with 22.8 during April-December 1999.
The Euro issues market (in the form of ADRs, GDRs and FCCBs) witnessed increased activity during April 2000-February 2001. Eleven issues were floated during this period for an aggregate amount of Rs.3,581.67 crore (US $ 799.57 million) as compared with only five issues aggregating Rs.2,835.11 crore (US $ 650.60 million) during April 1999-February 2000.
According to the SEBI, net resource mobilisation by all mutual funds during April-February 2000-01 at Rs.10,942 crore declined sharply by 39.1 per cent as compared with Rs.17,966 crore mobilised during the corresponding period of the previous year. The net resource mobilisation by all mutual funds during 1999-2000 at Rs.18,969 crore was the highest ever mobilised in any single financial year mainly due to the tax incentives announced in the Union Budget for 1999-2000.
During April-February 2000-01, financial assistance sanctioned and disbursed by All India Financial Institutions (AIFIs) at Rs.97,658 crore and Rs.57,822 crore witnessed an increase of 12.8 per cent and 13.2 per cent, respectively, over the corresponding period of the previous year. During April-February 1999-2000, sanctions and disbursements grew at marginally higher rates of 15.1 per cent and 16.2 per cent, respectively.
Page Last Updated on:


