V. Domestic Financial Markets - RBI - Reserve Bank of India
V. Domestic Financial Markets
Money Market
Foreign Exchange Market
Credit Market
Government Securities Market
Capital Market
Financial markets were characterised by conditions of ample liquidity and a general easing of yields during 2002-03. In the money market, call rates fell below the repo rate in June 2002 and intermittently from November 2002 onwards, despite successive repo rate cuts. Interest rates in other money market segments moved in tandem, particularly the Treasury Bill segment. In the foreign exchange market, excess supply conditions resulted in a modest appreciation of the spot exchange rate against the US dollar and an easing of the forward premia to around 3.5 per cent by March 2003. Persistent rallies drove down gilt yields even as turnover rose (Chart 44). The pronounced reduction of yields in the longer tenors flattened the yield curve notwithstanding some correction in February 2003. Risk premia on corporate bonds declined during the year.
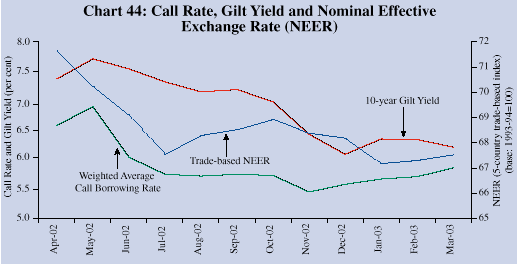
In the credit market, banks responded to liquidity conditions and policy signals by reducing deposit rates; however, lending rates did not decline commensurately. Spreads below the prime lending rates, nevertheless, widened. The recovery in non-food credit demand stemmed mainly from medium and large industry, housing and wholesale trade. Equity markets remained bound by bearish sentiments, geo-political uncertainties and heightened risk aversion in international equity markets (Table 15).
Table 15 : Developments in the Money, Foreign Exchange, Gilt and Capital Markets, 2002-03 |
||||||||||||||||||||||
|
|
||||||||||||||||||||||
Commercial |
Average |
Turnover |
Average |
Monthly |
RBI’s net |
Net |
Average |
Average |
Liquidity |
Average |
Forward |
BSE |
||||||||||
Banks’ |
Daily |
in |
Daily |
Average |
Foreign |
OMO |
Daily |
Daily |
Support |
Call |
premia |
Sensex |
||||||||||
Borrowings |
Inter- |
Central |
Call/ |
Exchange |
Currency |
Sales (-)/ |
Repos |
Reverse |
to PDs |
Money |
3-Month |
(Average) |
||||||||||
From the |
bank |
Govt. |
Notice |
Rate |
Sales (-)/ |
Purch- |
(LAF) |
Repo |
(as at |
Borrow- |
(Per cent) |
|||||||||||
RBI* |
Foreign |
Dated |
Turnover |
(Rs. per |
Purch- |
ases (+) |
out- |
(LAF) |
end of the |
ing Rates |
||||||||||||
(Rs. Crore) |
Exchange |
Securities |
(Rs. Crore) |
US Dollar) |
Ases (+) |
(Rs. crore) |
standing@ |
out- |
month) |
(Per cent) |
||||||||||||
Turnover |
Market # |
(US $ mn) |
(Rs. crore) |
standing@ |
(Rs. crore) |
|||||||||||||||||
(US $ mn) |
(Rs. crore) |
(Rs. crore) |
||||||||||||||||||||
|
|
||||||||||||||||||||||
1 |
2 |
3 |
4 |
5 |
6 |
7 |
8 |
9 |
10 |
11 |
12 |
13 |
14 |
|||||||||
|
|
||||||||||||||||||||||
2002 |
||||||||||||||||||||||
April |
3,523 |
6,541 |
1,93,091 |
41,616 |
48.92 |
477 |
-3,461 |
8,119 |
1,322 |
1,013 |
6.58 |
6.12 |
3435 |
|||||||||
May |
826 |
4,966 |
1,20,173 |
39,326 |
49.00 |
86 |
-163 |
1,924 |
17 |
121 |
6.90 |
6.23 |
3303 |
|||||||||
June |
336 |
4,836 |
1,16,846 |
28,905 |
48.97 |
241 |
-191 |
10,329 |
0 |
0 |
6.04 |
5.37 |
3257 |
|||||||||
July |
22 |
4,922 |
2,35,586 |
32,386 |
48.76 |
1,829 |
-6,539 |
14,636 |
0 |
0 |
5.75 |
4.40 |
3215 |
|||||||||
Aug. |
15 |
4,564 |
2,44,717 |
32,269 |
48.59 |
1,179 |
-14,359 |
11,825 |
0 |
0 |
5.72 |
4.09 |
3053 |
|||||||||
Sep. |
12 |
4,429 |
1,70,345 |
28,883 |
48.44 |
965 |
-1,475 |
12,181 |
0 |
0 |
5.75 |
3.94 |
3086 |
|||||||||
Oct. |
8 |
4,156 |
2,48,038 |
30,469 |
48.37 |
1,171 |
688 |
14,656 |
0 |
0 |
5.73 |
3.81 |
2950 |
|||||||||
Nov. |
30 |
5,093 |
3,34,605 |
25,821 |
48.25 |
2,115 |
-9,504 |
8,141 |
2 |
0 |
5.45 |
3.66 |
3058 |
|||||||||
Dec. |
34 |
5,054 |
2,95,943 |
24,305 |
48.14 |
1,679 |
-19,091 |
6,855 |
0 |
0 |
5.58 |
3.32 |
3316 |
|||||||||
2003 |
||||||||||||||||||||||
Jan. |
8 |
4,941 |
3,55,821 |
24,034 |
47.93 |
1,785 |
-5,332 |
5,005 |
13 |
0 |
5.66 |
3.42 |
3328 |
|||||||||
Feb. |
5 |
5,206 |
1,39,689 |
20,682 |
47.73 |
2,335 |
-14,990 |
3,786 |
45 |
0 |
5.71 |
3.55 |
3279 |
|||||||||
Mar. |
79 |
6,444 |
1,31,947 |
24,357 |
47.64 |
- |
-2,443 |
2,221 |
1,570 |
37 |
5.86 |
3.60 |
3156 |
|||||||||
|
|
||||||||||||||||||||||
* Outstanding as on last reporting Friday of the month; |
# Outright only; |
@ Excludes fornightly repos. |
||||||||||||||||||||
OMO : Open Market Operations; LAF : Liquidity Adjustment Facility; PD : Primary Dealers; BSE : Bombay Stock Exchange |
||||||||||||||||||||||
The weighted average call money borrowing rate was generally close to the floor of the informal LAF corridor (set by the repo rate) over the greater part of 2002-03, occasionally dipping under (Chart 45). Short lived spurts in call rates were associated with shifts in liquidity conditions created by the launch of the Central Government’s borrowing programme in the first two months of the year, adverse sentiments arising out of border tensions in May 2002 and auctions/open market sales in the third and fourth quarters. Liquidity in the market was modulated through continuous repo operations and a combination of private placements of government securities with the Reserve Bank and cuts in the repo rate.
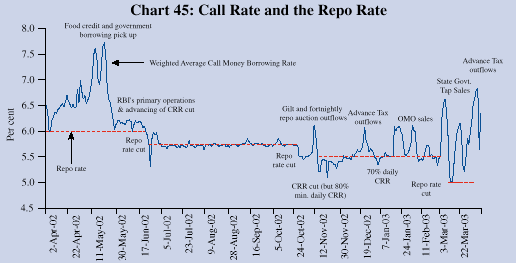
During the first week of April 2002, increased expenditure by the Central and State Governments, temporary float pending distribution of food credit subsidy amongst eligible banks and other transient factors drove the call rates below the repo rate. The liquidity conditions tightened with the pick-up in food credit and the Centre’s market borrowing firming up the weighted average call money borrowing rates above 7.7 per cent around mid-May 2002. The Reserve Bank’s primary market operations, a 50 basis point cut in the CRR, and redemption inflows comforted the money market in June 2002. The call rates remained range-bound between 6.0-6.2 per cent during the first three weeks but went below the repo rate by the fourth week of the month. Easy liquidity conditions prompted a reduction in the repo cutoff rate by 25 basis points to 5.75 per cent on June 27, 2002.
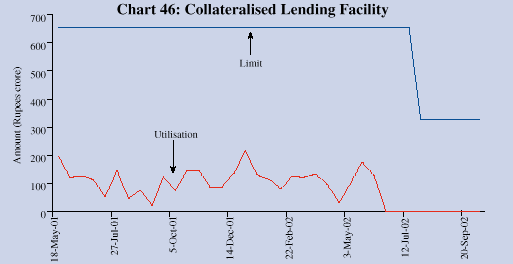
The call rates hovered around the repo rate during the third quarter of 2002-03 with the curtailing of the Collateralised Lending Facility (CLF) in July 2002 not causing any strain to the money market conditions. As mentioned earlier, the CLF was deactivated in October 2002. Banks brought down their utilisation of CLF to zero, well ahead of the phasing out of this facility (Chart 46).
The market adapted smoothly to the first stage of prudential limits on borrowings and lendings of scheduled commercial banks and on lendings of primary dealers in the call/notice money market which became operative effective October 5, 2002. The repo rate was further lowered by 25 basis points to 5.5 per cent from October 30, 2002. The call rates edged up temporarily around mid-November 2002 due to outflows towards gilt auctions and fortnightly repo auctions at a time when the banks were preparing to switch towards higher minimum average daily CRR maintenance. The usual advance tax outflows and hike in the notified amount of 91-day Treasury Bill auctions in December 2002 tightened the liquidity conditions and firmed up the call rates. The second stage of prudential limits of call money lendings and borrowings of banks became effective from the fortnight beginning December 14, 2002. Open market sales in January 2003 and tap sales of State Government securities in February 2003 raised the call rates. After softening in tune with the reduction in the repo rate by 50 basis points on March 3, 2003, the call rates edged up later in the month again reflecting the usual end-of-the year tightness in liquidity conditions.
Turnover in the call/notice money market declined as the year progressed, reflecting lower reliance of market participants on call/notice funds. The low volatility in the call money market during 2002-03 was co-incident with the easing of the call rates (Table 16).
Table 16 : Call Money Market |
||||
|
|
||||
Month |
Call Money |
CV |
Average Daily |
|
Borrowing Rate |
Call/ Notice |
|||
(Weighted Average) |
Turnover |
|||
(Per cent) |
(Rupees crore) |
|||
|
|
||||
1 |
2 |
3 |
4 |
|
|
|
||||
April 2002 |
6.58 |
0.11 |
41,616 |
|
May 2002 |
6.90 |
0.06 |
39,326 |
|
June 2002 |
6.04 |
0.04 |
28,905 |
|
July 2002 |
5.75 |
0.01 |
32,386 |
|
August 2002 |
5.72 |
0.01 |
32,269 |
|
September 2002 |
5.75 |
0.01 |
28,883 |
|
October 2002 |
5.73 |
0.01 |
30,469 |
|
November 2002 |
5.45 |
0.04 |
25,821 |
|
December 2002 |
5.58 |
0.03 |
24,305 |
|
January 2003 |
5.66 |
0.04 |
24,034 |
|
February 2003 |
5.71 |
0.06 |
20,682 |
|
March 2003 |
5.86 |
0.09 |
24,357 |
|
|
|
||||
CV: Coefficient of variation. |
||||
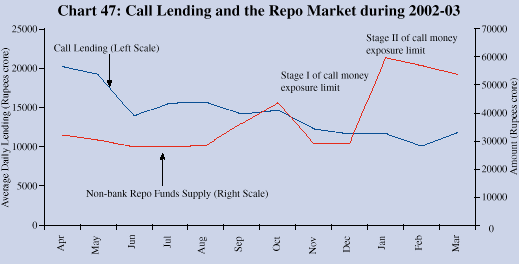
One of the factors facilitating the smooth progression of the banks towards reduction of call money exposures during 2002-03 was the increased supply of funds by the non-bank participants (i.e., non-banking financial institutions and mutual funds) in the repo market, especially during the two stages of implementation of prudential call money exposure limits for banks (Chart 47).
Comfortable liquidity conditions in the beginning of 2003-04 (up to April 21) drove down the weighted average call money borrowing rate to 4.80 per cent as on April 21, 2003, i.e., below the repo rate, from 6.01 per cent on April 1, 2003. The average daily call/notice money market turnover remained buoyant at around Rs. 17,365 crore during April 1-21, 2003.
Treasury Bills
The Treasury Bill segment of the money market reflected the underlying liquidity conditions as also interest rate expectations. Easy liquidity conditions in the beginning of 2002-03 elicited a keen response from market participants. Bid-cover ratios (competitive bid amount received to notified amount) touched 4.6 and 2.9 for the 91-day and 364-day Treasury Bills, respectively, during the first half of April 2002. The implicit 91-day cut-off yields touched sub-repo rate levels and 364-day Treasury Bills yields hovered marginally above the repo rate. Treasury Bills market mirrored the tightening of call money market conditions during the first half of May 2002; however, easing of monetary conditions softened the Treasury Bill yields which hovered close to the repo rate from July 2002 and occasionally strayed below (Chart 48).
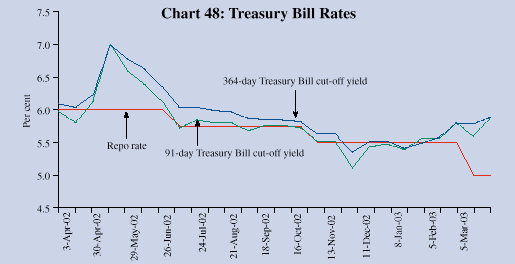
The lowering of Treasury Bill yields during the first three quarters of 2002-03 also reflected aggressive bidding by the market participants, particularly, the primary dealers, in order to meet bidding commitments and success ratios (Table 17).
Table 17 : Average Cut-off Yields of Treasury Bills @ |
||
(Per cent) |
||
|
|
||
Month |
91-day |
364-day |
Average Implicit Yield |
Average Implicit Yield |
|
at minimum cut-off Price |
at minimum cut-off Price |
|
|
|
||
1 |
2 |
3 |
|
|
||
March 2002 |
6.08 |
6.18 |
April 2002 |
5.94 |
6.12 |
May 2002 |
6.73 |
6.88 |
June 2002 |
6.31 |
6.49 |
July 2002 |
5.80 |
6.03 |
August 2002 |
5.79 |
5.98 |
September 2002 |
5.73 |
5.86 |
October 2002 |
5.70 |
5.76 |
November 2002 |
5.38 |
5.49 |
December 2002 |
5.39 |
5.51 |
January 2003 |
5.48 |
5.45 |
February 2003 |
5.72 |
5.69 |
March 2003 |
5.81 |
5.84 |
|
|
||
@ As per dates of auction. |
||
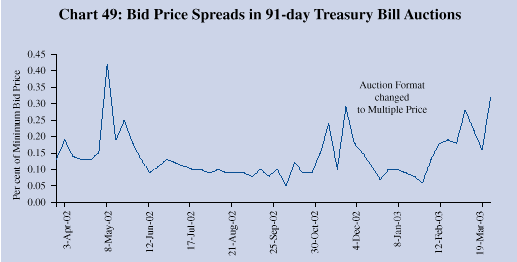
The spread indicator, measured by the differential between maximum and minimum bid prices, reflects the quality of bidding. With a view to correcting the distortions in the short end of the yield curve as also providing additional opportunity for deploying surplus funds to banks following the imposition of call money exposure restrictions, the notified amount of the 91-day Treasury Bill auction was enhanced from Rs.250 crore per auction to Rs.1,000 crore and the auction format was modified from uniform price to multiple price method from December 11, 2002. The narrowing of spreads reflected more restrained bidding (Chart 49). The liquidity conditions tightened since February 2003 and the notified amount was reduced to Rs.500 crore from February 5, 2003. The Treasury Bill yields firmed up during February and March 2003. The typical beginning-of-the-year flush of liquidity softened the 91-day and 364-day Treasury Bill yields to 5.06 per cent and 5.21 per cent, respectively, on April 16, 2003.
Other Money Market Instruments
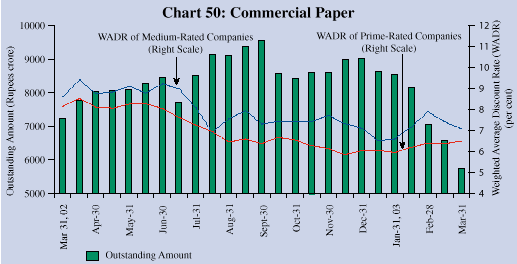
Comfortable liquidity conditions enabled a rise in the outstanding amount of commercial paper (CPs) from Rs.7,783 crore as on April 15, 2002 to Rs.8,645 crore on January 15, 2003 before declining to Rs.5,749 crore by March 31, 2003 (Chart 50). There was, however, a marginal decline in the cumulative flow of primary issuances of CPs during 2002-03 in relation to the preceding year. This reflected primarily a fall in primary issuances by the manufacturing companies. On the other hand, the primary issuances of leasing and finance companies and those of financial institutions moved up. The weighted average discount rate (WADR) of the CP softened to 6.5 per cent during the fortnight ended March 30, 2003 from 8.6 per cent during the fortnight ended April 15, 2002. The spread between the prime-rated and medium-rated companies narrowed from 89 basis points in mid-April 2002, to 59 basis points in end-March 2003.
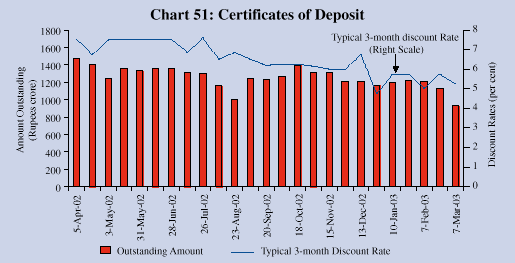
The outstanding amount of certificates of deposit (CDs) remained low reflecting comfortable liquidity conditions. The outstanding amount of CDs moved down to Rs.928 crore as on March 7, 2003 from Rs.1,474 crore as on April 5, 2002. The typical discount rate for 3 month CDs witnessed some softening during the second half of the year (Chart 51).
There was a sharp increase in the volume in Forward Rate Agreements (FRAs)/Interest Rate Swaps (IRS) market during the year. FRAs/IRS transactions, rose from 4,487 contracts amounting to Rs.88,814 crore as on April 5, 2002 to 9,412 contracts for Rs.2,44,161 crore by March 21, 2003. National Stock Exchange-Mumbai Inter-bank offered rate (NSE-MIBOR) and Mumbai Inter-bank forward offered rate (MIFOR) were used as the benchmark rates in a majority of these contracts. The other benchmark rates used include 3-month benchmark rate on Reuters, yield for 1-year government paper, primary cut-off yield on 364-day Treasury Bills, etc. Participation in the market continues to be confined to select foreign and private sector banks and a primary dealer.
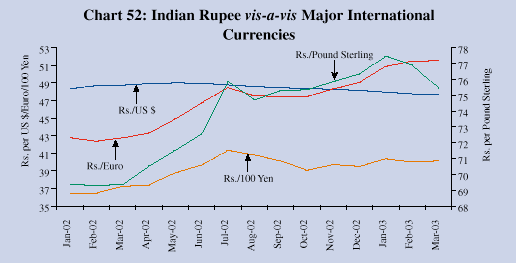
The foreign exchange market remained broadly stable during the first four months of 2002-03 interrupted by a brief period of uncertainty due to border tensions in May 2002. Over the remaining months, large inflows dominated market conditions. The exchange rate of the Rupee vis-a-vis the US dollar moved within a range of Rs.47.51-49.06 per US dollar during the year, appreciating by 2.7 per cent between April 2002 and March 2003. The exchange rate of the Rupee was Rs. 47.37 per US dollar on April 17, 2003.
The Rupee depreciated against the Euro, the Pound Sterling and the Yen primarily reflecting the depreciation of the US dollar against these currencies (Chart 52).
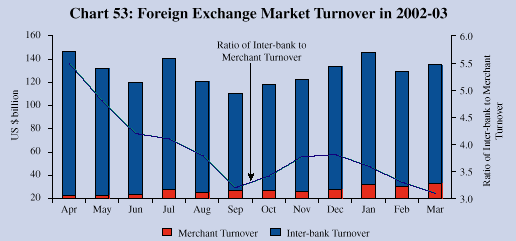
The average monthly turnover in the foreign exchange market increased to US $ 129.7 billion during 2002-03 from US $ 118.5 billion in 2001-02. The monthly turnover in the foreign exchange market moved within the range of US $ 22.5-33.2 billion in the merchant segment and between US dollar 84.1-124.3 billion in the inter-bank segment. The inter-bank to merchant turnover ratio, an indicator of market activity, fell steadily from 5.5 in April 2002 to 3.2 in September 2002 and moved in the range of 3.1-3.8 over the rest of the year (Chart 53).
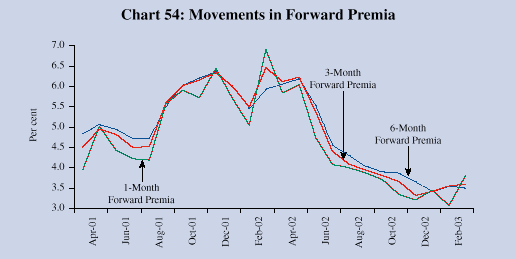
In the swap segment of the foreign exchange market, the forward premia hardened for all maturities during April-May 2002. With the return of stability in the spot segment of the foreign exchange market, the forward premia declined steadily during the following months (Chart 54). The one-month, the three-month and the six-month forward premia averaged 3.8 per cent, 3.6 per cent and 3.5 per cent, respectively, during March 2003 and fell further to 1.2 per cent, 1.5 per cent and 1.8 per cent, respectively, on April 22, 2003.
In view of easy liquidity conditions and lower market interest rates, public sector banks reduced one-year and above deposit rates from a range of 7.25-8.75 per cent in March 2002 to 5.25-7.00 per cent by March, 2003. Deposit rates of the private and foreign banks also eased. Comparable reductions were, however, not fully reflected in the prime lending rates (PLRs). Public sector banks (PSBs) reduced their maximum PLR by 25 basis points and the minimum PLR by 100 basis points during 2002-03. The maximum PLR charged by the private sector and foreign banks, however, generally remained unchanged. The minimum PLR in the foreign bank group was reduced by 225 basis points and by 300 basis points in the private bank group (Table 18). Deposit and lending rates of the various bank groups remained broadly unchanged in the first three weeks of April, 2003.
Table 18 : Movements in Deposit and Lending Rates |
|||||||||||
(Per cent) |
|||||||||||
|
|
|||||||||||
Interest Rates |
March |
June |
September |
December |
March |
||||||
2002 |
2002 |
2002 |
2002 |
2003 |
|||||||
|
|
|||||||||||
1 |
2 |
3 |
4 |
5 |
6 |
||||||
|
|
|||||||||||
1. |
Domestic Deposit Rates |
||||||||||
Public Sector Banks |
|||||||||||
a) Up to 1 year |
4.25 – 7.50 |
4.25-6.75 |
4.25-6.75 |
4.25-6.25 |
4.00-6.00 |
||||||
b) 1 year up to 3 years |
7.25 – 8.50 |
7.00-8.00 |
6.50-7.75 |
6.00-7.00 |
5.25-6.75 |
||||||
c) Over 3 years |
8.00 – 8.75 |
7.50-8.25 |
7.00-8.25 |
6.50-7.25 |
5.50-7.00 |
||||||
Private Sector Banks |
|||||||||||
a) Up to 1 year |
5.00 – 9.00 |
4.00-8.75 |
4.00-8.75 |
3.50-8.00 |
3.50-7.50 |
||||||
b) 1 year up to 3 years |
8.00 – 9.50 |
7.25-9.50 |
7.25-9.50 |
6.50-8.25 |
6.00-8.00 |
||||||
c) Over 3 years |
8.25 – 10.0 |
8.00-10.0 |
7.50-9.50 |
6.50-8.50 |
6.00-8.00 |
||||||
Foreign Banks |
|||||||||||
a) Up to 1 year |
4.25 – 9.75 |
4.25-9.75 |
4.00-9.75 |
3.25-7.75 |
3.00-7.75 |
||||||
b) 1 year up to 3 years |
6.25 – 10.0 |
6.25-10.0 |
5.50-10.0 |
4.50-8.00 |
4.10-8.00 |
||||||
c) Over 3 years |
6.25 – 10.0 |
6.25-10.0 |
5.50-10.0 |
4.75-8.50 |
4.75-8.00 |
||||||
2. |
Prime Lending Rates |
||||||||||
Public Sector Banks |
10.00–12.50 |
10.00-12.50 |
10.00-12.50 |
9.00-12.50 |
9.00-12.25 |
||||||
Private Sector Banks |
10.00–15.50 |
10.00-15.50 |
9.50-15.50 |
9.00-15.50 |
7.00-15.50 |
||||||
Foreign Banks |
9.00 –17.50 |
7.90-17.50 |
7.40-17.50 |
6.50-17.50 |
6.75-17.50 |
||||||
3. |
Actual Lending Rates* |
||||||||||
Public Sector Banks |
6.50-16.50 |
6.50-16.50 |
6.00-16.00 |
||||||||
Private Sector Banks |
N.A. |
5.00-19.75 |
5.00-19.75 |
5.00-19.75 |
N.A. |
||||||
Foreign Banks |
6.90-25.00 |
6.20-25.00 |
4.60-25.00 |
||||||||
|
|
|||||||||||
* Comprising lending rates on non-export demand and term loans above Rs.2 lakh excluding lending rates at the extreme 5 per cent on both sides. |
|||||||||||
Sub-PLR lending of the banking system (excluding exports, the bulk of which is at sub-PLR) constituted over one-third of total outstanding lending above Rs.2 lakh. The spreads around PLRs of public sector banks (excluding 5 per cent of the credit sanctioned at lending rates at the extreme 5 per cent on either side) for term loan ranged from (-) 3.3 per cent to 4.5 per cent for the quarter ended September 2002 and widened to (-)5.3 per cent to 4.5 per cent by December 2002.
Bank credit, net of the initial impact of mergers, accelerated during 2002-03 due to the expansion in non-food credit off-take. The expansion of non-food gross bank credit was mainly absorbed by medium- and large-scale industries. Housing and non-banking financial companies were the other sectors recording acceleration in credit off-take (Table 19).
Table 19 : Sectoral and Industry-wise Deployment of Gross Bank Credit of Scheduled Commercial Banks (Fiscal Year Variations) – Select Categories |
||||||||||||
(Rupees Crore) |
||||||||||||
|
|
||||||||||||
Sector/Industry |
2001-02 |
2002-03 |
||||||||||
(up to February) |
(up to February) |
|||||||||||
|
|
||||||||||||
Absolute |
Per cent |
Absolute |
Per cent |
|||||||||
|
|
||||||||||||
1 |
2 |
3 |
4 |
5 |
||||||||
|
|
||||||||||||
1. |
Priority sector |
14,550 |
9.4 |
19,548 |
11.2 |
|||||||
Agriculture |
6,074 |
11.7 |
7,424 |
12.2 |
||||||||
Small Scale |
-383 |
-0.7 |
2,119 |
3.7 |
||||||||
Others |
8,859 |
19.1 |
10,005 |
17.5 |
||||||||
2. |
Industry (Medium & Large) |
6,574 |
4.0 |
22,070 |
12.8 |
|||||||
Petroleum |
-2,335 |
-20.2 |
-1,331 |
-11.8 |
||||||||
Infrastructure |
2,852 |
25.1 |
5,466 |
36.9 |
||||||||
Cement |
223 |
5.8 |
804 |
19.0 |
||||||||
Cotton Textiles |
-1,607 |
-12.1 |
2,072 |
17.6 |
||||||||
Iron and Steel |
841 |
4.3 |
1,479 |
7.4 |
||||||||
Fertilisers |
163 |
3.1 |
479 |
8.8 |
||||||||
Gems and Jewellery |
-263 |
-4.0 |
1,219 |
18.9 |
||||||||
3. |
Housing |
5,457 |
33.8 |
9,974 |
44.6 |
|||||||
4. |
Non-banking financial companies |
1,447 |
18.5 |
2,914 |
30.2 |
|||||||
5. |
Wholesale Trade |
1,608 |
9.0 |
2,192 |
10.7 |
|||||||
6. |
Export Credit |
-3,353 |
-7.7 |
3,710 |
8.6 |
|||||||
|
|
||||||||||||
# Excluding investments in eligible securities. |
||||||||||||
Note : |
Data are provisional and relate to select scheduled commercial banks which account for about 90 per cent of bank credit of all scheduled commercial banks. |
|||||||||||
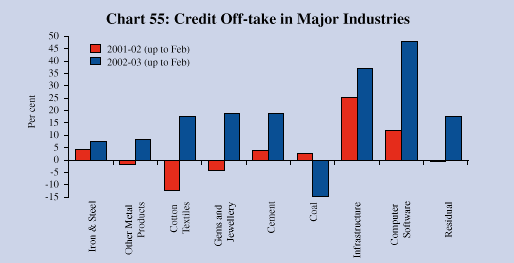
Higher credit off-take in the medium- and large-scale industries was on account of infrastructure (power, roads and port), iron and steel, cotton textiles, gems and jewellery, other metal products, paper and paper products, fertilisers, cement, computer software and drugs and pharmaceuticals. In the case of industries like coal, engineering, sugar, petroleum, tobacco and tobacco products, chemical, dyes and paints, etc., credit demand remained subdued (Chart 55).
The gilt market was propelled by rallies in the prices of government securities during the first three quarters of the year, fuelled by surplus liquidity (surplus of net demand and time liabilities available less statutory pre-emptions and credit off-take) with the banking system and expectations of periodic interest rate cuts (Chart 56). The decline in yields was halted only in mid-January 2003 due to selling pressure in the face of war fears. The escalation of war tensions in Iraq created market uncertainty, leading to a fall in the turnover.
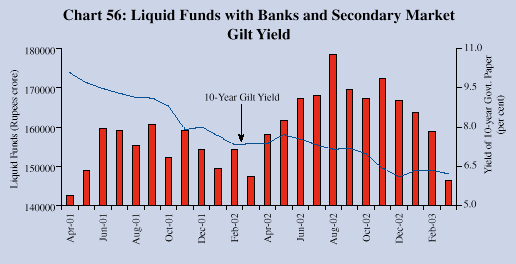
Comfortable liquidity conditions enabled the successful completion of the Centre’s borrowing programme, despite some overshooting. The total private placement of dated securities with the Reserve Bank amounted to Rs.23,175 crore (excluding private placement/devolvement to support prepayment of Government’s external debt) during 2002-03 with the Reserve Bank effectively neutralising the monetary effect by conduct of outright OMO sales of government securities amounting to Rs.53,780 crore. The announcement of core calendar for issuance of dated securities for the first and the second half of the year facilitated liquidity planning and enhanced transparency of the Central Government’s borrowing programme. Issuance of government paper with put and call options exercisable on or after five years in July 2002 and two 30-year government bonds in August and October 2002 provided additional flexibility to market participants. In order to facilitate easier access and wider participation, the facility to buy and sell government securities through stock exchanges was provided from January 16, 2003.
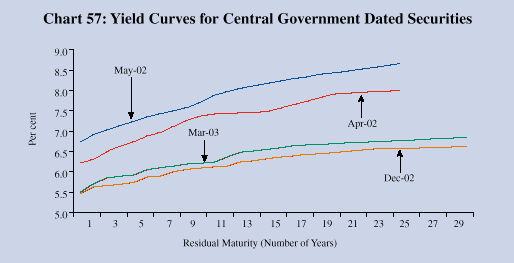
The weighted average yield on government borrowing through dated securities issued during 2002-03 declined by 210 basis points to 7.34 per cent from 9.44 per cent during 2001-02. Yields fell during the first week of April 2002 amidst the usual beginning-of-the-year easy liquidity conditions. The commencement of the government borrowing programme as well as open market sales turned the market sentiment cautious with a correction of yields of longer tenor paper. Gilt yields moved up and turnover fell in May 2002 until the Reserve Bank’s private placements of government securities relieved the liquidity stress (Chart 57). Monetary policy easing in June 2002 infused bullish sentiment in the market. The gilt yields fell continuously up to mid-January 2003, facilitated by a Bank Rate cut, another round of CRR and the repo rate reduction announced in October 2002. OMO sales as well as renewed tensions of war in the Middle-East in January 2003 halted the rally and the yields firmed up by end-January 2003. The turnover in the government securities market fell during the first three weeks of February 2003 reflecting uncertainty in the market conditions. The yields remained volatile during the month. The reduction in the administered interest rates on small savings in the Union Budget 2003-04, accompanied by repo rate and saving deposit rate reductions, reactivated the government securities market temporarily after the presentation of the Union Budget. Continuing uncertainty due to military action in Iraq and the usual end-of-the-year profit booking operations reversed most of the post-Budget gains and lowered the turnover in government securities market in March 2003.
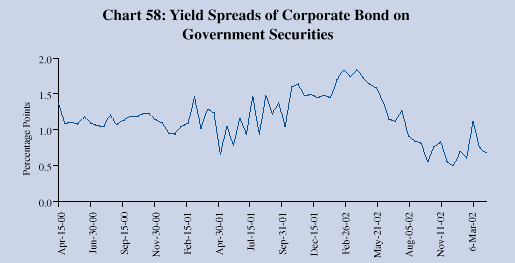
The decline in yields in the 2 to 5 year segment averaged around 60 basis points while in the 6 to 10 year and 11 to 20 year tenors the fall in yields was of the order of 102 and 115 basis points, respectively, on account of active trading interest in a period of low interest rates during 2002-03. On the other hand, the relative stability of the overnight call rates checked similar reductions in the yields of government securities of the shorter tenors. This resulted in flattening of the yield curve during the year. The spread between AAA-rated corporate bonds and government securities (5-year tenor) narrowed to 68 basis points in March 2003 from 173 basis points, a year ago (Chart 58).
An indicative calendar for issue of dated securities for the first half year of 2003-04 (April-September) was issued on March 31, 2003. Out of the gross borrowing requirement of Rs. 1,66,230 crore for the year 2003-04, Rs. 9,000 crore were raised through dated securities up to April 17, 2003 as compared with Rs. 7,000 crore during the corresponding period of the previous year. The sentiment in the secondary government securities market remained positive during April 2003 with easy liquidity conditions, the ebbing of war risks and softening of global oil prices. Yields for the 10-year paper fell by 23 basis points to 5.87 per cent by April 21, 2003.
Equity Market
The stock markets witnessed subdued conditions during 2002-03. The market sentiment was adversely affected, inter alia, by border tensions, an unsatisfactory monsoon and international uncertainties (Chart 59). International equity markets continued to decline during the year especially as extreme risk aversion followed the spate of accounting irregularities and financial restatements in the US.
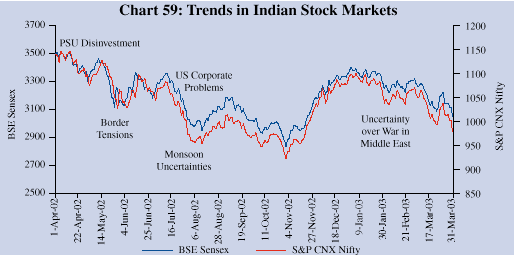
The domestic markets began the year on a positive note, led by a rally in scrips of Public Sector Undertakings (PSUs) with the announcement of disinvestment initiatives by the Government. Sentiment turned bearish by end-May 2002 as border tensions mounted and certain quarterly corporate performances did not meet market expectations. A recovery in early June 2002 with the easing of border tensions was dissipated by end-July 2002, reflecting monsoon uncertainties and a weakening of international markets following the discovery of accounting discrepancies in large US firms (Chart 60).
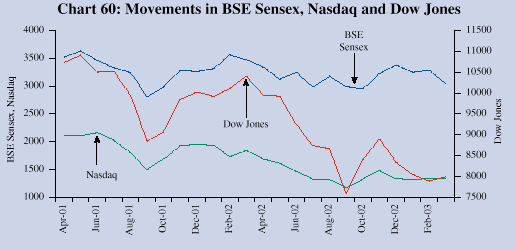
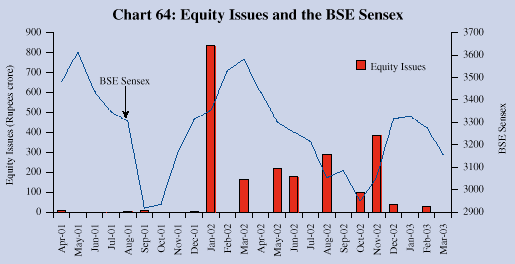
The markets declined again by October 2002 on account of lower than expected quarterly performances of corporates and continuing uncertainty regarding PSU disinvestments. With the revival of disinvestment initiatives, market sentiment turned positive by end-November 2002, aided by bargain buying by institutional investors especially in technology scrips, and revival in international markets. By end-January 2003, uncertainties in the Middle East and the possibility of oil prices hardening dampened markets again. The downtrend persisted for the rest of the year, reinforced by the reactions to the military action in Iraq. The BSE Sensex slipped below the 3000 mark to reach 2997 on April 21, 2003 following uncertainties regarding the performance of infotech scrips.
The average BSE Sensex at 3206 during 2002-03 was lower by 3.8 per cent than 3332 during the preceding year. The volatility in share prices, measured by the coefficient of variation, was lower (4.9 per cent) than in 2001-02 (7.3 per cent). There was a strong buying interest in mid-caps, especially PSU scrips, reflecting a defensive and diversified portfolio strategy in the face of market uncertainties. As a result, the BSE 500 recorded an increase of 10.6 per cent, on average basis, as against a decline of 3.8 per cent in the BSE Sensex. Bank scrips recorded a sharp increase in prices following improvement in profitability and relaxations in respect of foreign direct investment (FDI) in private sector banks. The average price-earning (P/E) ratio of the BSE Sensex scrips, at 14.5 during 2002-03, was lower than 16.6 during the preceding year. The market capitalisation of the BSE was also lower at Rs.5,72,198 crore as at end-March 2003 as compared with Rs.6,12,224 crore as at end-March 2002. The average monthly turnover of the BSE, at Rs.26,710 crore during 2002-03 (up to February), was comparable with Rs.25,598 crore during the corresponding period of the previous year. The settlement cycle was shortened to T+3 basis effective April 1, 2002 and further to T+2 basis, effective April 1, 2003 in line with the international best practices.
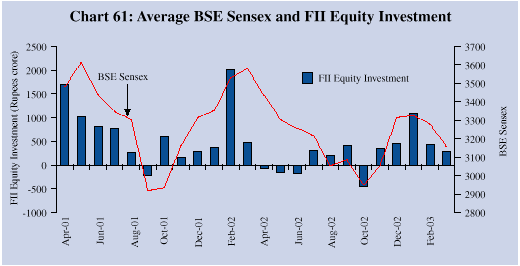
Net FII inflows in the equity markets declined to Rs.2,669 crore during 2002-03 from Rs.8,273 crore during the preceding year (Chart 61). Mutual funds remained net sellers in equity markets during 2002-03.
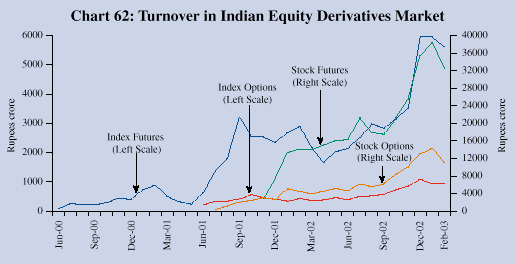
The derivative segment continued to expand with the total turnover in respect of all products rising to Rs.50,080 crore during February 2003 from Rs.20,535 crore during March 2002 (Chart 62).
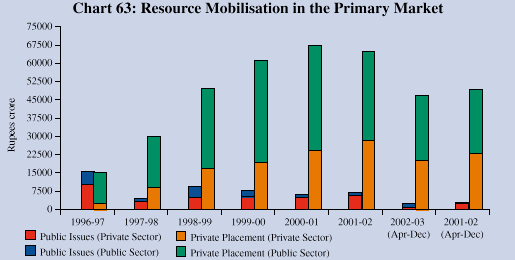
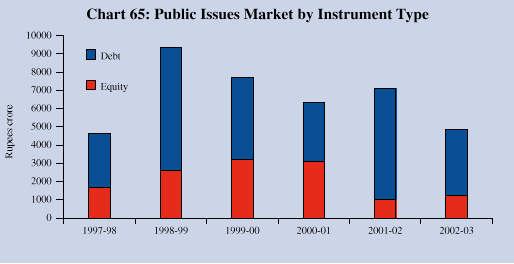
Resource mobilisation in the public issues market amounted to Rs.4,867 crore through 17 issues during 2002-03 as compared with Rs.7,112 crore raised through 24 issues during 2001-02 (Chart 63). The public sector entities accounted for a much higher share in resources mobilised than other participants.
The non-Government public limited companies (private sector) floated five equity issues aggregating Rs.460 crore during 2002-03 as compared with six equity issues aggregating Rs.860 crore during 2001-02. Three public sector banks floated equity issues aggregating Rs.773 crore during 2002-03 as compared with a single issue of Rs.165 crore during the previous year (Chart 64).
There were four debt issues from the private sector of Rs.1,418 crore during 2002-03 as compared with 13 issues aggregating Rs.4,832 crore during 2001-02. The public sector all-India financial institutions (AIFIs) came out with five bond issues aggregating Rs.2,216 crore during 2002-03 as compared with four bond issues of Rs.1,255 crore during the previous year (Chart 65).
There was a slowdown in resource mobilisation in the private placement market. Resources mobilised in the private placement market aggregated Rs.46,647 crore during April-December 2002, a decline of 5.6 per cent over Rs.49,437 crore mobilised during the corresponding period of the previous year (Chart 63).
There was an increase in resource mobilisation from the Euro issues market (in the form of ADRs, GDRs and FCCBs) as 11 issues aggregating Rs.3,426 crore (US $ 711 million) were floated during 2002-03 as compared with five issues aggregating Rs.2,385 crore (US $ 506 million) during the previous year.
The overall resource mobilisation by mutual funds (net sales), according to the SEBI, amounted to Rs.4,196 crore during 2002-03 registering a sharp decline of 41.5 per cent over the preceding year. The Unit Trust of India (UTI) recorded a net outflow of Rs.9,434 crore and resources raised by private sector mutual funds declined to Rs.12,069 crore while that of public sector improved somewhat to Rs.1,561 crore.
Financial assistance sanctioned and disbursed by the term-lending institutions during 2002-03, at Rs.22,901 crore and Rs.20,151 crore, respectively, declined sharply by 32.2 per cent and 33.6 per cent (excluding ICICI) as compared with decline of 37.2 per cent and 16.2 per cent, respectively, during 2001-02.
Insurance Market
The process of liberalisation of the insurance market continued during 2002-03 with the entry of a number of private insurers. The Insurance and Regulatory Development Authority (IRDA) registered one new life insurance company and three general insurance companies taking the total number of life insurers and general insurers both to 13. According to the IRDA, the life insurance business (in terms of premium) expanded by 38.9 per cent during 2001-02 as compared with 37.4 per cent a year ago. The general insurance business (in terms of gross direct premium income) increased by 26.3 per cent during 2001-02 as compared with 5.9 per cent during the previous year. All insurance companies observed the solvency margins set by the IRDA.


