The global financial markets witnessed further easing of pressures on the back of receding uncertainties and risk, and a strong rebound in activity in various market segments in Q3 of 2009, albeit, with persistence of weakness in credit and mortgage markets. The equity markets in both advanced economies and EMEs recovered a large part of losses incurred in the aftermath of the global crisis; bond markets turned to normalcy with pick up in global issuances; sovereign and corporate - financial and non-financial - credit spreads declined further. The domestic financial markets continued to function normally and also witnessed further moderation in risk premia in Q2 of 2009-10, besides significant improvement in market activity. While the money markets continued to reflect the impact of ample liquidity and lower policy rates, the long term government bond yields reflected concerns about government borrowing programme. The rupee witnessed appreciating trend against the US dollar, reflecting in part the impact of revival in capital inflows and the general weakness of the US dollar against major currencies. While the secondary equity market continued to outperform most other EMEs, the primary market witnessed strong resumption of activity in terms of primary issuances, private placements and mobilisation of resources by the mutual funds.
V.1 The global financial markets further extended the steady improvement in Q3 of 2009 that had started in Q2, with significant reduction in liquidity and credit risk across asset classes, though some segments in the credit and mortgage markets still remain weak. Alongside easing of stress in the global market conditions, the domestic financial markets also witnessed further decline of risk premia and significant recovery in asset prices – extending the pattern that had started in Q1 of 2009-10. A combination of factors such as improving market perception about the growth outlook, ample liquidity in the system and continuance of low policy rates facilitated overall easing of the market conditions. Notwithstanding the gradual moderation in lending rates, indicating improved transmission of monetary policy with a lag, there was further moderation in credit growth. The equity markets, apart from recovery in prices, also exhibited substantial improvement in activity in the primary market with higher momentum in IPOs, private placements and mobilisation of resources by the mutual funds.
International Financial Markets
V.2 The global financial markets had witnessed signs of stabilisation in Q2 of 2009, with strong rebound in activity in some of the market segments on the back of incipient signs of slowdown in the pace of deterioration of economic conditions in the advanced economies, better than expected corporate performance and confidence building measures taken by the governments and central banks. The financial markets showed further improvement in Q3 of 2009 with increasing risk tolerance and receding risk premia on various asset classes. According to the BIS Quarterly Review (September 2009), while in interbank money markets key spreads narrowed to levels not seen since the beginning of 2008, improvements were also evident in credit markets, although important segments continued to rely on central bank support.
V.3 The easing of pressures in money markets in Q3 of 2009 was evident from the significant and sustained moderation in interbank rates from the peak seen during the early phase of the global crisis (Chart V.1a). The bonds market also mirrored the receding liquidity premia and return of risk appetite. However, government bond yields witnessed some intermittent volatility due to factors such as fluctuating perceptions about the future path of global recovery and the expected reversal in the stance of monetary policies. The long-term government bond yields, which rose in the first two quarters of 2009 on concerns of rising fiscal deficits, did witness signs of stabilisation in Q3 of 2009 upon changing outlook regarding macroeconomic conditions and fiscal and monetary policies (Chart V.1b). Furthermore, the steepening of yield curve witnessed in the first two quarters was not so evident during Q3 of 2009. However, the long-term bond yield in the US continued to reflect the consequences of large government debt and borrowing programme.
V.4 The equity markets in developed as well as EMEs have witnessed perceptible recovery and reduced volatility since March 2009, with intermittent corrections in response to specific adverse news/ perceptions (Chart V.1c, d and e). In Q3 of 2009, the pace of recovery of global equity prices accelerated further and displayed a more firm pattern. Both Dow Jones and NASDAQ equity indices recorded around 16 per cent rise during Q3 of 2009 over the preceding quarter. Thus, the markets have been able to recoup a part of the household wealth lost in the aftermath of the financial crisis. Although equity markets rallied on better than expected economic data and corporate earnings results for Q2 of 2009 with financial sector showing significant improvement, and upward shift in the earnings expectations, there were episodes of intermittent volatility caused by investors’ reaction to any negative news relating to the pace of economic recovery. Furthermore, concerns on the quality and sustainability of the financial sector profitability continue to worry the markets, as evident from the still relatively higher credit default swap spreads for the banks and the insurance sector (Chart V.1f).
V.5 Both sovereign and corporate (financial and non-financial) credit spreads narrowed further, indicating significant drop in risk and liquidity premiums (Chart V.1g, h and i). The improvement in credit market conditions was also evident in the high level of global corporate bond issuances, although there was at the same time deleveraging by the banks. Furthermore, in the US, while there were signs of recovery in the commercial paper (CP) market, asset backed securities (ABS) and commercial mortgage backed securities (CMBS) markets continued to mirror weak sentiments. Lower risk spread and improved market liquidity helped in lifting the pace of domestic as well as international bond issuances by the corporates.
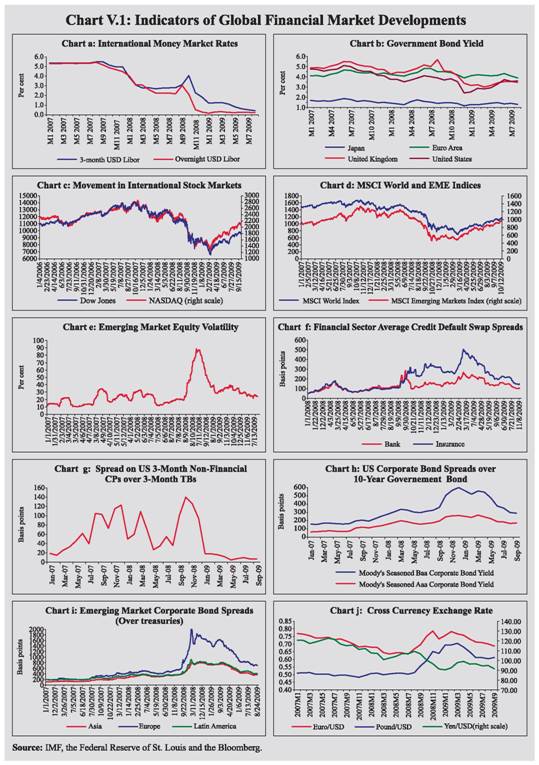 V.6 EME equity markets reflected investors’ increasing risk tolerance which continued to support asset prices (Chart V.1d). The resumption of capital flows to EMEs and return of investors’ risk appetite, bolstered by the strong recovery and rebound in domestic consumption demand in Asia, incipient recovery in commodity exporting countries in Latin America and the Middle East, led to further acceleration in growth of equity prices in Q3 of 2009. The Morgan Stanley Capital International (MSCI) index increased by 17.4 per cent during the Q3 of 2009, although the pace of increase in equity prices differed across EMEs depending on the domestic factors (Table 5.1). Between mid-September 2009 and end-March 2009, MSCI increased by 56.9 per cent.
V.7 In the foreign exchange market, the US dollar which depreciated in the first quarter of 2009-10, continued to depreciate during the second quarter on the back of declining flows to the US, continuation of easy monetary policy in the US and change in market sentiment against the dollar (Chart V.1j). Between end-March 2009 and October 20, 2009, the US dollar depreciated by 11.1 per cent against the euro, 12.6 per cent against the pound sterling and 7.8 per cent against the Japanese yen. The EME currencies witnessed appreciating trend in Q3 of 2009, reflecting in part their relative attractiveness to foreign investors for higher yields. Coming to Asian currencies, the US dollar depreciated against Indian rupee, Indonesian rupiah, Malaysian ringgit, South Korean won and Thai Baht. Among other emerging market currencies, the US dollar registered significant depreciation against South African Rand, Brazilian real, Mexican peso, Turkish lira and Russian ruble. However, it appreciated against the Argentine peso during the period (Table 5.1).
Table 5.1 : Currency and Stock Price Movement in EMEs |
(Per cent) |
Items |
End-March 08 @ |
End-March 09 @ |
October 20, 2009* |
Items |
End- March 08 @ |
End-March 09 @ |
October 12, 2009* |
1 |
2 |
3 |
4 |
1 |
5 |
6 |
7 |
Appreciation (+)/Depreciation (-) of the US Dollar |
Stock Price Variations |
Japanese Yen |
-14.9 |
-2.0 |
-7.8 |
Indonesia |
33.7 |
71.3 |
67.2 |
Chinese Yuan |
-9.3 |
-2.6 |
-0.1 |
(Jakarta Composite) |
|
|
|
Russian Ruble |
-9.7 |
44.3 |
-13.9 |
Brazil (Bovespa)** |
33.1 |
56.6 |
47.5 |
Turkish Lira |
-5.8 |
27.7 |
-13.3 |
Thailand (SET Composite) |
21.3 |
74.2 |
67.2 |
Indian Rupee |
-8.3 |
27.5 |
-9.6 |
India (BSE Sensex) |
19.7 |
75.4 |
71.9 |
Indonesian Rupiah |
1.1 |
25.6 |
-19.1 |
South Korea (KOSPI) |
17.3 |
35.9 |
40.2 |
Malaysian Ringgit |
-7.8 |
14.4 |
-7.9 |
China |
9.1 |
22.0 |
19.6 |
South Korea Won |
5.5 |
38.9 |
-14.6 |
(Shanghai SE Composite) |
|
|
|
Thai Baht |
-10.2 |
12.9 |
-5.8 |
Taiwan (Taiwan Index) |
8.7 |
45.9 |
41.0 |
Argentina |
2.1 |
17.3 |
2.9 |
Russia (RTS) |
6.1 |
107.1 |
77.7 |
Brazilian Real |
-17.0 |
31.2 |
-23.4 |
Malaysia (KLSE Composite) |
0.1 |
41.9 |
39.5 |
Mexican Peso |
-3.5 |
32.9 |
-8.6 |
Singapore (Straits Times) |
-4.9 |
57.7 |
56.6 |
@ : Year-on-year variation. * : Variation over end-March 2009. ** : Data as on October 09, 2009.
Source: Bloomberg and the IFS, IMF. |
Domestic Financial Markets
V.8 All through the crisis, financial markets in India continued to function normally. However, financial market conditions tightened in sympathy with the international markets and this was reflected in the large credit spreads and higher liquidity premia. However, the financial markets recovered from this sooner than their counterparts elsewhere, with some indications of risk perception and volumes returning to the pre-Lehman levels. The domestic markets recorded further improvement in Q2 of 2009-10, with external financial environment turning more favourable. The call rate in the money market remained within the informal LAF corridor, while volumes increased, indicating declining risk and liquidity premia. In the foreign exchange market, the Indian rupee generally appreciated against major currencies as the appetite for EME assets rose and capital flows gained further momentum. In the credit market, the lending rates of scheduled commercial banks (SCBs) further softened, although concerns remained regarding the pace of pick up in bank credit. The activity in the government securities market further picked up in Q2 of 2009-10 as 69.3 per cent of the Government’s gross market borrowing programme was completed by the end of September. Ample liquidity conditions ensured by the Reserve Bank and high growth in bank deposits in the face of subdued growth in credit to private sector continued to contain pressure on bond yields. Indian equity markets outperformed most of the EMEs.
Liquidity conditions
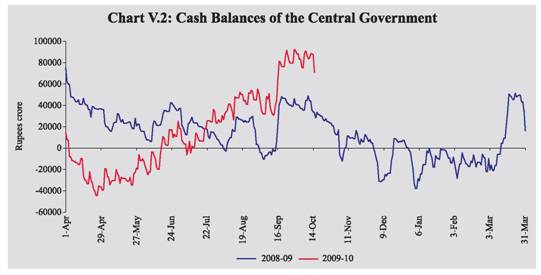
V.9 The Reserve Bank carried forward its stance of maintaining ample liquidity in the system in Q2 of 2009-10, which was reflected in the average reverse repo balances on daily basis with the Reserve Bank increasing to about Rs.1,26,811 crore in Q2 from Rs.1,16,993 crore in Q1 of 2009-10 (Table 5.2). As against a steep decline in cash balances of the Central Government with the Reserve Bank in Q1 of 2009-10, there was a large build up of cash balances in Q2, mainly reflecting market borrowings of the Central Government and surplus transfer by the Reserve Bank (Chart V.2). The Reserve Bank, as against its intention to purchase government securities amounting to Rs.80,000 crore under the Open Market Operation (OMO) programme for the first half of 2009-10, purchased securities through the auction route amounting to Rs.57,487 crore up to end-September 2009.
Table 5.2: Domestic Financial Markets at a Glance |
Year/ Month |
Call Money |
Government Securities |
Foreign Exchange |
Liquidity Management |
Equity |
Average Daily Turnover (Rs. crore) |
Average Call Rates* (Per cent) |
Average Turnover in Govt. Securities (Rs. crore)+ |
Aver age 10-Year Yield@ (Per cent) |
Average Daily Interbank Turnover (US$ million) |
Average Exchange Rate (Rs. per US$) |
RBI’s Net Foreign Currency Sales (-)/ Purchases (+) (US$ million) |
Average MSS Out-standing# (Rs. crore) |
Average Daily Reverse Repo (LAF) Outstanding (Rs. crore) |
Average Daily BSE Turnover (Rs. crore) |
Average Daily NSE Turnover (Rs. crore) |
Average BSE Sensex** |
Average S&P CNX Nifty** |
1 |
2 |
3 |
4 |
5 |
6 |
7 |
8 |
9 |
10 |
11 |
12 |
13 |
14 |
2006-07 |
21,725 |
7.22 |
4,863 |
7.78 |
18,540 |
45.28 |
26,824^ |
37,698 |
21,973 |
3,866 |
7,812 |
12277 |
3572 |
2007-08 |
21,393 |
6.07 |
8,104 |
7.91 |
34,044 |
40.24 |
78,203^ |
1,28,684 |
4,677 |
6,275 |
14,148 |
16569 |
4897 |
2008-09 |
22436 |
7.06 |
10,879 |
7.54 |
34,712 |
45.92 |
-2,910^ |
1,48,889 |
2,885 |
4,498 |
11,272 |
12303 |
3713 |
2008 |
|
|
|
|
|
|
|
|
|
|
|
|
|
Apr |
19,516 |
6.11 |
6,657 |
8.10 |
37,580 |
40.02 |
4,325 |
1,70,726 |
26,359 |
5,773 |
13,561 |
16291 |
4902 |
May |
19,481 |
6.62 |
8,780 |
8.04 |
32,287 |
42.13 |
148 |
1,75,565 |
11,841 |
6,084 |
13,896 |
16946 |
5029 |
Jun |
21,707 |
7.75 |
6,835 |
8.43 |
38,330 |
42.82 |
-5,229 |
1,74,433 |
-8,622 |
5,410 |
12,592 |
14997 |
4464 |
Jul |
24,736 |
8.76 |
5,474 |
9.18 |
37,173 |
42.84 |
-6,320 |
1,72,169 |
-27,961 |
5,388 |
12,862 |
13716 |
4125 |
Aug |
23,408 |
9.1 |
7,498 |
9.06 |
38,388 |
42.94 |
1,210 |
1,71,944 |
-22,560 |
4,996 |
11,713 |
14722 |
4417 |
Sep |
23,379 |
10.52 |
10,418 |
8.45 |
44,700 |
45.56 |
-3,784 |
1,75,666 |
-42,591 |
5,147 |
12,489 |
13943 |
4207 |
Oct |
28,995 |
9.9 |
8,641 |
7.85 |
36,999 |
48.66 |
-18,666 |
1,69,123 |
-45,612 |
3,911 |
10,810 |
10550 |
3210 |
Nov |
21,812 |
7.57 |
11,732 |
7.41 |
31,322 |
49.00 |
-3,101 |
1,47,648 |
-8,017 |
3,539 |
9,618 |
9454 |
2835 |
Dec |
21,641 |
5.92 |
22,903 |
5.88 |
34,874 |
48.63 |
-318 |
1,24,848 |
22,294 |
3,851 |
10,141 |
9514 |
2896 |
2009 |
|
|
|
|
|
|
|
|
|
|
|
|
|
Jan |
18,496 |
4.18 |
19,136 |
5.84 |
27,895 |
48.83 |
-29 |
1,13,535 |
45,474 |
3,526 |
9,559 |
9350 |
2854 |
Feb |
22,241 |
4.16 |
11,831 |
5.98 |
25,068 |
49.26 |
230 |
1,02,934 |
50,649 |
2,859 |
7,887 |
9188 |
2819 |
Mar |
23,818 |
4.17 |
10,644 |
6.59 |
33,126 |
51.23 |
-3,388 |
88,077 |
33,360 |
3,489 |
10,140 |
8966 |
2802 |
Apr |
21,820 |
3.28 |
15,997 |
6.55 |
27,796 |
50..06 |
-2,487 |
75,146 |
1,01,561 |
5,232 |
15,688 |
10911 |
3360 |
May |
19,037 |
3.17 |
14,585 |
6.41 |
32,227 |
48.53 |
-1,437 |
45,955 |
1,25,728 |
6,427 |
19,128 |
13046 |
3958 |
Jun |
17,921 |
3.21 |
14,575 |
6.83 |
32,431 |
47.77 |
1,044 |
27,140 |
1,23,400 |
7,236 |
21,928 |
14782 |
4436 |
Jul |
14,394 |
3.21 |
17,739 |
7.01 |
30,396 |
48.48 |
-55 |
22,159 |
1,30,891 |
6,043 |
18,528 |
14635 |
4343 |
Aug |
15,137 |
3.22 |
9,699 |
7.18 |
27,284 |
48.34 |
181 |
19,804 |
1,28,275 |
5,825 |
17,379 |
15415 |
4571 |
Sep |
16,118 |
3.31 |
16,988 |
7.26 |
27,574 |
48.41 |
- |
18,773 |
1,21,548 |
6,211 |
18,253 |
16338 |
4859 |
* : Average of daily weighted call money borrowing rates. + : Average of daily outright turnover in Central Government dated securities.
@ : Average of daily closing rates. # : Average of weekly outstanding MSS.
** : Average of daily closing indices. ^ : Cumulative for the financial year.
LAF : Liquidity Adjustment Facility. MSS : Market Stabilisation Scheme. BSE: Bombay Stock Exchange Limited.
NSE : National Stock Exchange of India Limited. – : Not available.
Note: In column 10, (-) indicates injection of liquidity, while (+) indicates absorption of liquidity. |
Cash Management of the Government
V.10 During Q1 of 2009-10, the Central Government took recourse to ways and means advances (WMA) and overdrafts (OD) on several occasions (Table 5.3). The cash balances turned positive on June 16, 2009 on account of the quarterly advance tax inflows and remained so almost throughout Q2 of 2009-10. The surplus cash balance increased from Rs.18,527 crore as at end-June 2009 to Rs.91,410 crore as at end-September 2009,buoyed by the improvement in tax revenue (direct as well as indirect) collections, increase in surplus transfer from the Reserve Bank and increased quantum of market borrowings. The surplus cash balance moderated to Rs.69,554 crore as on October 20, 2009.
 Liquidity Management
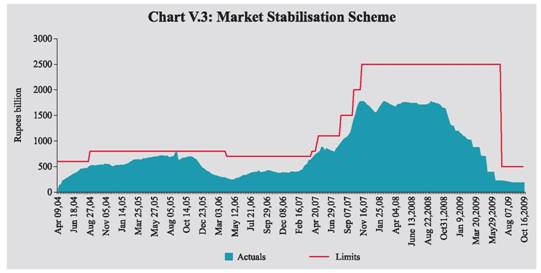
V.11 Liquidity conditions eased further during Q2 of 2009-10 with the average daily absorption under the LAF remaining high. The daily absorption under LAF which had peaked on September 4, 2009, however, moderated somewhat during the second-half of September 2009, reflecting significant outflows on account of advance tax payments (Table 5.4). The easing of liquidity conditions in the banking system in Q2, despite an increase in the cash balances of the Central Government, mainly reflected MSS unwinding (Rs.4,500 crore) and OMO auction-based purchases (Rs.29,298 crore). During 2009-10 (up to September 2009), MSS unwinding at Rs.70,000 crore (de-sequestering of Rs.28,000crore) was used as a key instrument of liquidity management (Chart V.3).
Table 5.3: Cash Management of theCentral Government |
| |
2007-08 |
2008-09 |
Up to end - September |
2008-09 |
2009-10 |
1 |
2 |
3 |
4 |
5 |
Number of Days |
|
|
|
|
WMA @ |
91 |
109 |
16 |
76 |
OD |
37 |
65 |
- |
44 |
Cash Deficit |
91 |
109 |
16 |
76 |
Average Utilisation (Rupees crore) |
|
|
|
|
WMA |
3,605 |
2,077 |
371 |
6,194 |
OD |
645 |
1,823 |
- |
2,309 |
@ : Includes days of OD. |
V.12 The significantly reduced rupee liquidity needs of the banking system were also evident from the fact that the special term repo facility has not been availed continuously since August 17, 2009. In view of the ample liquidity conditions, the term repo auctions which were being conducted on a daily basis since October 14, 2008 are now being conducted on a weekly basis since April 27, 2009. Furthermore, the outstanding under the forex swap facility, which was instituted to provide forex liquidity to Indian banks having foreign branches or subsidiaries, also declined to Rs.240 crore at end-September 2009 from Rs.595 crore as at end-June 2009. The tenure of the term repo and the forex swap facilities, which have been extended from time to time, is up to end-March 2010. The surplus cash balances of the centre emerged as the key drivers of liquidity conditions in Q2 of 2009-10 (Table 5.5).
Table 5.4: Liquidity Position |
(Rupees crore) |
Outstanding as on Last Friday |
LAF |
MSS |
Centre’s Surplus with the RBI @ |
Total (2 to 4) |
Outstanding as on Last Friday |
LAF |
MSS |
Centre’s Surplus with the RBI @ |
Total (2 to 4) |
1 |
2 |
3 |
4 |
5 |
1 |
6 |
7 |
8 |
9 |
2008 |
|
|
|
|
2009 |
|
|
|
|
January |
985 |
1,66,739 |
70,657 |
2,38,381 |
January |
54,605 |
1,08,764 |
-9,166 |
1,54,203 |
February |
8,085 |
1,75,089 |
68,538 |
2,51,712 |
February |
59,820 |
1,01,991 |
-9,603 |
1,52,208 |
March* |
-50,350 |
1,68,392 |
76,586 |
1,94,628 |
March* |
1,485 |
88,077 |
16,219 |
1,05,781 |
April |
32,765 |
1,72,444 |
36,549 |
2,41,758 |
April |
1,08,430 |
70,216 |
-40,412 |
1,38,234 |
May |
-9,600 |
1,75,362 |
17,102 |
1,82,864 |
May |
1,10,685 |
39,890 |
-6,114 |
1,44,461 |
June |
-32,090 |
1,74,433 |
36,513 |
1,78,856 |
June |
1,31,505 |
22,890 |
12,837 |
1,67,232 |
July |
-43,260 |
1,71,327 |
15,043 |
1,43,110 |
July |
1,39,690 |
21,063 |
26,440 |
1,87,193 |
August |
-7,600 |
1,73,658 |
17,393 |
1,83,451 |
August |
1,53,795 |
18,773 |
45,127 |
2,17,695 |
September |
-56,480 |
1,73,804 |
40,358 |
1,57,682 |
September |
1,06,115 |
18,773 |
80,775 |
2,05,663 |
October |
-73,590 |
1,65,187 |
14,383 |
1,05,980 |
October 16 |
76,260 |
18,773 |
61,343 |
1,56,376 |
November |
-9,880 |
1,32,531 |
7,981 |
1,30,632 |
|
|
|
|
|
December |
14,630 |
1,20,050 |
3,804 |
1,38,484 |
|
|
|
|
|
@ : Excludes minimum cash balances with the Reserve Bank in case of surplus.
* : Data pertain to March 31.
Note : 1. Negative sign in column 2 indicates injection of liquidity through LAF.
2. The Second LAF, conducted on a daily basis from September 17, 2008 to May 5, 2009 is being conducted only on
reporting Fridays from May 8, 2009.
3.Negative sign in column 4 indicates injection of liquidity through WMA/OD. |
 Money Market
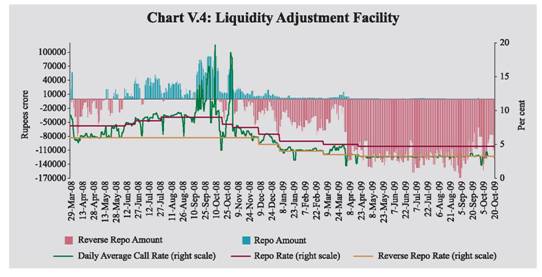
V.13 The money market continued to remain orderly during Q2 of 2009-10. Reflecting the surplus liquidity conditions, the call rate hovered around the lower bound of the informal LAF corridor during the Q2 of 2009-10 (Chart V.4). The call rate averaged 3.25 per cent in Q2, which was marginally higher than 3.22 per cent in Q1.
V.14 Interest rates in the collateralised segments of the money market – the market repo (outside the LAF) and the collateralised borrowing and lending obligation (CBLO) – moved in tandem with the call rate during Q2 but remained below the call rate (Chart V.5). The weighted average interest rate in the collateralised segment of the money market marginally increased to 2.7 per cent during Q2 of 2009-10 from 2.4 per cent during Q1. Transaction volumes in CBLO and market repo segments continued to remain high during Q2 of 2009-10 reflecting the easy liquidity and active market conditions (Table 5.6). Banks as a group are the major borrowers in the collateralised segment whereas mutual funds (MFs) continue to remain the single largest lender of funds in that segment. In fact, more than 75 per cent of the lending in the collateralised segment was contributed by the MFs in Q2, reflecting their continued enhanced lending capacity. The collateralised market remained the predominant segment of the money market, accounting for more than 80 per cent of the total volume in the money market in Q2.
Table 5.5: Reserve Bank’s Liquidity Management Operations |
(Rupees crore) |
Item
|
2008-09 Apr-Mar
|
2008-09 |
2009-10 |
Q1 |
Q2 |
Q3 |
Q4 |
Q1 |
July |
Aug |
1 |
2 |
3 |
4 |
5 |
6 |
7 |
8 |
9 |
A. |
Drivers of Liquidity (1+2+3+4) |
-1,67,708 |
6,061 |
-18,851 |
-1,01,278 |
-53,640 |
-44,599 |
1,237 |
-57 |
1. |
RBI’s net Purchase from Authorised Dealers |
-1,78,592 |
-8,555 |
-40,249 |
-1,12,168 |
-17,620 |
-15,874 |
1,665 |
-176 |
2. |
Currency with the Public |
-97,921 |
-30,063 |
12,360 |
-40,070 |
-40,147 |
-18,178 |
8,219 |
-3,197 |
3. |
a. Surplus Cash balances of the Centre with the Reserve Bank |
60,367 |
40,073 |
-3,845 |
36,554 |
-12,415 |
3,382 |
-13,603 |
-18,686 |
3. |
b. WMA and OD |
0 |
0 |
0 |
0 |
0 |
0 |
0 |
0 |
4. |
Others (residual) |
48,438 |
4,606 |
12,884 |
14,406 |
16,542 |
-13,929 |
4,956 |
22,003 |
B. |
Management of Liquidity (5+6+7+8) |
2,35,209 |
-37,659 |
7,217 |
1,33,325 |
1,32,326 |
-21,674 |
-317 |
492 |
5. |
Liquidity impact of LAF Repos |
-51,835 |
-18,260 |
24,390 |
-71,110 |
13,145 |
-1,30,020 |
-8,185 |
-14,105 |
6. |
Liquidity impact of OMO (net) * |
104,480 |
14,642 |
11,949 |
10,681 |
67,208 |
43,159 |
6,040 |
12,307 |
7. |
Liquidity impact of MSS |
80,314 |
-6,041 |
628 |
53,754 |
31,973 |
65,187 |
1,827 |
2,290 |
8. |
First round liquidity impact due to CRR change |
1,02,250 |
-28,000 |
-29,750 |
1,40,000 |
20,000 |
- |
- |
- |
C. |
Bank Reserves # (A+B) |
67,501 |
-31,598 |
-11,634 |
32,047 |
78,686 |
-66,273 |
920 |
435 |
(+) : Indicates injection of liquidity into the banking system.
(-) : Indicates absorption of liquidity from the banking system.
* : Includes oil bonds but excludes purchases of government securities on behalf of State Governments.
# : Includes vault cash with banks and adjusted for first round liquidity impact due to CRR change.
Note : Data pertain to March 31 and last Friday for all other months. |
 V.15 There has been some circularity in the movement of funds between MFs and banks. Banks invest a part of their resources in MFs. The MFs also lend funds to banks through CBLO and market repo. For instance, in Q2 of 2009-10, almost over 50 per cent of the banks’ investment in MFs was in turn lent to banks by the MFs in the collateralised segments (Table 5.7).
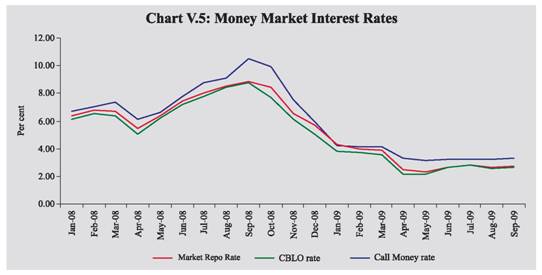
Table 5.6: Activity in Money Market Segments |
(Rupees crore) |
Year/Month |
Average Daily Volume (One Leg) |
Commercial Paper |
Certificates of Deposit |
Call |
Market Repo |
CBLO |
Total (2+3+4) |
Money Market Rate* (per cent) |
Term Money Market |
Out-standing |
WADR (Per cent) |
Outstanding |
WADR (Per cent) |
1 |
2 |
3 |
4 |
5 |
6 |
7 |
8 |
9 |
10 |
11 |
2008-09 |
|
|
|
|
|
|
|
|
|
|
April |
9,758 |
14,966 |
38,828 |
63,552 |
5.31 |
374 |
37,584 |
8.85 |
1,50,865 |
8.49 |
May |
9,740 |
14,729 |
36,326 |
60,795 |
6.29 |
420 |
42,032 |
9.02 |
1,56,780 |
8.95 |
June |
10,854 |
11,262 |
35,774 |
57,890 |
7.35 |
253 |
46,847 |
10.03 |
1,63,143 |
9.16 |
July |
12,368 |
8,591 |
23,669 |
44,628 |
8.09 |
226 |
51,569 |
10.95 |
1,64,892 |
10.23 |
August |
11,704 |
10,454 |
22,110 |
44,268 |
8.65 |
501 |
55,036 |
11.48 |
1,71,966 |
10.98 |
September |
11,690 |
10,654 |
20,547 |
42,891 |
9.26 |
335 |
52,038 |
12.28 |
1,75,522 |
11.56 |
October |
14,497 |
9,591 |
16,818 |
40,906 |
8.66 |
345 |
48,442 |
14.17 |
1,58,562 |
10.00 |
November |
10,906 |
15,191 |
24,379 |
50,476 |
6.58 |
319 |
44,487 |
12.42 |
1,51,493 |
10.36 |
December |
10,820 |
16,943 |
32,261 |
60,024 |
5.37 |
415 |
40,391 |
10.70 |
1,51,214 |
8.85 |
January |
9,248 |
18,053 |
31,794 |
59,095 |
3.99 |
454 |
51,668 |
9.48 |
1,64,979 |
7.33 |
February |
11,121 |
19,929 |
38,484 |
69,534 |
3.89 |
669 |
52,560 |
8.93 |
1,75,057 |
6.73 |
March |
11,909 |
21,593 |
48,319 |
81,821 |
3.76 |
451 |
44,171 |
9.79 |
1,92,867 |
7.53 |
2009-10 |
|
|
|
|
|
|
|
|
|
|
April |
10,910 |
20,545 |
43,958 |
75,413 |
2.41 |
332 |
52,881 |
6.29 |
2,10,954 |
6.48 |
May |
9,518 |
22,449 |
48,505 |
80,472 |
2.34 |
338 |
60,740 |
5.75 |
2,18,437 |
6.20 |
June |
8,960 |
21,694 |
53,553 |
84,207 |
2.69 |
335 |
68,721 |
5.00 |
2,21,491 |
4.90 |
July |
7,197 |
20,254 |
46,501 |
73,952 |
2.83 |
389 |
79,582 |
4.71 |
2,40,395 |
4.96 |
August |
7,569 |
23,305 |
57,099 |
87,973 |
2.62 |
461 |
83,026 |
5.05 |
2,32,522 |
4.91 |
September |
8,059 |
27,978 |
62,388 |
98,425 |
2.73 |
381 |
88,161 + |
4.96 + |
– |
- |
* : Weighted average rate of call, market repo and CBLO.
+ : As on September 15, 2009. WADR: Weighted average discount rate. |
Table 5.7: Movement of Funds between Banks and Mutual Funds |
(Rupees crore) |
Reporting Friday |
MF Lending |
Banks’ Outstanding Investment in MFs
|
MFs lending in the collateralised segment as % of Banks’ Investment in MFs |
CBLO |
Market repo |
CBLO |
Market Repo |
1 |
2 |
3 |
4 |
5 |
6 |
03-Jul-09 |
28,320 |
28,846 |
89,472 |
32 |
32 |
17-Jul-09 |
34,851 |
33,984 |
1,29,998 |
27 |
26 |
31-Jul-09 |
42,485 |
26,724 |
1,39,619 |
30 |
19 |
14-Aug-09 |
55,540 |
43,203 |
1,56,910 |
35 |
28 |
28-Aug-09 |
58,725 |
33,596 |
1,51,136 |
39 |
22 |
11-Sep-09 |
59,899 |
46,754 |
1,56,573 |
38 |
30 |
25-Sep-09 |
29,504 |
29,328 |
66,687 |
44 |
44 |
Certificates of Deposit
V.16 With the easing of liquidity conditions, the fortnightly average issuance of certificates of deposit (CD) has picked up in 2009-10 so far. Most of the CD issued were of more than six months duration. The average interest rate on CD, on the back of abundant liquidity, declined between end-March 2009 and mid-June 2009 but has increased somewhat thereafter (Table 5.6).
Commercial Paper
V.17 During 2009-10, the commercial paper (CP) market also picked up with the easing of liquidity conditions and the size of fortnightly issuance has increased significantly. Leasing and finance companies continued to be the major issuers of CPs (45 per cent), followed by ‘manufacturing and other companies’ (41 per cent) and financial institutions (14 per cent) as at end-August 2009. The share of ‘manufacturing and other companies’ and ‘financial institutions’ in the total outstanding CPs has increased in the recent period (Table 5.8).
V.18 The significant easing of risk in the commercial paper market was evident in the secular decline in spread of CPs over 91-day treasury bills from a peak of 604 basis points in October 2008 to 161 basis points in September 2009 (Chart V.6). During 2009-10 so far, the most preferred tenor for issuance of CPs has been 60-180 days, as compared with more than 180 days in the previous year.
Treasury Bills
V.19 The gross amount mobilised through treasury bills remained substantially higher at Rs.2,23,210 crore during 2009-10 (up to October 23, 2009) as compared to the same period last year, reflecting in part the higher liquidity requirements of the Government. On July 16, 2009, it was decided to roll over the maturing amount of Treasury Bills till September 30, 2009. The implicit yield on 182-day and 364-day Treasury Bills increased somewhat in recent months (Table 5.9).
Table 5.8: Commercial Paper-Major Issuers |
(Rupees crore) |
Category of Issuer |
End of |
Jun-08 |
Sep-08 |
Dec-08 |
Mar-09 |
Jun-09 |
Aug-09 |
1 |
2 |
3 |
4 |
5 |
6 |
7 |
Leasing and Finance |
34,957 |
39,123 |
27,965 |
27,183 |
34,437 |
36,926 |
| |
(74.6) |
(75.0) |
(73.5) |
(61.5) |
(50.1) |
(44.5) |
Manufacturing |
8,150 |
9925 |
6,833 |
12,738 |
23,454 |
33,985 |
| |
(17.4) |
(19.10) |
(18.0) |
(28.9) |
(34.1) |
(40.9) |
Financial Institutions |
3,740 |
3,060 |
3,257 |
4,250 |
10,830 |
12,115 |
| |
(8.0) |
(5.9) |
(8.5) |
(9.6) |
(15.8) |
(14.6) |
Total |
46,847 |
52,108 |
38,055 |
44,171 |
68,721 |
83,026 |
Note: Figures in brackets are percentage share in total. |
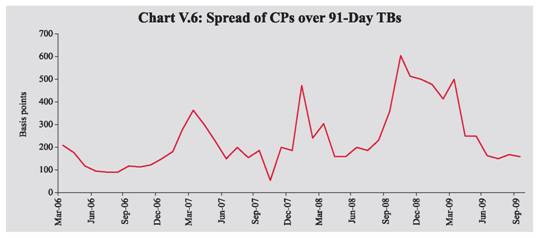
Table 5.9: Treasury Bills in the Primary Market |
Year/Month |
Notified Amount (Rupees crore) |
Average Implicit Yield at Minimum Cut-off Price (Per cent) |
Average Bid-Cover Ratio |
91-day |
182-day |
364-day |
91-day |
182-day |
364-day |
1 |
2 |
3 |
4 |
5 |
6 |
7 |
8 |
2007-08 |
2,24,500@ |
7.10 |
7.40 |
7.42 |
2.84 |
2.79 |
3.21 |
2008-09 |
2,99,000@ |
7.10 |
7.22 |
7.15 |
3.43 |
2.91 |
3.47 |
Apr 2008 |
22,000 |
7.28 |
7.41 |
7.53 |
1.70 |
1.36 |
2.36 |
May 2008 |
21,000 |
7.41 |
7.55 |
7.61 |
2.65 |
2.78 |
3.05 |
Jun 2008 |
11,500 |
8.01 |
8.42 |
7.93 |
2.00 |
2.76 |
2.80 |
Jul 2008 |
16,000 |
9.07 |
9.33 |
9.39 |
2.35 |
2.72 |
2.70 |
Aug 2008 |
23,500 |
9.15 |
9.31 |
9.24 |
2.99 |
2.86 |
4.35 |
Sept 2008 |
25,000 |
8.69 |
8.92 |
8.83 |
3.06 |
3.04 |
3.57 |
Oct 2008 |
35,000 |
8.13 |
8.36 |
7.92 |
1.95 |
2.42 |
4.00 |
Nov 2008 |
28,000 |
7.30 |
7.13 |
7.23 |
7.95 |
2.97 |
4.33 |
Dec 2008 |
16,500 |
5.69 |
5.35 |
5.07 |
5.36 |
4.67 |
5.14 |
Jan 2009 |
38,500 |
4.69 |
4.60 |
4.64 |
4.56 |
3.22 |
4.80 |
Feb 2009 |
32,000 |
4.78 |
4.71 |
4.62 |
2.81 |
1.86 |
2.62 |
March 2009 |
30,000 |
4.77 |
4.86 |
5.25 |
2.10 |
2.67 |
1.44 |
2009-10 |
|
|
|
|
|
|
|
April 2009 |
39,000 |
3.81 |
4.11 |
4.07 |
3.22 |
2.79 |
5.07 |
May 2009 |
29,000 |
3.26 |
3.54 |
3.58 |
3.18 |
2.25 |
3.14 |
June 2009 |
22,500 |
3.35 |
3.56 |
3.99 |
3.37 |
5.65 |
2.86 |
July 2009 |
40,000 |
3.23 |
3.45 |
3.77 |
3.92 |
2.86 |
3.90 |
Aug 2009 |
28,000 |
3.35 |
3.84 |
4.25 |
3.04 |
2.18 |
3.76 |
Sept 2009 |
32,000 |
3.35 |
3.94 |
4.47 |
3.67 |
4.17 |
4.05 |
@: Total for the financial year.
Note: 1. 182-day Treasury Bills were reintroduced with effect from April 2005. 2. Notified amounts are inclusive of issuances under the MSS. |
Government Securities Market
Central Government Securities
V.20 The Central Government completed a large part (74.0 percent) of the budgeted gross market borrowing programme (including amounts raised through de-sequestering of MSS balances) during 2009-10 (up to October 23, 2009). Ample liquidity in the system facilitated borrowings, although there was some impact on interest rates arising from financing of higher fiscal deficit (Table 5.10).
State Government Securities
V.21 The Annual Policy Statement for 2009-10 had projected States’ net market borrowings at Rs.1,26,000 crore, which was subsequently raised to Rs.1,40,000 crore. Up to October 22, 2009, 21 states mobilised Rs.72,216 crore (net Rs.58,683 crore) as compared with Rs.17,896 crore (net Rs.4,438 crore) raised by 12 states during the corresponding period of the previous year. Despite higher borrowings, the interest rate on the State Government securities moderated reflecting the market liquidity, although there has been some pressure on interest rates in recent months (Table 5.10).
Secondary Market
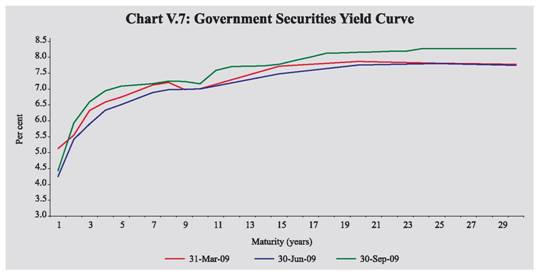
V.22 The gradual increase in yield across the maturity spectrum was evident during Q2 of 2009-10. Between end-June 2009 and end-September 2009, the yield on 1-30 year maturity increased between 16-70 basis points. The yield curve continued to reveal moderation in rates towards the short end on account of prevalence of abundant liquidity in the financial system. However, the medium to long-term yields hardened on concerns of large fiscal deficit (Chart V.7). The turnover in government securities market started showing signs of pick up in the current fiscal year so far (Chart V.8).
Table 5.10: Issuances of Central and State Government Dated Securities |
| |
2007-08 |
2008-09 |
2008-09# |
2009-10# |
1 |
2 |
3 |
4 |
5 |
Central Government |
|
|
|
|
Gross amount raised (Rupees crore) |
1,56,000 |
2,73,000 |
1,06,000 |
3,23,000 |
Re-issuances |
34 |
52 |
20 |
64 |
New issues |
1 |
4 |
1 |
5 |
Bid-cover ratio (Range) |
1.6-4.8 |
1.7-4.5 |
1.4-3.5 |
1.4-3.6 |
Weighted average maturity (years) |
14.9 |
13.8 |
15.5 |
10.9 |
Weighted average yield (per cent) |
8.12 |
7.69 |
8.81 |
7.08 |
Devolvement on PDs (Rupees crore) |
957 |
10,773 |
2,420 |
6050 |
State Governments |
|
|
|
|
Gross amount raised (Rupees crore) |
67,779 |
1,18,138 |
15,884 |
63,212 |
Cut-off yield |
7.84-8.90 |
5.80-9.90 |
8.39-9.90 |
7.04-8.37 |
Weighted average yield (per cent) |
8.25 |
7.87 |
9.05 |
7.90 |
# : Up to September 30. |
V.23 The yield on 5-year AAA-rated corporate bonds started hardening in Q2 of 2009-10, in tandem with increase in government bond yields. The risk spread on corporate bonds, however, continued to narrow to broadly return to the pre-Lehman level (Chart V.9).
Credit Market
V.24 In response to the prevailing ample market liquidity and the lower policy interest rate environment, the SCBs continued to soften their deposit rates for various maturities by 25-225 basis points during Q2 2009-10 (Table 5.11). The impact of the lower cost of funds for banks was also transmitted to the interest rates on bank loans with benchmark prime lending rates (BPLRs) of SCBs declining by 25-100 basis points during the same period.
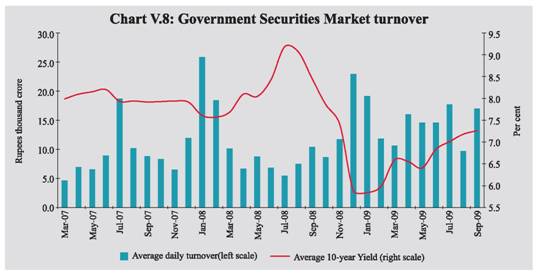
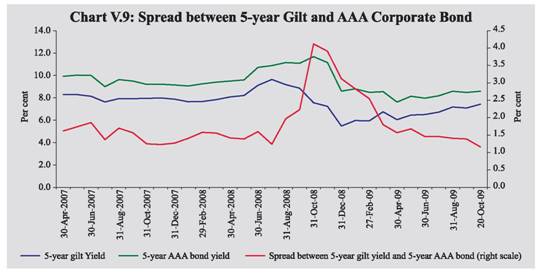
Table 5.11: Deposit and Lending Rates |
(Per cent) |
| |
March 2007 |
March 2008 |
March 2009 |
June 2009 |
October 2009# |
1 |
2 |
3 |
4 |
5 |
6 |
1) |
Domestic Deposit Rate Public Sector Banks |
|
|
|
|
|
| |
Up to 1 year |
2.75-8.75 |
2.75-8.50 |
2.75-8.25 |
1.00-7.00 |
1.00-6.75 |
| |
> 1year-3 years |
7.25-9.50 |
8.25-9.25 |
8.00-9.25 |
6.50-8.00 |
6.25-7.50 |
| |
> 3 years |
7.50-9.50 |
8.00-9.00 |
7.50-9.00 |
7.00-8.50 |
6.50-8.00 |
| |
Private Sector Banks |
|
|
|
|
|
| |
Up to 1 year |
3.00-9.00 |
2.50-9.25 |
3.00-8.75 |
2.00-7.50 |
2.00-7.00 |
| |
> 1year-3 years |
6.75-9.75 |
7.25-9.25 |
7.50-10.25 |
6.00-8.75 |
5.25-8.00 |
| |
> 3 years |
7.75-9.60 |
7.25-9.75 |
7.50-9.75 |
6.00-9.00 |
5.75-8.25 |
| |
Foreign Banks |
|
|
|
|
|
| |
Up to 1 year |
3.00-9.50 |
2.25-9.25 |
2.50-8.50 |
1.80-8.00 |
1.25-8.00 |
| |
> 1year-3 years |
3.50-9.50 |
3.50-9.75 |
2.50-9.50 |
2.25-8.50 |
2.25-8.50 |
| |
> 3 years |
4.05-9.50 |
3.60-9.50 |
2.50-10.00 |
2.25-9.50 |
2.25-8.50 |
2) |
BPLR |
|
|
|
|
|
| |
1. Public Sector Banks |
12.25-12.75 |
12.25-13.50 |
11.50-14.00 |
11.00-13.50 |
11.00-13.50 |
| |
2. Private Sector Banks |
12.00-16.50 |
13.00-16.50 |
12.75-16.75 |
12.50-16.75 |
12.50-16.75 |
| |
3. Foreign Banks |
10.00-15.50 |
10.00-15.50 |
10.00-17.00 |
10.50-16.00 |
10.50-16.00 |
3) |
Actual Lending Rate* |
|
|
|
|
|
| |
1. Public Sector Banks |
4.00-17.00 |
4.00-17.75 |
3.50-18.00 |
3.50-17.50 |
- |
| |
2. Private Sector Banks |
3.15-25.50 |
4.00-24.00 |
4.75-26.00 |
4.10-26.00 |
- |
| |
3. Foreign Banks |
5.00-26.50 |
5.00-28.00 |
5.00-25.50 |
2.76-25.50 |
- |
* : Interest rate on non-export demand and term loans above Rs. 2 lakh excluding lending rates at the extreme five per cent on both sides.
# : As on October 15, 2009. –: Not available. |
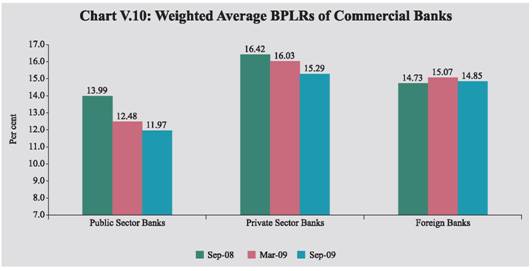 V.25 The weighted average BPLRs of public sector and private sector banks exhibited a secular decline after September 2008 (Chart V.10). The share of sub-BPLR lending for all SCBs (excluding export credit and small loans) declined from 75.8 per cent in March 2008 to 66.9 per cent in March 2009. On the whole, gradual moderation in lending and deposit rates continued, contributing thereby to an improvement in the monetary policy transmission.
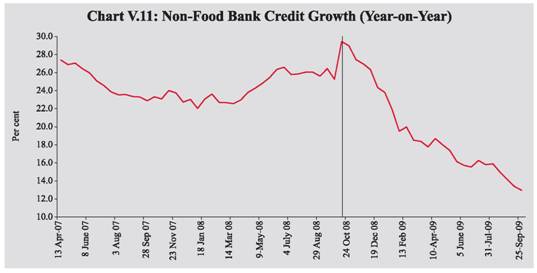
V.26 Despite lower interest rates on lending, the growth of non-food bank credit continued to decelerate in Q2 of 2009-10 (Chart V.11). This should be interpreted though along with the increase in resources mobilised from the non-banking sources, particularly in the form of issuance of CPs and private placements in equity market. Nevertheless, credit cards and consumer durables related credit have exhibited negative growth so far suggesting persistent slowdown in consumption demand.
 Foreign Exchange Market
V.27 After exhibiting appreciating trend in Q1 of 2009-10, the rupee exhibited greater two-way movements during Q2 on the back of return of capital inflows. The resilience shown by the Indian economy in the face of global economic crisis and continued weakness of the US dollar in the international markets also contributed to the strength of the rupee (Chart V.12). The rupee has strengthened against the US dollar during October 2009 so far on the back of sustained dollar inflows and continued weakness of the US dollar against the euro. As on October 22, 2009, the rupee appreciated by 9.2 per cent against the US dollar and 1.7 per cent against the Japanese yen over end-March 2009 level. The rupee, however, depreciated by 5.9 per cent against the pound sterling and 3.4 per cent against the euro.
V.28 The average 6-currency trade-based REER (base: 1993-94=100) appreciated by 5.2 per cent between March and August 2009, mainly on account of appreciation of the rupee against the US dollar and increase in inflation differential between India and its trading partners (Chart V.12 and Table 5.12). The 6-currency REER stood at 104.2 on October 21, 2009. In relation to the base year, over a long-term, the REER exhibits relative stability.
V.29 Reflecting the easing supply conditions in the foreign exchange market led by capital inflows, the forward premia generally exhibited declining trend during April-July 2009. However, the forward premia have exhibited both hardening as well as softening trend since August 2009, reflecting underlying demand and supply conditions (Chart V.13). The daily average turnover in the foreign exchange market, which showed some signs of improvement in May 2009, registered decline during the period June-September 2009. The ratio of inter-bank to merchant turnover increased to 2.9 during April-September 2009 from 2.6 a year ago (Chart V.14).
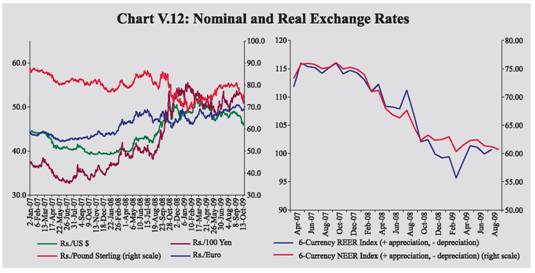
Table 5.12: Nominal and Real Effective Exchange Rate of the Indian Rupee (Trade Based Weights, Base : 1993-94 (April-March) = 100) |
Year/Month |
6-Currency Weights |
36-Currency Weights |
NEER |
REER |
NEER |
REER |
1 |
2 |
3 |
4 |
5 |
2007-08 |
74.76 |
114.23 |
93.91 |
104.81 |
2008-09 (P) |
64.87 |
104.47 |
86.15 |
94.62 |
Sep. 2008(P) |
64.81 |
106.96 |
85.42 |
95.96 |
Oct 2008(P) |
62.34 |
102.09 |
83.23 |
92.31 |
Nov 2008(P) |
63.25 |
102.45 |
84.69 |
92.59 |
Dec 2008(P) |
62.35 |
99.93 |
83.91 |
90.48 |
Jan 2009(P) |
62.49 |
99.23 |
83.62 |
90.02 |
Feb 2009(P) |
62.97 |
99.43 |
85.20 |
91.02 |
Mar, 2009(P) |
60.35 |
95.68 |
82.13 |
88.51 |
Apr 2009(P) |
61.49 |
98.58 |
82.67 |
89.72 |
May 2009(P) |
62.31 |
101.37 |
83.41 |
91.76 |
June 2009(P) |
62.43 |
101.11 |
83.71 |
92.19 |
July 2009(P) |
61.36 |
99.93 |
82.33 |
91.54 |
Aug 2009(P) |
61.22 |
100.68 |
82.02 |
91.58 |
Per cent Change |
|
2007-08 |
2008-09 (P) |
2008-09 (Apr-Aug) |
2009-10 (Apr-Aug) |
36-REER |
6.4 |
-9.7 |
-2.2 |
3.5 |
36-NEER |
9.3 |
-8.3 |
-1.6 |
-0.1 |
6-REER |
8.2 |
-8.5 |
0.2 |
5.2 |
6-NEER |
7.6 |
-13.2 |
-4.7 |
1.4 |
Rs/USD |
12.5 |
-12.4 |
-14.8 * |
6.0 * |
NEER : Nominal Effective Exchange Rate.
REER : Real Effective Exchange Rate.
P : Provisional. - : Not available. * : Up to end-September
Note: 1. Data from 2008-09 onwards are provisional.
2. Rise in indices indicates appreciation of the rupee and vice versa. |
Equity Market
V.30 During 2009-10 so far, the Indian capital market outperformed most EMEs, recovering a large part of the household wealth that was eroded by the contagion from global financial crisis. The secondary markets continued to register considerable gains on the back of credible indications of pickup in the domestic industrial activity and emerging signs of recovery in the world economy. The primary market, which had remained subdued up to May 2009 also resumed activity. Indeed, a few IPOs were oversubscribed by more than 20 times. Resource mobilisation by mutual funds also increased substantially. The volatility in the stock market during April-September 2009 was higher compared with the same period of last year (Table 5.13) arising from intermittent uncertainty regarding global economy and the changing perception about the real impact of domestic monsoon situation. The turnover in cash segment and market capitalisation increased during April-September 2009 compared with April-September 2008. The turnover in the derivative segment at the NSE was also higher during the period.

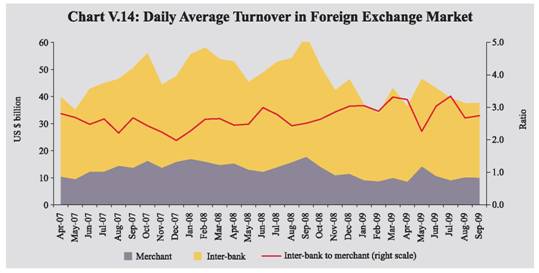
Table 5.13: Stock Market Indicators |
Indicator |
BSE |
NSE |
2007-08 |
2008-09 |
April-September |
2007-08 |
2008-09 |
April-September |
2008-09 |
2009-10 |
2008-09 |
2009-10 |
1 |
2 |
3 |
4 |
5 |
6 |
7 |
8 |
9 |
1. |
BSE Sensex / S&P CNX Nifty |
|
|
|
|
|
|
|
|
| |
(i) End-period |
15644 |
9709 |
12860 |
17127 |
4735 |
3021 |
3921 |
5084 |
| |
(ii) Average |
16569 |
12366 |
15059 |
14298 |
4897 |
3731 |
4511 |
4284 |
2. |
Coefficient of Variation |
13.7 |
24.2 |
8.7 |
12.5 |
14.5 |
23.2 |
8.3 |
11.6 |
3. |
Price-Earning Ratio (end-period)* |
20.1 |
13.7 |
16.2 |
22.2 |
20.6 |
14.3 |
16.9 |
22.9 |
4. |
Price-Book Value Ratio (end-period)* |
5.2 |
2.7 |
3.4 |
4.1 |
5.1 |
2.5 |
3.3 |
3.8 |
5. |
Yield* (per cent per annum) (end-period) |
1.1 |
1.8 |
1.4 |
1.1 |
1.1 |
1.9 |
1.5 |
1.0 |
6. |
Listed Companies |
4,867 |
4,929 |
4,926 |
4,946 |
1,381 |
1,432 |
1,424 |
1,435 |
7. |
Cash Segment Turnover (Rupees crore) |
15,78,856 |
11,00,074 |
6,82,658 |
7,62,205 |
35,51,038 |
27,52,023 |
16,05,906 |
22,87,846 |
8. |
Derivative Segment Turnover (Rupees crore) |
2,42,308 |
12,268 |
11,983 |
1,007 |
1,30,90,478 |
1,10,10,482 |
59,63,895 |
83,38,128 |
9. |
Market Capitalisation (Rupees crore) @ |
51,38,015 |
30,86,076 |
41,65,388 |
57,08,338 |
48,58,122 |
28,96,194 |
39,00,185 |
53,53,880 |
10. |
Market Capitalisation to GDP Ratio (per cent) |
108.8 |
58.0 |
78.3 |
107.3 |
102.9 |
54.4 |
73.3 |
100.6 |
*: Based on 30 scrips included in the BSE Sensex and 50 scrips included in the S&P CNX Nifty. @: As at end-period. Source: Bombay Stock Exchange Ltd. (BSE) and National Stock Exchange of India Ltd. (NSE). |
Primary Market
V.31 The activity in the primary market segment of the domestic capital market has displayed signs of revival since June 2009. Cumulatively, resources raised through public issues increased considerably during April-September 2009 (Table 5.14). The resources raised through Euro issues by the Indian corporates also increased markedly.
V.32 Mobilisation of resources through private placement increased by 28.7 per cent during April-June 2009 (the latest data available) as against decline of 15.7 per cent during April-June 2008. Resource mobilisation through financial intermediaries (both public and private sector) registered a decline of 19.1 per cent, while the non-financial intermediaries registered an increase of 94.6 per cent during the same period.
V.33 During April-September 2009, net resource mobilisation by mutual funds increased sharply with liquidity conditions remaining comfortable and the stock markets witnessing considerable gains (Table 5.15). Scheme-wise, during April-September 2009, income/debt oriented schemes witnessed a net inflow of Rs.1,07,012 crore, while growth/equity oriented schemes registered a net inflow Rs.5,721 crore.
Table 5.14: Mobilisation of Resources from the Primary Market |
(Amount in Rupees crore) |
Item |
No. of Issues |
Amount |
No. of Issues |
Amount |
2008-09 (April-September) |
2009-10 (April-September) |
1 |
2 |
3 |
4 |
5 |
A. |
Prospectus and Rights Issues* |
|
|
|
|
| |
1. |
Private Sector (a+b) |
32 |
12,361 |
25 |
6,814 |
| |
|
a) Financial |
1 |
448 |
- |
- |
| |
|
b) Non-financial |
31 |
11,913 |
25 |
6,814 |
| |
2. |
Public Sector (a+b+c) |
- |
- |
2 |
6,803 |
| |
|
a) Public Sector Undertakings |
- |
- |
1 |
4,026 |
| |
|
b) Government Companies |
- |
- |
1 |
2,777 |
| |
|
c) Banks/Financial Institutions |
- |
- |
- |
- |
| |
3. |
Total (1+2) |
32 |
12,361 |
27 |
13,617 |
| |
|
of which: |
|
|
|
|
| |
|
(i) Equity |
32 |
12,361 |
26 |
13,437 |
| |
|
(ii) Debt |
- |
- |
1 |
180 |
Memo: |
B. |
Euro Issues |
10 |
4,652 |
8 |
12,645 |
P : Provisional. * : Excluding offers for sale. – : Nil/Negligible. |
Table 5.15: Resource Mobilisation by Mutual Funds |
(Rupees crore) |
Category |
April-March |
April-September |
2008-09 |
2008-09 |
2009-10 |
Net Mobilisation@ |
Net Assets # |
Net Mobilisation@ |
Net Assets # |
Net Mobilisation@ |
Net Assets # |
1 |
2 |
3 |
4 |
5 |
6 |
7 |
Private Sector |
-34,017 |
3,35,527 |
-2,667 |
3,95,074 |
83,864 |
4,95,709 |
Public Sector * |
5,721 |
81,772 |
5,141 |
88,205 |
28,563 |
1,32,290 |
Total |
-28,296 |
4,17,300 |
2,473 |
4,83,278 |
1,12,427 |
6,27,999 |
@ : Net of redemptions. # : End-period. * : Including UTI Mutual fund.
Note : Data exclude funds mobilised under Fund of Funds Schemes.
Source : Securities and Exchange Board of India. |
Secondary Market
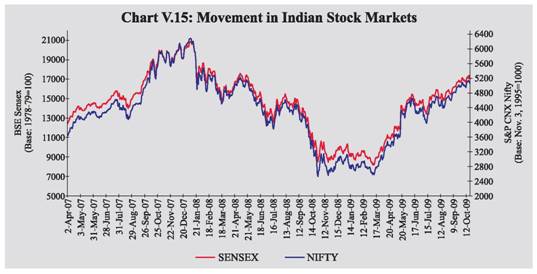
V.34 The market sentiments continued to remain positive during Q2 of 2009-10. After remaining subdued at the beginning of July 2009, the markets moved up subsequently following the firm trend in the international equity markets, better than expected earnings result by some Indian corporates and banks, besides the Reserve Bank allowing FIIs and NRIs to invest in Indian Depository Receipts. The Indian stock markets again witnessed some correction beginning in the second week of August 2009 with negative feedback from the US unemployment and retail data, concerns over expected tightening of bank lending in China, deficient monsoon and sustained decline in India’s exports. The markets, thereafter, recovered on better than expected economic data from the US and the Euro area, robust IIP growth in India for June 2009 and higher GDP growth for Q1 of 2009-10. The positive sentiments continued through September 2009 mainly on account of strong global cues such as G-20 leaders pledging to maintain stimulus measures, Federal Reserve’s survey reporting economic activity stabilising or improving in most regions of US in July-August 2009, strong growth in Chinese industrial production, the Bank of Japan upgrading its economic outlook as well as positive domestic developments such as higher advance tax paid by major Indian banks and corporates indicating robust quarterly earnings. The Sensex crossed 17000 mark by the end-September 2009 with strong support from FII inflows and positive global data. As at end-September 2009, the BSE Sensex and the S&P CNX Nifty both registered gains of about 18 per cent over end-June 2009 (Chart V.15).
V.35 FIIs and mutual funds made net purchases in the stock markets in Q2 of 2009-10. According to the data released by the Securities and Exchange Board of India (SEBI), FIIs made net purchases of US$ 7.4 billion in the Indian equity market during Q2 of 2009-10 as against net sales of US $2.4 billion in the comparable period of the previous year (Chart V.16). Mutual funds purchases in stock markets, however, decreased during Q2 of 2009-10 compared with the comparable period of previous year.
V.36 The sectoral indices witnessed buying pressure across the board during the current financial (up to end-September 2009) with rising investor interest. This resulted in significant gains in prices in sectors such as realty, metal, banking, auto, consumer durable, capital goods and information technology sector stocks (Table 5.16).
V.37 During Q3 of 2009, international financial markets exhibited higher confidence, improved risk appetite, narrowing of spreads and reduced volatility. In the interbank money market, key spreads narrowed to further low levels due to receding risks and continuation of easing policy stance by the major central banks; improvements were also evident in credit markets although still marked by weaknesses in some segments of the mortgage market. Despite deleveraging by the international financial institutions, the pace of corporate bond issuances picked up, indicating momentum in the underlying investment and real activity. The risk spread on EME bonds significantly receded, indicating rise in risk appetite towards EME assets and improvement in their access to international capital. The equity markets of both advanced economies and EMEs staged further recovery in Q3 of 2009.
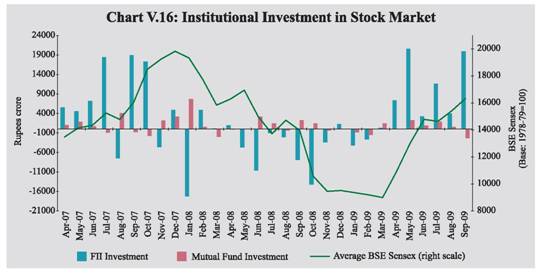
Table 5.16: BSE Sectoral Stock Indices |
(Base: 1978-79=100) |
Sector |
Variation (per cent) |
End-March 2008@ |
End-March 2009@ |
End-September 2009# |
1 |
2 |
3 |
4 |
Fast Moving Consumer Goods |
31.7 |
-11.1 |
26.5 |
Public Sector Undertakings |
25.4 |
-29.6 |
70.3 |
Information Technology |
-27.6 |
-35.6 |
100.0 |
Auto |
-7.1 |
-32.3 |
116.4 |
Oil and Gas |
56.0 |
-29.6 |
48.5 |
Metal |
65.2 |
-58.7 |
144.6 |
Health Care |
5.4 |
-26.5 |
55.6 |
Bankex |
18.0 |
-41.8 |
119.5 |
Realty |
33.8 |
-79.3 |
188.9 |
Capital Goods |
54.4 |
-53.8 |
112.8 |
Consumer Durables |
8.8 |
-58.1 |
115.8 |
BSE 500 |
24.3 |
-42.8 |
86.0 |
BSE Sensex |
19.7 |
-37.9 |
76.4 |
@ : Year-on-year variation. # : Variation over end-March 2009.
Source: Bombay Stock Exchange Limited. |
V.38 The domestic financial markets witnessed further reduction in risk and liquidity premia in various segments besides a pickup in transaction volumes during Q2 of 2009-10. The prevalence of easy liquidity conditions in money market was evident in the large absorption through the reverse repo operation. This ample liquidity condition facilitated low interest rates in money market with call rates hovering within the LAF corridor. Transaction volumes in CBLO and market repo segments continued to remain high during Q2 of 2009-10, reflecting easy liquidity conditions. The CP issuances also increased significantly. The longer-term yield, however, witnessed some increase, both for the government and corporate bonds, reflecting the concerns regarding government borrowing programme, incipient inflationary pressures and possible increase in demand for credit with expected recovery in the real activity. Although the growth of bank credit to private sector continued to be moderate, improved transmission of policy rates to lending rates was discernible. The equity markets made substantial recovery on the strength of improved domestic fundamentals, on clearer signs of recovery in the global economy and resumption of capital flows. In the primary market there was improvement in resource mobilisation by corporates in Q2 of 2009-10. The net resources mobilised by mutual funds recorded substantial increase, with liquidity conditions remaining comfortable. The equity prices witnessed considerable gains in sectors such as realty, metal, banking, auto, consumer durables, capital goods and information technology. Overall, the domestic financial markets remained stable and supportive of recovery in growth.
|