
V. Financial Markets - RBI - Reserve Bank of India


V. Financial Markets
| Money Market |
| Treasury Bills |
| Other Money Market Instruments |
| Foreign Exchange Market |
| Credit Market |
| Government Securities Market |
| Equity Market |
| Primary Market |
| Secondary Market |
International financial markets weathered the bouts of uncertainty pervading various segments during the year and experienced heightened activity as risk aversion ebbed and appetite of investors for both advanced and emerging markets was rekindled after a brief lull in the second quarter of 2004-05. Money market rates firmed up in most economies as some of the leading central banks began to reverse their accommodative monetary policy stances in response to inflationary pressures (Table 18).
| Table 18 : Short-term Interest Rates |
||||
| (Per cent) |
||||
| Country |
March 2005 |
January 2005 |
March 2004 |
March 2003 |
| 1 |
2 |
3 |
4 |
5 |
| Advanced Economies |
||||
| US |
2.90 |
2.56 |
1.04 |
1.18 |
| U K |
4.91 |
4.81 |
4.31 |
3.63 |
| Euro Area |
2.14 |
2.14 |
1.96 |
2.53 |
| Japan |
0.02 |
0.02 |
0.03 |
0.02 |
| Emerging Market Economies |
||||
| China |
2.25 |
2.50 |
– |
– |
| Hong Kong |
2.45 |
0.85 |
0.17 |
1.37 |
| South Korea |
3.55 |
3.53 |
3.90 |
4.76 |
| Argentina |
4.44 |
4.38 |
2.88 |
8.40 |
| Brazil |
19.24 |
18.24 |
16.02 |
23.65 |
| Malaysia |
2.82 |
2.82 |
3.00 |
3.10 |
| Philippines |
6.38 |
7.00 |
9.19 |
8.44 |
| Singapore |
2.00 |
1.75 |
0.69 |
0.69 |
| Thailand |
2.62 |
2.45 |
1.31 |
1.75 |
| Source : The Economist. |
||||
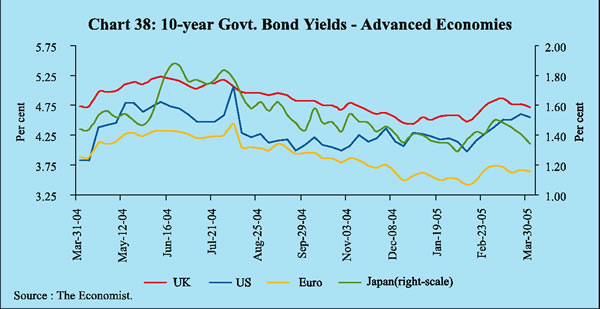
Government bond yields in advanced economies firmed up during April-August, 2004 as inflation began to harden on account of a spurt in fuel and other key commodity prices. They started declining from September 2004 as inflation expectations eased with the leveling off of commodity prices (Chart 38).
Equity markets displayed divergent trends across the world as country-specific factors dominated the generally positive expectations generated by the strengthening of the global recovery albeit dampened by higher oil prices.
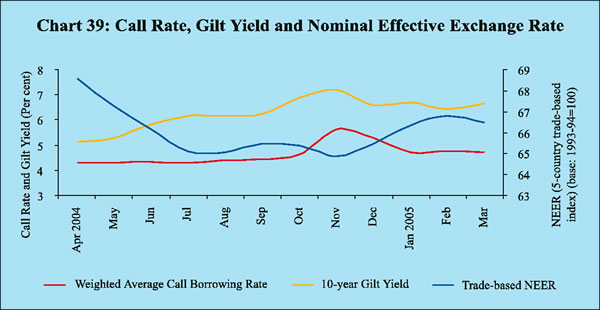
Domestic financial markets remained broadly stable during 2004-05 in an environment suffused with uncertainty and nervous sentiment created by the upturn in the international interest rate cycle, switches in capital flows and a soaring of international fuel prices. Money market segments exhibited easy liquidity conditions during the greater part of the year barring episodic pressures. The foreign exchange market remained generally orderly with moderate upward pressure on the exchange rate, notwithstanding the ebbing of capital flows during May-July 2004 and the rise in demand for foreign exchange due to higher oil prices. Discounts in the forward markets, however, turned into premia by June 2004. Yields in the Government securities market firmed up due to resurgence of inflationary pressures in the first two quarters of the year and the hardening of international interest rates (Chart 39).
The credit market continued to experience a step-up in activity which began in the second half of 2003-04. Commercial credit offtake remained strong and broad-based on the back of strengthening of industrial activity. Medium and large industry joined the housing and retail segments to drive up the demand for banks’ non-food credit. Shrugging off a sluggish phase, the equity market staged a strong rally beginning in the second half of 2004, which pushed the BSE Sensex to a historic high in March 2005 (Table 19).
| Table 19 : Domestic Financial Markets at a Glance – 2004-05 |
||||||||||||||
| Month |
Average |
Average 10-year |
Turnover |
Average |
Average |
RBI's net |
Forward |
Net OMO |
Average |
Average |
Average |
Average |
Average |
|
| Daily |
Call |
Yield |
in Govt. |
Daily |
Exchange |
Foreign |
premia |
Sales (-) |
Daily |
Daily |
Daily |
BSE |
S & P |
|
| Turnover |
Rates |
(Per |
Securities |
Inter- |
Rate |
Currency |
3-month |
/ |
Reverse |
BSE |
NSE |
Sensex |
CNX |
|
| (Rs. |
(Per |
cent) |
(Rs. |
bank |
(Rs. |
Sales (-)/ |
(Per |
Purchases |
Repo |
Turnover |
Turnover |
Nifty |
||
| crore) |
cent) |
crore)+ |
Turnover |
per |
Purchases |
cent) |
(+)(Rs. |
(LAF) |
(Rs. |
(Rs. |
||||
| (US $ |
US $) |
( +) |
crore)Outstanding |
crore) |
crore) |
|||||||||
| Million) |
(US $ |
(Rs. |
||||||||||||
| Million) |
crore) |
|||||||||||||
| 1 |
2 |
3 |
4 |
5 |
6 |
7 |
8 |
9 |
1 0 |
1 1 |
1 2 |
1 3 |
1 4 |
1 5 |
| April |
12,916 |
4.29 |
5.14 |
3,00,864 |
10,118 |
43.93 |
7,427 |
(-) 0.35 |
-253 |
75,006 |
2,243 |
5,048 |
5809 |
1848 |
| M a y |
10,987 |
4.30 |
5.29 |
1,92,264 |
8,521 |
45.25 |
-220 |
(-)1.33 |
-116 |
74,502 |
2,188 |
4,710 |
5205 |
1640 |
| June |
10,973 |
4.35 |
5.81 |
1,75,802 |
7,741 |
45.51 |
-413 |
0.93 |
-60 |
61,981 |
1,681 |
3,859 |
4824 |
1506 |
| J u l y |
8,632 |
4.31 |
6.18 |
1,30,400 |
7,684 |
46.04 |
-1,180 |
2.25 |
-218 |
59,594 |
1,793 |
4,265 |
4973 |
1568 |
| August |
11,562 |
4.41 |
6.16 |
1,29,373 |
5,753 |
46.34 |
-876 |
2.85 |
-78 |
42,692 |
1,736 |
3,948 |
5144 |
1615 |
| September |
17,088 |
4.45 |
6.23 |
1,75,635 |
7,266 |
46.09 |
1 9 |
2.20 |
-131 |
31,589 |
1,800 |
4,023 |
5423 |
1692 |
| October |
16,667 |
4.63 |
6.89 |
1,12,709 |
7,039 |
45.78 |
-99 |
2.87 |
-189 |
10,805 |
1,730 |
3,785 |
5702 |
1795 |
| November |
13,820 |
5.62 |
7.18 |
78,225 |
9,808 |
45.13 |
3,792 |
2.16 |
-342 |
-5,066 |
1,787 |
4,102 |
5961 |
1874 |
| December |
19,527 |
5.28 |
6.57 |
1,33,447 |
9,309 |
43.98 |
1,393 |
2.03 |
-339 |
7,570 |
2,184 |
5,026 |
6394 |
2022 |
| January |
16,534 |
4.72 |
6.69 |
1,10,535 |
7,875 |
43.75 |
0 |
2.50 |
-703 |
18,721 |
2,310 |
5,249 |
6307 |
1978 |
| February |
16,041 |
4.76 |
6.45 |
1,29,917 |
11,404 |
43.68 |
– |
1.99 |
-37 |
18,930 |
2,484 |
4,999 |
6595 |
2067 |
| March |
15,293 |
4.72 |
6.65 |
87,892 |
– |
43.69 |
– |
1.82 |
-389 |
29,809 |
2,706 |
5,139 |
6679 |
2096 |
| OMO: Open Market Operations. |
||||||||||||||
Money markets began the year in conditions of abundant liquidity stemming from the overhang in the system, a bunching of capital flows in April and the announcement of a truncated Government borrowing programme. The Reserve Bank, in fact, had to supplement large-scale reverse repo operations with sale of Government paper under the Market Stabilisation Scheme (MSS), operationalised in April 2004. Reflecting these easy liquidity conditions, average daily call money borrowing rates ruled at sub-reverse repo rate levels, except on a few occasions in May, June, August and September when call rates crossed the policy floor rate (Chart 40). Temporary mismatches on account of outflow
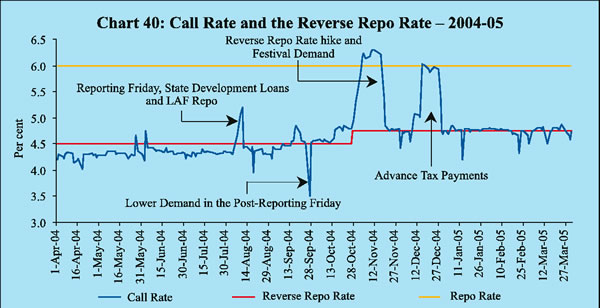
of funds, short cover by some banks and primary dealers (PDs) and payment by market participants for primary auction of Government bonds pushed up call rates in the late hours on May 28 and June 4, 2004. Call rates also firmed up in the first half of August due to State Development Loan (SDL) auctions, redemption pressure on mutual funds and the need to meet reserve requirements by the reporting Friday of August 13, 2004. The Reserve Bank had to inject liquidity through repos (Rs.5,000 crore on August 12). During the second half of September 2004, call rates firmed up again due to outflow of funds on account of advanced tax payments, substantial rise in surplus cash balances of the Government with the Reserve Bank and the hike in the cash reserve ratio (CRR).
The scenario began to change by October 2004 when conditions in the money market tightened. Pressures emanating from a number of factors such a s the robust expansion of non-food credit, drying up of capital inflows and an increase in reserve requirements drove the call rates above the reverse repo rate in the second half of October. A hike in the reverse repo rate by 25 basis points to 4.75 per cent effective October 27, 2004 correspondingly raised the floor in the money markets. Festival cash demand and scheduled Government securities auctions drove call rates beyond the repo rate to a peak of 6.30 per cent on November 18, 2004. The Reserve Bank injected liquidity through LAF repo operations in mid-November 2004 to calm the market sentiment. With the ebbing of festival cash demand and revival of FII inflows, call rates came down to 4.8 per cent on November 25, 2004. Call rates firmed up again in the second half of December 2004 due to tightening of liquidity conditions resulting from advance tax payments, continued strong growth in non-food credit and the Government maintaining substantial surplus cash balances with the Reserve Bank.
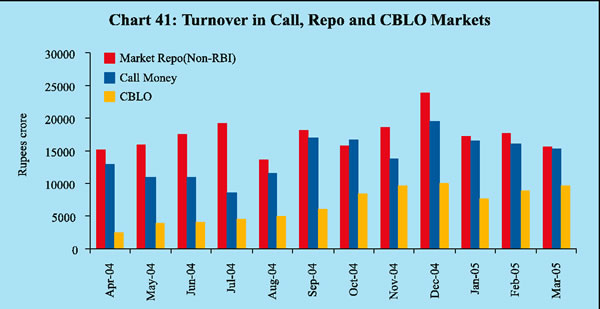
The turnover in the call/notice money market continued to contract, reflecting the underlying surplus situation combined with the emergence of alternative segments such as the repo (other than with the Reserve Bank) market and the Collateralised Borrowing and Lending Obligations (CBLOs). A part of the demand for funds has shifted from the call money market to the repo and CBLO as these segments offer lower cost funding. This, in turn, helped in achieving greater integration among the three segments. The call/notice money markets remained stable throughout the year except for some volatility in November-December 2004 (Table 20).
| Table 20 : Call/Notice Money Market – 2004-05 |
|||
| M o n t h |
Average Call /Notice Money |
Coefficient of |
Average Daily Call/ |
| Borrowing Rate |
Variation of |
Notice Turnover |
|
| (Per cent) |
Call Rate |
(Rs. Crore) |
|
| 1 |
2 |
3 |
4 |
| A p r i l |
4.29 |
0.01 |
12,916 |
| May |
4.30 |
0.02 |
10,987 |
| June |
4.35 |
0.02 |
10,973 |
| July |
4.31 |
0.01 |
8,632 |
| August |
4.41 |
0.05 |
11,562 |
| September |
4.45 |
0.05 |
17,088 |
| October |
4.63 |
0.03 |
16,667 |
| November |
5.62 |
0.11 |
13,820 |
| December |
5.28 |
0.11 |
19,527 |
| January |
4.72 |
0.01 |
16,534 |
| February |
4.76 |
0.03 |
16,041 |
| M a r c h |
4.72 |
0.02 |
15,293 |
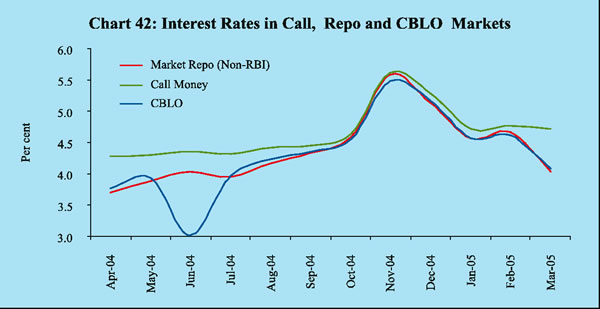
The gradual exit of non-bank participants from the call money market led to the increased activity in the repo (other than with the Reserve Bank) and CBLO segments of the market (Chart 41).
Interest rates in CBLO and market repo (other than with the the Reserve Bank) segments moved in alignment with call rates (Chart 42). All these rates are now better aligned with the Reserve Bank’s reverse repo rate.
Treasury Bills
Excess liquidity conditions at the beginning of 2004-05 evinced a vigorous market response to Treasury Bill auctions (Table 21). This was reflected in an increase in bid-cover ratios (ratio of competitive bid amount received to notified amount). Primary yields of 91-day and 364-day Treasury Bills fell below the reverse repo rate during April-May 2004.
| Table 21 : Treasury Bills in the Primary Market –2004-05 |
||||
| Average Implicit Yield at |
Bid-Cover Ratio |
|||
| minimum |
cut-off Price |
|||
| (Per cent) |
||||
| 91-day |
364-day |
91-day |
364-day |
|
| 1 |
2 |
3 |
4 |
5 |
| April 2004 |
4.38 |
4.44 |
2.15 |
2.47 |
| May |
4.39 |
4.33 |
2.93 |
2.46 |
| June |
4.44 |
4.55 |
2.61 |
1.28 |
| July |
4.46 |
4.60 |
2.39 |
2.06 |
| August |
4.76 |
5.00 |
1.81 |
3.36 |
| September |
4.72 |
5.14 |
2.51 |
2.83 |
| October |
5.15 |
5.46 |
1.82 |
2.75 |
| November |
5.47 |
5.71 |
2.80 |
2.64 |
| December |
5.30 |
5.69 |
2.69 |
2.81 |
| January 2005 |
5.31 |
5.69 |
2.19 |
2.06 |
| February |
5.25 |
5.65 |
2.99 |
2.81 |
| M a r c h |
5.24 |
5.63 |
2.31 |
2.74 |
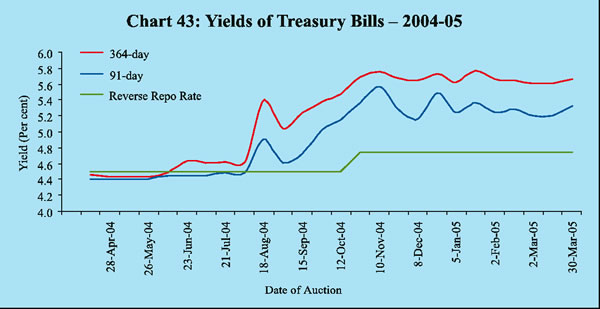
Domestic inflationary pressures pushed up 91-day Treasury Bill yields in the primary market beyond the reverse repo rate in August 2004. Yields started declining from December 2004 with the easing of headline inflation. The yield spread between the 91-day and 364-day Treasury Bills widened from six basis points in April 2004 to 39 basis points in March 2005 (Chart 43).
Other Money Market Instruments
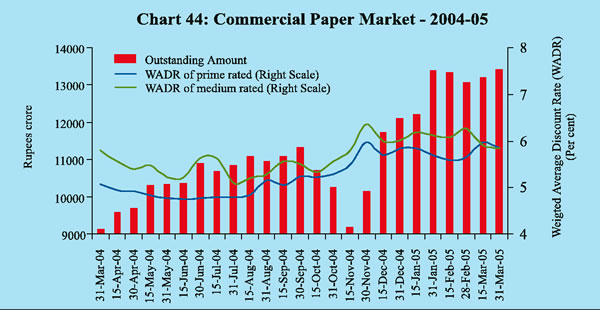
The commercial paper (CP) market remained buoyant despite the strong credit offtake. Outstanding CPs increased from Rs.9,131 crore at the beginning of the year to Rs.13,419 crore at the end of March 2005. The share of CPs issued by leasing and finance companies in the total CPs outstanding increased from 48.4 per cent in March 2004 to 64.2 per cent in March 2005, partly reflecting the policy-induced phasing out of public deposits. The weighted average discount rate (WADR) on commercial paper began to edge up during the year with higher credit demand. The spread between the WADR of prime-rated and medium-rated companies moved in a relatively narrow band of 11-87 basis points during the year as compared with 21-162 basis points in the preceding year (Chart 44).
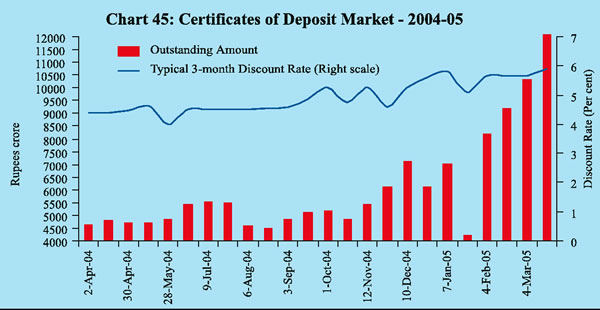
The market for certificates of deposit (CDs) remained subdued during the first half of the year because of easy liquidity conditions. The amount of CDs outstanding increased from Rs.4,626 crore in early April 2004 to Rs.12,078 crore by mid-March 2005 mainly on account of higher issuances by some private sector banks in line with seasonal trends. The typical three-month discount rate on CDs increased by 145 basis points during the year with sustained commercial credit offtake (Chart 45).
Other money market segments recorded heightened activity. The market for forward rate agreements and interest rate swaps (FRAs/IRS) continued to expand during the year. The number of contracts for both FRAs/IRS increased by 88.9 per cent during April 2004-March 2005. The notional amount increased to Rs.11,08,036 crore in early March 2005 from Rs.5,18,260 crore in March 2004. In most of these contracts, the NSE-Mumbai Inter-Bank Offered Rate (MIBOR) and Mumbai Inter-Bank Forward Offered Rate (MIFOR) were used as the benchmark rates. The other benchmark rates used included secondary market yields of the Government of India securities with a residual maturity of one year and the primary cut-off rate on 364-day Treasury Bills. The market for FRAs and IRS is getting enlarged with the participation of select public sector banks, PDs and foreign and private sector banks.
Turnover in collateralised borrowing and lending obligations (CBLO), introduced in January 2003, expanded rapidly. The daily average turnover in the CBLO segment increased from Rs. 2,506 crore in March 2004 to Rs.9,625 crore in March 2005. About 110 members were operating in the CBLO segment of the Clearing Corporation of India Limited (CCIL) in March 2005 out of which 56 were active. While the supply of funds has been augmented by mutual funds, the demand side has been strengthened by regular participation of public sector banks, followed by primary dealers and private sector banks on account of favourable borrowing costs in the CBLO segment vis-à-vis the call market.
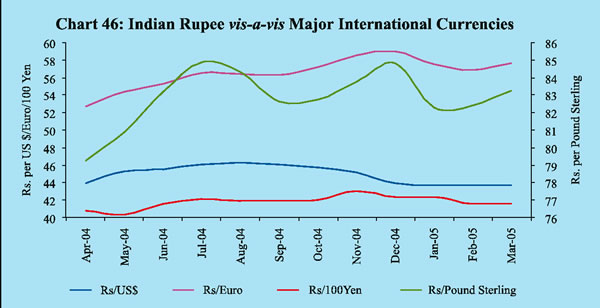
The excess supply conditions that prevailed in the foreign exchange market during the major part of 2003-04 persisted at the beginning of 2004-05. Pressures began to emerge by mid-May 2004 due to a shift in market sentiment driven by turbulence in the equity market and rising global oil prices. The ebbing of capital flows, the rising demand for imports and the surge in international oil prices drained away the excess supplies, leading the Indian rupee to depreciate against the US dollar by 4.5 per cent during May-July 2004. With the resumption in portfolio flows in August, the rupee started gaining strength against the US dollar. The US dollar’s weakness against the major international currencies and a decline in international crude oil prices helped the rupee to recover lost ground and appreciate against the US dollar by 6.6 per cent during August-December 2004.
During 2004-05, the rupee moved in the range of Rs. 43.36-46.46 per US dollar, depreciating by only 0.7 per cent over its end-March 2004 level. On the other hand, the rupee depreciated against the Pound Sterling and the Euro by 3.0 per cent and 6.0 per cent, respectively, and appreciated by 2.1 per cent against the Japanese Yen (Chart 46). Although the five-country (trade-weighted) nominal effective exchange rate (NEER) of rupee depreciated by 3.3 per cent during April-January 2004-05, the real effective exchange rate (REER) fell marginally by 0.4 per cent, indicating fair valuation.
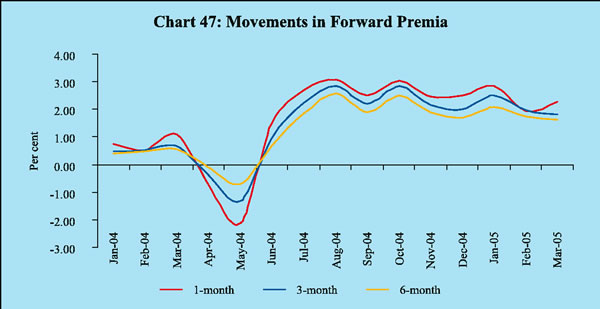
Forward rates began the year at a discount, reflecting the excess supply conditions in the spot segment. They, however, turned into premia from June 2004 with the depreciation of the rupee against the US dollar due to the strong pick-up in import demand and rising oil prices (Chart 47). The variation in forward premia is indicative of greater two-way movement of the rupee in recent months.
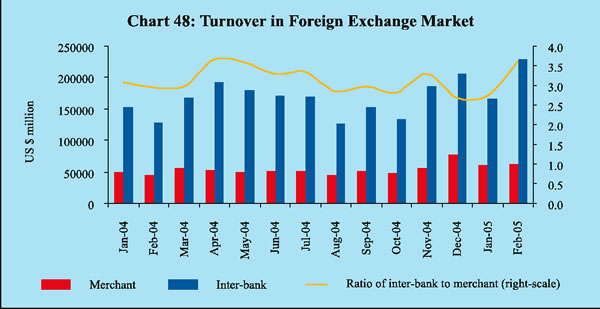
Both the merchant and inter-bank segments of the foreign exchange market recorded increased activity. While the total monthly merchant turnover increased to US $ 63.3 billion in February 2005 from US $ 52.4 billion in April 2004 after achieving a peak of US 76.5 billion in December 2004, total monthly inter-bank turnover increased to US $ 228.1 billion in February 2005 from US $ 192.2 billion during April 2004 (Chart 48). The ratio of inter-bank to merchant turnover hovered in the range of 2.7-3.7 during the year (up to February 2005), indicating orderly market activity.
Credit Market
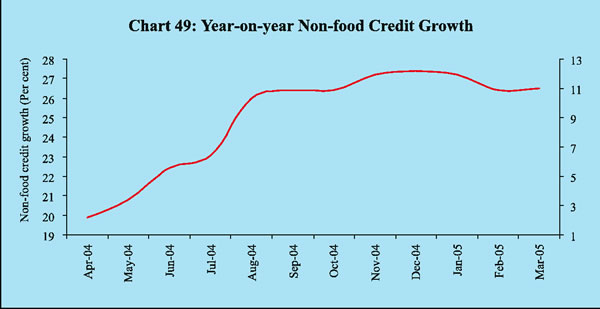
A distinctive feature of the domestic financial markets during the year was the sharp increase in credit offtake. During 2004-05, non-food credit grew by 26.5 per cent (net of conversion1 ) as compared with 18.4 per cent in the corresponding period of the previous year (Chart 49). The decline in food credit extended by the banking system in 2003-04 reversed in 2004-05 on account of higher procurement and lower offtake under open market sales.
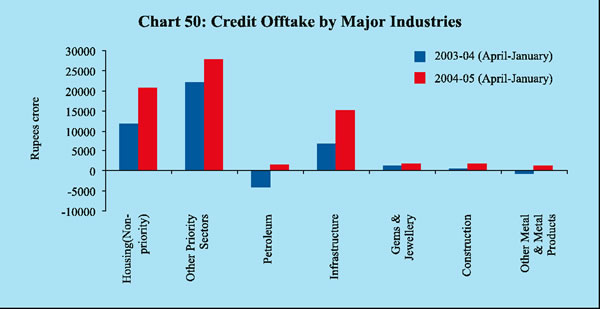
In consonance with the upsurge in industrial activity, credit to medium and large industries expanded by Rs. 32,274 crore during April- January 2004-05 as compared to a meagre increase of Rs. 1,736 crore during the corresponding period of the previous year (Table 22). There was also a sustained expansion in retail sector, particularly to the housing and consum er credit. Priority sector advances continued to expand at a steady pace . Cr edit to agriculture accelerated to 18. 9 per cent during 2004-05 (up to January ) from 12.3 per cent during the comparable period of the previous year, while the demand for housing loans remained strong. In order to improve flow of credit to the housing sector, the Reserve Bank allowed banks to extend direct finance to the housing sector up to Rs.15 lakh, irrespective of location, as part of their priority sector lending. At the same time, as a temporary counter-cyclical measure, risk weights were hiked from 50 per cent to 75 per cent in the case of housing loans and from 100 per cent to 125 per cent in the case of consumer credit, including personal loans and credit cards.
1 The conversion of a non-banking entity into banking entity from October 11, 2004.
| Table 22 : Sectoral and Industry-wise Deployment of Gross Bank Credit of Scheduled Commercial |
|||||
| (Rupees crore) |
|||||
| Sector/Industry |
2003-04 (Up to January) |
2004-05 |
(Up to January) |
||
| Absolute |
Per cent |
Absolute |
Per cent |
||
| 1 |
2 |
3 |
4 |
5 |
|
| 1. |
Priority sector# |
33,720 |
1 5 . 9 |
48,303 |
1 8 . 3 |
| Agriculture |
9,075 |
1 2 . 3 |
17,155 |
1 8 . 9 |
|
| Small Scale |
2,627 |
4 . 3 |
3,211 |
4 . 9 |
|
| Others |
22,018 |
2 8 . 3 |
27,937 |
2 6 . 0 |
|
| 2. |
Industry (Medium & Large) |
1,736 |
0 . 7 |
32,274 |
1 3 . 1 |
| Petroleum |
-3,923 |
-26.6 |
1,609 |
1 3 . 1 |
|
| Infrastructure |
6,693 |
2 5 . 5 |
15,053 |
4 0 . 4 |
|
| Other Metal & Metal Products |
-657 |
-7.7 |
1,349 |
1 6 . 5 |
|
| Construction |
493 |
1 0 . 1 |
1,838 |
3 0 . 7 |
|
| Electricity |
1,482 |
1 3 . 3 |
1,831 |
1 3 . 0 |
|
| Drugs & Pharmaceuticals |
793 |
1 0 . 0 |
1,292 |
1 4 . 9 |
|
| Gems & Jewellery |
1,372 |
1 8 . 2 |
1,678 |
1 8 . 3 |
|
| 3. |
Housing |
11,901 |
3 2 . 5 |
20,581 |
3 9 . 6 |
| 4. |
Non-Banking Financial Companies |
-472 |
-3.3 |
-24 |
-0.1 |
| 5. |
Wholesale Trade |
965 |
4 . 3 |
6, 601 |
2 6 . 5 |
| 6. |
Export Credit |
4,821 |
9 . 8 |
4,422 |
7 . 7 |
| #: Excluding investment in eligible securities. |
|||||
The increase in industrial credit in 2004-05 was broad-based. Infrastructure continued to lead the credit absorption, accounting for 42 per cent of the industrial credit expansion during the first 10 months. Petroleum, construction, gems and jewellery, cotton textiles, electricity, iron and steel, other metals and metal products also recorded growth in credit offtake and together accounted for a third of the incremental offtake during April-January 2004-05. The higher demand for credit by infrastructure industries and construction reflected strong investment demand. Credit to the telecommunication sector, in particular, recorded a sharp increase of 65.3 per cent during 2004-05 (up to January) from 21.8 per cent. Credit for roads and ports increased by 43.8 per cent. Petroleum credit increased by 13.1 per cent during the same period in contrast to the decline of 26.6 per cent, partly reflecting the incomplete pass-through of the increase in international crude oil prices to domestic finished petroleum products. The higher credit to the gems and jewellery sector was driven by export demand (Chart 50). Credit offtake was, however, lower for industries such as coal, jute textiles, paper and paper products, engineering, sugar, tobacco and tobacco products, petro-chemicals, fertiliser and computer software.
Public sector banks (PSBs) marginally reduced their deposit rates in the tenor of one-year and above from a range of 5.00-6.00 per cent in March 2004 to 4.75-5.75 per cent by December 2004 in view of easy liquidity conditions. Deposit rates, however, hardened in March 2005 (Table 23).
| Table 23 : Movements in Deposit and Lending Rates |
||||||
| (Per cent) |
||||||
| Interest Rate |
March 2004 |
June 2004 |
September 2004 |
December 2004 |
March 2005@ |
|
| 1 |
2 |
3 |
4 |
5 |
6 |
|
| 1. |
Domestic Deposit Rate |
|||||
| Public Sector Banks |
||||||
| Up to 1 year |
3.75-5.25 |
3.50-5.25 |
3.50-5.00 |
3.50-5.00 |
2.75-6.00 |
|
| More than 1 year and up to 3 years |
5.00-5.75 |
5.00-5.75 |
4.75-5.75 |
4.75-5.50 |
4.75-6.50 |
|
| More than 3 years |
5.25-6.00 |
5.25-5.75 |
5.25-5.75 |
5.00-5.75 |
5.25-7.00 |
|
| Private Sector Banks |
||||||
| Up to 1 year |
3.00-6.00 |
3.00-6.00 |
3.00-6.00 |
3.00-6.00 |
3.00-7.00 |
|
| More than 1 year and up to 3 years |
5.00-6.50 |
5.00-6.50 |
5.00-6.50 |
5.00-6.75 |
5.00-7.25 |
|
| More than 3 years |
5.25-7.00 |
5.25-7.00 |
5.25-7.00 |
5.25-6.50 |
5.50-7.00 |
|
| Foreign Banks |
||||||
| Up to 1 year |
2.75-7.75 |
2.75-7.50 |
2.75-7.50 |
3.00-5.75 |
3.00-6.25 |
|
| More than 1 year and up to 3 years |
3.25-8.00 |
3.25-8.00 |
3.25-8.00 |
3.50-7.00 |
3.50-7.00 |
|
| More than 3 years |
3.25.800 |
3.25-8.00 |
3.25-8.00 |
3.50-7.00 |
3.50-7.00 |
|
| 2. |
Benchmark Prime Lending Rate |
|||||
| Public Sector Banks |
10.25-11.50 |
10.25-11.50 |
10.25-11.50 |
10.25-11.25 |
10.25-11.25 |
|
| Private Sector Banks |
10.50-13.00 |
9.75-13.00 |
9.75-13.00 |
10.50-13.50 |
10.00-14.50 |
|
| Foreign Banks |
11.00-14.85 |
11.00-14.85 |
11.00-14.85 |
10.00-15.00 |
11.00-13.50 |
|
| 3. |
Actual Lending Rate* |
|||||
| Public Sector Banks |
4.00-16.00 |
4.25-16.00 |
2.75-16.00 |
3.50-19.50 |
– |
|
| Private Sector Banks |
4.50-22.00 |
4.00-22.19 |
3.15-21.48 |
2.62-22.00 |
– |
|
| Foreign Banks |
3.75-23.00 |
3.75-23.00 |
2.55-23.00 |
3.00-23.00 |
– |
|
| * :Interest rate on non-export demand and term loans above Rs.2 lakh excluding lending rates at the extreme 5 per cent on both sides. |
||||||
Prime lending rates (PLR) remained sticky, especially with higher credit demand. Sub-PLR lending of the banking system (excluding exports, the bulk of which is at sub-PLR) constituted over 65 per cent of total outstanding advances above Rs.2 lakh. The spreads around PLRs of PSBs (excluding 5 per cent of the credit sanctioned at extreme rates on either side of lending) for term loans narrowed during June-December 2004.
Activity in the Government securities markets during 2004-05 was essentially governed by domestic liquidity conditions, movements in international interest rates and inflationary expectations. Yields began to firm up from May 2004 onwards, driven by expectations about reversal of the accommodative monetary policy stance by the US Federal Reserve and the upturn in domestic inflation. A mix of higher credit offtake and drying up of capital inflows also led to contraction in surplus bank liquidity (net demand and time liabilities in excess of statutory pre-emptions and credit off take) and reduced the market appetite for Government paper (Chart 51). The 10-year benchmark yield moved up to 6.73 per cent on August 11, 2004 before retreating to 6.16 per cent by end-August 2004 with the reintroduction of one-day reverse repos in place of 7-day and 14-day reverse repos, announcement of fiscal measures to rein in inflation, lower than anticipated hike in the MSS ceiling (Rs.80,000 crore) and moderation in global oil prices. Besides, banks were also allowed in September 2004 to exceed the present limit of 25 per cent of total investment under held-to-maturity (HTM) category, provided the excess comprises only Statutory Liquidity Ratio (SLR) securities and the total SLR securities held in HTM category is not more than 25 per cent of the demand and time liabilities (DTL) as on the last Friday of the second preceding fortnight. To enable this, as a one-time measure, they could shift SLR securities to the HTM category as a one-time transfer during the accounting year 2004-05.
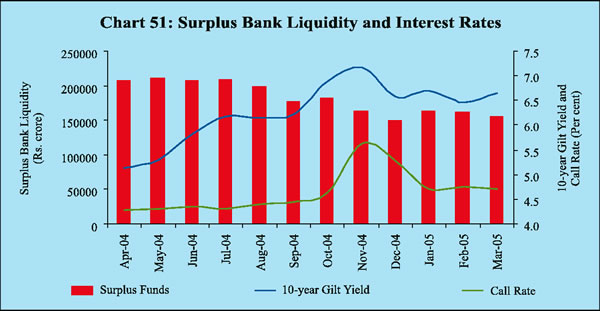
Gilt yields began to harden in the third quarter of the year. Although domestic inflation softened from the peak of 8.7 per cent in end-August 2004, higher inflation expectations fuelled by the spurt in international oil prices drove the 10-year yield up to a peak of 7.31 per cent on November 8, 2004. The turnover in the Government securities market contracted to about Rs.78,225 crore in November 2004 which was about 25 per cent of the April 2004 turnover. Strong festival demand in the wake of a hike in the CRR by 50 basis points in two stages on September 18, 2004 and October 2, 2004 added to market pressures.
Yields softened during December 2004 and January 2005 with the easing of liquidity conditions resulting from the cancellation of scheduled auctions, a revival of capital inflows and a moderation of inflation expectations (Chart 52). The turnover in the gilt market also improved between December 2004 and January 2005. Beginning February 2005, Government securities market experienced two-way trading interest. The upgradation of the sovereign rating by Standard and Poor’s (S&P) led to the softening of yields, while the hike in Employees’ Provident Fund (EPF) rate was largely ignored by the market. The 10-year yield closed at 6.45 per cent on February 28, 2005. The yields hardened again in the beginning of March on concerns about the higher than expected Government borrowing as announced in the Union Budget 2005-06 and remained range-bound amidst lacklustre trading. The yields hardened further during the month on concerns arising from persistent rise in the international crude oil prices. The 10-year yield stood at 6.65 per cent on March 31, 2005.
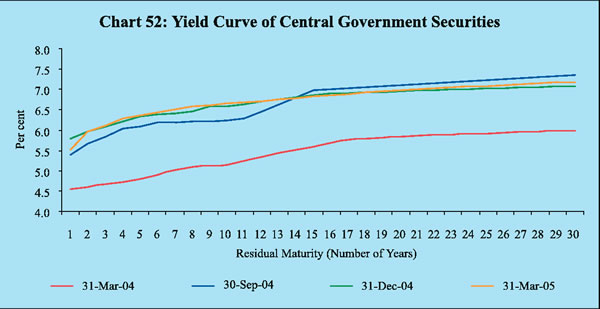
The yield curve shifted upwards almost continuously throughout the year with the hardening of yields across the maturity spectrum. The spread between 1-year and 10-year yields more than doubled to 140 basis points by end-November 2004 from 61 basis points at end-March 2004. By end-March 2005, the spread moderated to 114 basis points with the easing of inflationary pressures and revival of capital inflows.
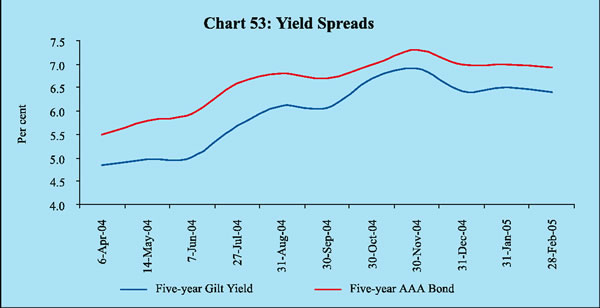
The yield spreads between 5-y ear Government securities and AAA-rated corporate bonds widened during first half of the year 2004-05 but narrowed some what subsequently because of hardening of yields on Government securities (Chart 53) .
Equity Market
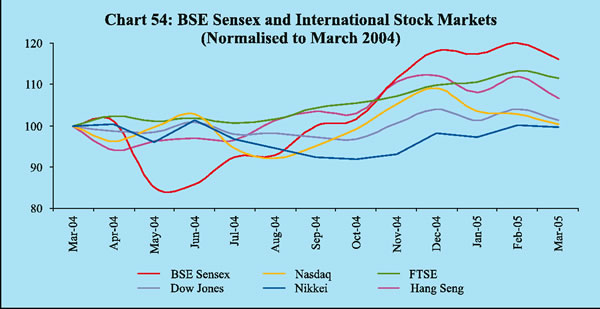
The stock markets mirrored the growing confidence in the strong fundamentals of the Indian economy as ebullient investor sentiment strained against intermittent technical corrections. Primary market activity gathered mo mentum during the year , particularly in the equity segment . Foreign institutional investors (FIIs) remained net buyers in each month of the year barring May 2004. Although market sentiment was dampened by political uncertainties in the early part of the year, the surge in international crude oil prices and the edging up of inflation domestically, a strong rally in the secondary market pushed the domestic stock indices to new highs.
The BSE Sensex performed better as compared with the major international indices since November 2004 (Chart 54).
Investor interest in the public issues segment strengthened during 2004-05, encouraged by the upbeat sentiment in the secondary market. Resource mobilisation through public issues (excluding offers for sale) increased sharply to Rs.19,666 crore from 56 issues as compared with Rs.7,190 crore from 35 issues during 2003-04 (Chart 55). Non-Government public limited companies (private sector) accounted for 65.3 per cent of total resource mobilisation by way of public issues. Of the 56 issues in the current financial year, 23 issues were initial public offerings (IPOs), of which 22 were by non-financial companies in
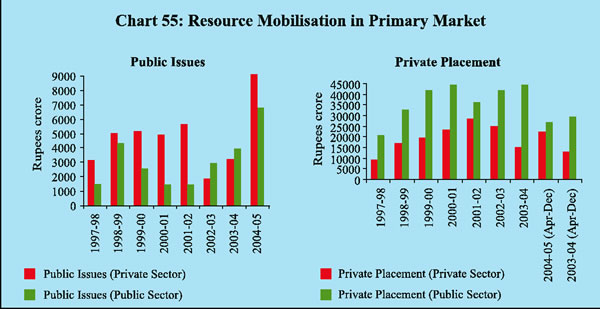
the private sector. Public issues by six companies, viz., ICICI Bank Ltd., TCS Ltd., Sterlite Industries (India) Ltd., National Thermal Power Corporation Ltd., Jet Airways (India) Ltd. and Punjab National Bank, together accounted for 72.9 per cent of total resource mobilisation.
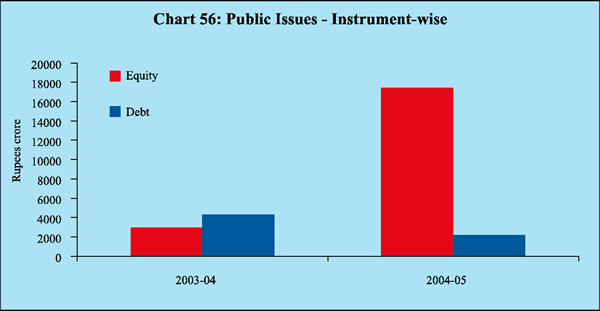
During 2004-05, equity issues dominated the market constituting 88.7 per cent of the total resource mobilisation (Chart 56).
Resource mobilisation through private placements aggregated Rs.49,255 crore during April-December 2004 as compared with Rs.42,372 crore a year ago. In all, 141 entities entered the market in April-December 2004 with 651 floatations as compared with 133 entities with 678 floatations during the first three quarters of the previous year. All issues in the private placement market barring one were debt issues. Financial Institutions continued to dominate the private placement market with a share of 58.2 per cent (as compared with 63.3 per cent in the preceding year) in total resource mobilisation.
Indian companies raised Rs.3, 353 crore through 15 Euro issues during 2004-05 as compared with Rs.3,098 crore through 18 issues during the previous year. There was no American Depository Receipt (ADR) issue during 2004-05, while resources mobilised by way of Global Depository Receipts (GDRs) registered a sharp increase.
Resource mobilisation by mutual funds declined by 95.3 per cent to Rs.2,200 crore during 2004-05 mainly on account of redemption pressures on income, gilt and equity-linked saving schemes due to shift of resources in favour of small saving schemes which offered attractive tax adjusted rates of return. The UTI Mutual Fund recorded net outflows of Rs.2,722 crore during 2004-05 as compared with net inflows of Rs.1,667 crore during 2003-04. The public sector mutual funds also recorded net outflows of Rs. 2,677 crore during 2004-05 as compared with net inflows of Rs.2,597 crore in the previous year. Resource mobilisation by private sector mutual funds was substantially lower at Rs.7,600 crore as compared with Rs.42,545 crore in the previous year. The bulk of the resources mobilised by mutual funds were under liquid/money market schmes and growth/equity oriented schemes, while resource mobilisation under debt schemes declined sharply due to change in the interest rate scenario.
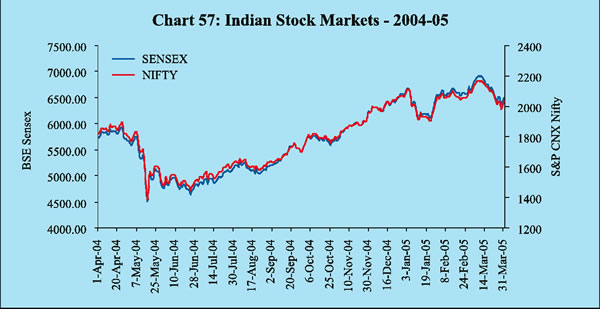
The stock market turned somewhat volatile during April-June 2004 within an overall buoyancy carried forward from the preceding year. On May 17, 2004, the stock markets experienced turbulent conditions due to the political uncertainty arising out of formation of the new Government at the Centre after the General Elections. Rising oil prices and apprehensions of upward movements in international interest rates were the other factors contributing to the sudden reversal of market sentiment. The sharp decline in the Indian stock market on May 17 , 2004 was , however , a transitory phenomenon and in keeping with the movements in other emerging markets in Asia such as South Korea (-5.1 per cent), Taiwan (-5.1 per cent) and Thailand (-4.6 per cent), which also fell sharply that day.
Although orderly conditions in the stock market were quickly restored, the market sentiment remained risk-averse till the first half of August 2004. The announcement of the imposition of Securities Transaction Tax (STT) in the Union Budget, 2004-05 affected the market sentiment adversely. Several other favourable proposals in the Union Budget such as reduction in short-term capital gains tax and abolition of long-term capital gains tax, increase in FDI for certain sectors and encouraging corporate results failed to cheer the markets. During the first half of August 2004, sentiment was also weighed down by the increase in international crude oil prices and a sharp rise in domestic inflation. Buoyant conditions returned to the market from the second half of August 2004. Between the last week of October 2004 and end-March 2005, a strong rally pushed the BSE Sensex to a historic high of 6915.05 on March 8, 2005 (Chart 57). Strong macroeconomic fundamentals, renewed buying interest by FIIs, encouraging financial performance of Indian companies, policy initiatives relating to foreign direct investment in telecom and construction sectors, tax incentives and structural measures proposed in the Union Budget 2005-06, moderation in domestic inflation and easing of international crude oil prices were some of the major factors that contributed to the upsurge.
The rally in the stock markets during 2004-05 was broad-based with several sectors registering significant gains. On a monthly average basis, the IT sector registered a gain of 59.5 per cent over March 2004, followed by consumer durables (50.5 per cent), capital goods (39.9 per cent), Bankex (28.6 per cent), Fast Moving Consumer Goods (FMCG) (11.6 per cent) and Public Sector Undertakings (PSUs) (8.3 per cent). The BSE 500 registered an increase of 21.9 per cent over end-March 2004 (Chart 58). Strong corporate results and positive international developments, including the sustained rally in the US stock market and favourable expectations relating to business process outsourcing (BPO)
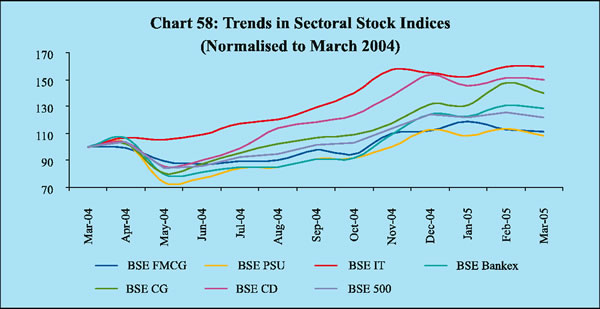
contributed to the performance of the IT sector scrips. The index of the capital goods sector was buoyant due to acceleration in industrial activity, signs of revival in the investment climate including a pick-up in infrastructure investment and the Government’s decision in February 2005 to allow 100 per cent FDI in the construction sector. Banking sector scrips registered gains due to the unprecedented pick-up in bank credit and expectations of better financial performance due to consolidation in the sector. The Government’s commitment to allow higher FDI in private sector banks and more recently, the road map for banking sector reforms released by the Reserve Bank, had a favourable impact on the movement of banking sector scrips. The sharp increase in the scrips in the consumer durables sector was on account of robust corporate results led by the increase in sales in electronics and auto segments.
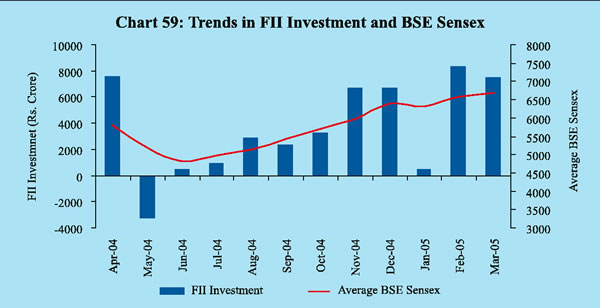
During 2004-05, foreign institutional investors (FIIs) remained net buyers in the equity market during each month barring May 2004 (Chart 59). According to the Securities and Exchange Board of India (SEBI), net purchases by FIIs stood at Rs.44,123 crore during 2004-05 as compared with Rs. 39,959 crore during the previous year. FII investments were particularly large during November-December 2004 and February-March 2005. Mutual funds made net investment of Rs. 445 crore in equities during 2004-05.
The BSE Sensex registered an increase of 16.1 per cent as on March 31, 2005 over the end-March 2004 level. On a daily average basis, the BSE Sensex rose by 27.8 per cent, while the S&P CNX Nifty witnessed an increase of 26.5 per cent during the same period (Table 24).
| Table 24 : Stock Market Indicators |
||||||
| Indicator |
B S E |
NSE |
||||
| 2004-05 |
2003-04 |
2004-05 |
2003-04 |
|||
| 1 |
2 |
3 |
4 |
5 |
||
| Average BSE Sensex / S&P CNX Nifty |
5740.99 |
4492.19 |
1805.26 |
1427.50 |
||
| Volatility |
11.15 |
22.95 |
11.28 |
23.30 |
||
| Turnover (Rs. crore) |
(April-March) |
5,18,716 |
5,02,618 |
11,40,071 |
10,99,535 |
|
| Market Capitalisation |
(Rs. crore) (End-period) |
16,98,429 |
12,01,207 |
15,85,585 |
11,20,976 |
|
| Source: The Stock Exchange, Mumbai (BSE) and National Stock Exchange of India Ltd.(NSE). |
||||||
The market capitalisation of BSE reached an all-time high of Rs. 17,95,267 crore on March 8, 2005, which was higher by 43.8 per cent over the end-March 2004 level. The price-earnings (P/E) ratio at 15.61 as on March 31, 2005 was lower than that of 18.57 at end-March 2004.
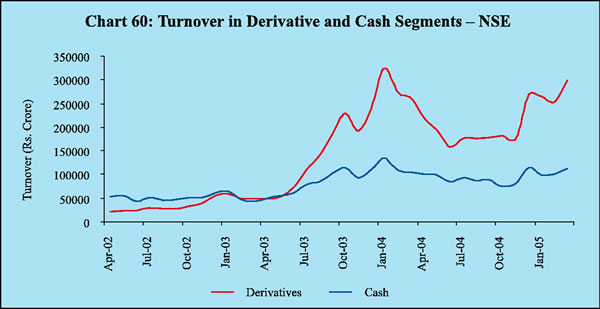
At NSE, the total turnover in the cash segment registered a modest increase of 4.2 per cent to Rs. 11,40,071 crore during 2004-05 from Rs. 10,99,535 crore during 2003-04. The turnover in the derivative segment continued to remain much above that in the cash segment (Chart 60). Total turnover in the NSE derivatives segment increased by 19.5 per cent to Rs.25,46,986 crore during 2004-05 from Rs. 21,30,612 crore during 2003-04.

Share this page:


Install the RBI mobile application and get quick access to the latest news!


