International Financial Markets
During the first quarter of 2007-08 (April-June), short term as well as long-term interest rates hardened in major advanced economies. Global equity markets recorded further gains, while in the currency markets the US dollar depreciated against major currencies. Emerging market spreads narrowed to new historical lows during the quarter, reversing the trend witnessed during the global sell-off during late February 2007.
Short-term rates hardened in a number of economies (Table 36), moving broadly in tandem with policy rates. Several central banks such as Bank of England, European Central Bank, People’s Bank of China, Reserve Bank of New Zealand, South African Reserve Bank, Norges Bank (Norway), Sveriges Riksbank (Sweden) and Swiss National Bank raised their policy rates during the quarter ended June 2007 to contain inflation and stabilise inflationary expectations. Short-term rates eased in a few emerging market economies (EMEs) such as Brazil and Thailand, as central banks in these countries continued to cut policy rates to support growth.
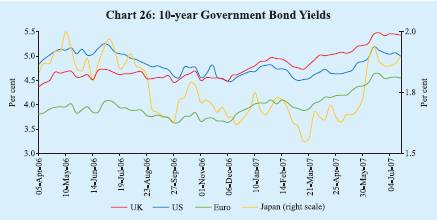
Long-term Government bond yields increased in major advanced economies during the first quarter of 2007-08, reversing the decline observed during February 2007. The rise in yields could be attributed to higher short-term rates and upward revision in growth expectations. During 2007-08 (up to July 18, 2007), 10-year yields increased by 38 basis points in the US, 51 basis points in the UK, 52 basis points in the euro area and 23 basis points in Japan (Chart 26).
Table 36: Short-term Interest Rates |
(Per cent) |
Region/Country |
At end of |
|
March 2005 |
March 2006 |
March 2007 |
June 2007 |
July 2007 * |
1 |
2 |
3 |
4 |
5 |
6 |
Advanced Economies |
|
|
|
|
|
Euro Area |
2.15 |
2.80 |
3.91 |
4.16 |
4.22 |
Japan |
0.02 |
0.04 |
0.57 |
0.63 |
0.66 |
Sweden |
1.97 |
1.99 |
3.21 |
3.42 |
3.43 |
UK |
4.95 |
4.58 |
5.55 |
5.92 |
6.00 |
US |
2.90 |
4.77 |
5.23 |
5.27 |
5.19 |
Emerging Market Economies |
|
|
|
|
|
Argentina |
4.56 |
9.63 |
9.63 |
9.25 |
9.50 |
Brazil |
19.25 |
16.54 |
12.68 |
11.93 |
11.93 |
China |
2.25 |
2.40 |
2.86 |
3.08 |
3.14 |
Hong Kong |
2.79 |
4.47 |
4.17 |
4.43 |
4.41 |
India |
5.37 |
6.11 |
7.98 |
7.39 |
4.50 |
Malaysia |
2.82 |
3.51 |
3.64 |
3.62 |
3.62 |
Philippines |
7.25 |
7.38 |
5.31 |
6.19 |
6.38 |
Singapore |
2.06 |
3.44 |
3.00 |
2.55 |
2.50 |
South Korea |
3.54 |
4.26 |
4.94 |
5.03 |
5.07 |
Thailand |
2.64 |
5.10 |
4.45 |
3.75 |
3.75 |
* : As on July 19, 2007.
Note : Data for India refer to 91-day Treasury Bills rate and for other countries
3-month money market rates.
Source : The Economist. |
Global equity markets recorded further gains during the first quarter of 2007-08, despite rise in long-term yields. Upward revision in growth expectations, robust corporate earnings, buoyant merger and acquisition activity, and increased risk appetite buoyed equity markets in major economies (Chart 27). The MSCI World and MSCI emerging markets indices on July 18, 2007 were higher by 8.8 per cent and 23.9 per cent, respectively, over their levels at end-March 2007. These gains were led by stock markets in South Korea (34.1 per cent), Brazil (29.4 per cent), Hungary (28.1 per cent), Indonesia (27.4 per cent) and Thailand (27.0 per cent).
In the foreign exchange market, the US dollar depreciated against the major currencies during the first quarter of 2007-08. The US dollar, however, recorded some appreciation against the Japanese yen (Table 37).
One of the key downside risks to the global economy is the possibility of a sharper slowdown in the US housing market. Over the past year, home sales and construction have slowed substantially and house prices have decelerated. Conditions in the sub-prime mortgage sector have deteriorated significantly in view of the rise in the delinquencies on adjustable-rate loans. These developments are also leading to reassessment of credit risks in other segments such as lower quality corporate bonds. Further deterioration in sub-prime delinquencies could lead to an abrupt rise in risk premium across products and markets. Such developments could lead to greater volatility in capital flows to EMEs. Such volatility could be exacerbated by the growing dominance of players such as hedge funds in the volume of cross-border flows. Increased speculative activity by hedge funds is also getting reflected in higher global commodity prices. Rapid growth in the hedge funds activity is a cause of concern among the regulators as these funds are largely unregulated and are governed by opaque investment partnerships.
Furthermore, private equity funds have also emerged as a key source of capital flows to the EMEs. Private equity funds are highly leveraged, and their operations so far have been enabled by still benign long-term rates and compression of risk premia. Private equity flows to the EMEs could also witness large retrenchment on the back of further monetary tightening in major economies, reassessment of risks by investors or through other shocks which lead to higher margin calls. The consequent volatility in global financial markets could lead to large swings in capital flows and exchange rates and could have adverse impact on the real economy.
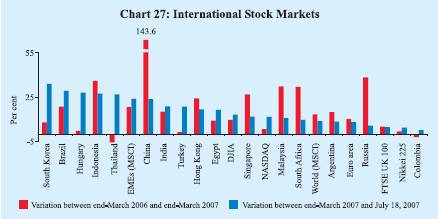
Table 37: Appreciation (+)/Depreciation (-) of |
the US dollar vis-à-vis other Currencies |
(Per cent) |
Currency |
End-March 2006 @ |
End-March 07 @ |
July 20, 2007 * |
1 |
2 |
3 |
4 |
Euro |
7.1 |
-9.1 |
-3.5 |
Pound Sterling |
8.5 |
-11.4 |
-4.6 |
Japanese Yen |
9.4 |
0.2 |
3.9 |
Chinese Yuan |
-3.1 |
-3.4 |
-2.2 |
Russian Rubble |
-0.6 |
-6.1 |
-2.3 |
Turkish Lira |
-2.0 |
3.2 |
-9.1 |
Indian Rupee |
2.2 |
-2.5 |
-7.5 |
Indonesian Rupiah |
-4.3 |
0.5 |
-0.5 |
Malaysian Ringgit |
-3.0 |
-6.2 |
-0.8 |
South Korea Won |
-4.7 |
-3.7 |
-2.6 |
Thai Baht |
-0.7 |
-9.9 |
-4.3 |
Argentine Peso |
5.4 |
0.7 |
0.2 |
Brazilian Peso |
-18.1 |
-6.4 |
-9.8 |
Mexican Peso |
-2.6 |
1.3 |
-2.2 |
South African Rand |
-0.5 |
17.2 |
-5.4 |
@ : Year-on-year variation.
* : Variation over end-March 2007. |
Domestic Financial Markets
Indian financial markets remained generally orderly for the most part of the first quarter of 2007-08 except for some volatility in overnight interest rates. Swings in cash balances of the Governments and capital flows were the main drivers of liquidity conditions in the financial markets and imparted some volatility to overnight interest rates (Table 38). The call money rate softened during the quarter and remained below the reverse repo rate on many occasions. Interest rates in the collateralised segment of the overnight money market also softened and remained below the call rate during the quarter. In the foreign exchange market, the Indian rupee appreciated vis-a-vis all major currencies (US dollar, Euro, Pound sterling and Japanese yen) during the first quarter. Yields in the Government securities market hardened up to mid-June 2007 and declined thereafter. Banks’ deposit and lending rates rose further during the first quarter; however, there was some softening in deposit rates in July 2007. The stock markets remained buoyant and the benchmark indices reached record highs. The primary market segment of the capital market witnessed increased activity in June 2007.
Table 38: Domestic Financial Markets at a Glance |
Year/ Month |
Call Money |
Government Securities |
Foreign Exchange |
Liquidity
Management |
Equity |
|
Aver
age Daily Turn
over
(Rs. crore) |
Aver
age Call Rates*
(Per cent) |
Average Turn
over in Govt. Securities (Rs. crore)+. |
Average
10-Year Yield@ (Per cent) |
Aver
age Daily Inter- bank Turn
over (US $ million) |
Aver
age
Exch
ange Rate
(Rs.
per
US $) |
RBI’s net Foreign Currency Sales (-)/ Purchases (+) (US $ million) |
Aver
age
3-month Forward Premia
(Per
cent) |
Aver
age MSS Out- standing# (Rs. crore) |
Aver
age Daily Reverse Repo
(LAF) Out- standing
(Rs. crore) |
Average Daily BSE Turnover
(Rs. crore) |
Aver
age Daily NSE Turn
over (Rs.
crore) |
Aver
age BSE Sen
sex** |
Aver
age
S&P
CNX
Nifty** |
1 |
2 |
3 |
4 |
5 |
6 |
7 |
8 |
9 |
10 |
11 |
12 |
13 |
14 |
15 |
2004-05 |
14,170 |
4.65 |
4,826 |
6.22 |
8,892 |
44.93 |
20,847 ## |
1.66 |
46,445 |
35,592 |
2,050 |
4,506 |
5741 |
1805 |
2005-06 |
17,979 |
5.60 |
3,643 |
7.12 |
12,738 |
44.27 |
8,143 ## |
1.60 |
58,792 |
10,986 |
3,248 |
6,253 |
8280 |
2513 |
2006-07 |
21,725 |
7.22 |
4,863 |
7.78 |
17,852 |
45.25 |
26,824## |
2.14 |
37,698 |
21,973 |
3,877 |
7,812 |
12277 |
3572 |
Jan 2006 |
17,911 |
6.83 |
3,094 |
7.15 |
16,713 |
44.40 |
0 |
2.60 |
40,219 |
-15,386 |
3,966 |
7,472 |
9540 |
2893 |
Feb 2006 |
13,497 |
6.95 |
2,584 |
7.32 |
15,798 |
44.33 |
2,614 |
2.85 |
33,405 |
-13,532 |
3,688 |
7,125 |
10090 |
3019 |
Mar 2006 |
18,290 |
6.58 |
2,203 |
7.40 |
17,600 |
44.48 |
8,149 |
3.11 |
29,652 |
-6,319 |
5,398 |
9,518 |
10857 |
3236 |
Apr 2006 |
16,909 |
5.62 |
3,685 |
7.45 |
17,712 |
44.95 |
4,305 |
1.31 |
25,709 |
46,088 |
4,860 |
9,854 |
11742 |
3494 |
May 2006 |
18,074 |
5.54 |
3,550 |
7.58 |
18,420 |
45.41 |
504 |
0.87 |
26,457 |
59,505 |
4,355 |
9,155 |
11599 |
3437 |
Jun 2006 |
17,425 |
5.73 |
2,258 |
7.86 |
15,310 |
46.06 |
0 |
0.73 |
31,845 |
48,610 |
3,131 |
6,567 |
9935 |
2915 |
Jul 2006 |
18,254 |
5.86 |
2,243 |
8.26 |
14,325 |
46.46 |
0 |
0.83 |
36,936 |
48,027 |
2,605 |
5,652 |
10557 |
3092 |
Aug 2006 |
21,294 |
6.06 |
5,786 |
8.09 |
15,934 |
46.54 |
0 |
1.22 |
40,305 |
36,326 |
2,867 |
5,945 |
11305 |
3306 |
Sep 2006 |
23,665 |
6.33 |
8,306 |
7.76 |
18,107 |
46.12 |
0 |
1.31 |
40,018 |
25,862 |
3,411 |
6,873 |
12036 |
3492 |
Oct 2006 |
26,429 |
6.75 |
4,313 |
7.65 |
16,924 |
45.47 |
0 |
1.67 |
41,537 |
12,983 |
3,481 |
6,919 |
12637 |
3649 |
Nov 2006 |
25,649 |
6.69 |
10,654 |
7.52 |
20,475 |
44.85 |
3,198 |
2.07 |
38,099 |
9,937 |
4,629 |
8,630 |
13416 |
3869 |
Dec 2006 |
24,168 |
8.63 |
5,362 |
7.55 |
19,932 |
44.64 |
1,818 |
3.20 |
38,148 |
-1,713 |
4,276 |
8,505 |
13628 |
3910 |
Jan 2007 |
22,360 |
8.18 |
4,822 |
7.71 |
21,065 P |
44.33 |
2,830 |
4.22 |
39,553 |
-10,738 |
4,380 |
8,757 |
13984 |
4037 |
Feb 2007 |
23,254 |
7.16 |
4,386 |
7.90 |
20,050 P |
44.16 |
11,862 |
3.71 |
40,827 |
648 |
4,676 |
9,483 |
14143 |
4084 |
Mar 2007 |
23,217 |
14.07 |
2,991 |
8.00 |
24,231 P |
44.03 |
2,307 |
4.51 |
52,944 |
-11,858 |
3,716 |
7,998 |
12858 |
3731 |
Apr 2007 |
29,689 |
8.33 |
4,636 |
8.10 |
28,131 P |
42.15 |
2,055 |
6.91 |
71,468 |
-8,937 |
3,935 |
8,428 |
13478 |
3947 |
May 2007 |
20,476 |
6.96 |
4,442 |
8.15 |
24,843 P |
40.78 |
4,426 |
4.58 |
83,779 |
-6,397 |
4,706 |
9,885 |
14156 |
4184 |
Jun 2007 |
16,826 |
2.42 |
6,250 |
8.20 |
30,122 P |
40.77 |
N.A. |
2.59 |
83,049 |
1,689 |
4,512 |
9,221 |
14334 |
4222 |
* : Average of daily weighted call money borrowing rates.
+ : Average of daily outright turnover in Central Government dated securities.
@ : Average of daily closing rates. # : Average of weekly outstanding MSS.
** : Average of daily closing indices. ## : Cumulative for the financial year.
LAF : Liquidity Adjustment Facility. BSE : Bombay Stock Exchange Limited.
MSS : Market Stabilisation Scheme. N.A. : Not available.
NSE : National Stock Exchange of India Ltd. P : Provisional.
Note : In column 11, (-) indicates injection of liquidity, while (+) indicates absorption of liquidity. |
Money Market
Money market rates eased during the first quarter of 2007-08 from the elevated levels witnessed in the second half of March 2007. The various interest rates in the money market, however, exhibited volatility during the first quarter, moving in tandem with the evolving liquidity conditions. The daily average call rate, which had reached an intra-year high of 54.32 per cent on March 30, 2007, moderated in the first week of April 2007 on the back of easier liquidity conditions following a decline in cash balances of the Central Government (Chart 28). The call rate moved below the reverse repo rate in early April 2007. With the first stage of hike in the cash reserve ratio (CRR) becoming effective on April 14, 2007 and the Government raising resources as part of its market borrowing programme, the call rate again edged higher and exceeded the repo rate during the second half of April 2007 and most of May 2007. Beginning end-May 2007, the call rate eased significantly and, on a number of occasions in June 2007, it was below one per cent. The call rate reached 0.23 per cent on June 21, 2007 and has remained low since then, except for a couple of days towards end-June 2007. The call rate averaged 2.42 per cent during June 2007 as compared with 6.96 per cent during May 2007. The call rate was 0.21 per cent on July 26, 2007. 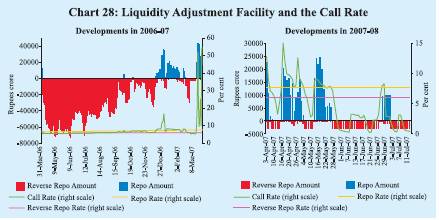
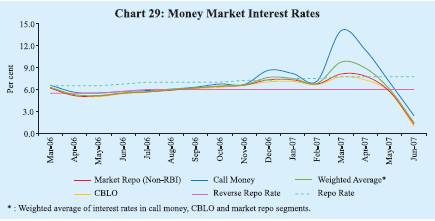
Interest rates in the collateralised segments of the money market – the market repo (outside the LAF) and the Collateralised Borrowing and Lending Obligation (CBLO) – declined in line with call rates, and continued to remain below the call rate during the first quarter of 2007-08 (Chart 29). During April-June 2007, interest rates averaged 5.90 per cent, 4.17 per cent and 4.66 per cent in the call, CBLO and market repo segments, respectively (5.63 per cent, 5.21 per cent and 5.26 per cent, respectively, a year ago). The weighted average rate in all the three money market segments combined together was 4.78 per cent during April-June 2007 (5.34 per cent a year ago).
The average daily volume in the money market segments – call market, market repo (outside the LAF) and CBLO – during April-June 2007 was 21.3 per cent higher than that in the same period of 2006. The collateralised market –market repo (outside the LAF) and CBLO – remained the predominant segment of the money market, and accounted for about 70 per cent of the total volume during April-June 2007 (Table 39). Mutual funds, financial institutions and nationalised banks are the major lenders in the CBLO market with nationalised banks, primary dealers and non-financial companies being the major borrowers. In the market repo segment, mutual funds are the major provider of funds, while foreign banks, private sector banks and primary dealers are the major borrowers.
Certificates of Deposit
The outstanding amount of certificates of deposit (CDs) increased from Rs.93,272 crore at end-March 2007 (4.8 per cent of aggregate deposits of issuing banks) to Rs. 99,287 crore (5.3 per cent) by June 8, 2007. The flexibility of return that can be offered by banks to attract bulk deposits has made CDs the preferred route for mobilising resources, especially for private sector banks. Mutual funds are the major investors in the CDs due to their tradability and liquidity. The weighted average discount rate (WADR) of CDs stayed firm till mid-May 2007 but declined to 9.31 per cent by mid-June 2007.
Table 39: Activity in Money Market Segments |
(Rupees crore) |
|
Average Daily Volume
(One Leg) |
Commercial Paper |
Certificates of Deposit |
Year/ Month |
Call Money Market |
Repo Market (Outside the LAF) |
Collateralised
Borrowing and
Lending Obligation (CBLO) |
Total
(2+3+4) |
Term Money Market |
Outstanding |
WADR
(per cent) |
Outstanding |
WADR(per cent) |
1 |
2 |
3 |
4 |
5 |
6 |
7 |
8 |
9 |
10 |
2004-05 |
7,085 |
4,284 |
3,349 |
14,718 |
263 |
11,723 |
5.34 |
6,052 |
– |
2005-06 |
8,990 |
5,296 |
10,020 |
24,306 |
417 |
17,285 |
6.46 |
27,298 |
– |
2006-07 |
10,863 |
8,419 |
16,195 |
35,477 |
506 |
21,621 |
8.08 |
63,746 |
8.23 |
Jan 2006 |
8,956 |
6,149 |
12,817 |
27,922 |
545 |
16,431 |
7.29 |
34,521 |
6.45 |
Feb 2006 |
6,749 |
6,024 |
17,081 |
29,854 |
407 |
15,876 |
8.02 |
34,487 |
7.68 |
Mar 2006 |
9,145 |
7,991 |
17,888 |
35,024 |
669 |
12,718 |
8.59 |
43,568 |
8.62 |
Apr 2006 |
8,455 |
5,479 |
16,329 |
30,263 |
447 |
16,550 |
7.30 |
44,059 |
7.03 |
May 2006 |
9,037 |
9,027 |
17,147 |
35,211 |
473 |
17,067 |
6.89 |
50,228 |
7.17 |
Jun 2006 |
8,713 |
10,563 |
13,809 |
33,085 |
628 |
19,650 |
7.10 |
56,390 |
7.19 |
Jul 2006 |
9,127 |
9,671 |
15,670 |
34,468 |
432 |
21,110 |
7.34 |
59,167 |
7.65 |
Aug 2006 |
10,647 |
7,764 |
15,589 |
34,000 |
510 |
23,299 |
7.31 |
65,621 |
7.77 |
Sep 2006 |
11,833 |
9,185 |
14,771 |
35,789 |
568 |
24,444 |
7.70 |
65,274 |
7.80 |
Oct 2006 |
13,214 |
9,721 |
16,964 |
39,899 |
466 |
23,171 |
7.77 |
65,764 |
7.73 |
Nov 2006 |
12,825 |
9,374 |
16,069 |
38,268 |
348 |
24,238 |
7.88 |
68,911 |
7.99 |
Dec 2006 |
12,084 |
7,170 |
15,512 |
34,766 |
481 |
23,536 |
8.52 |
68,619 |
8.28 |
Jan 2007 |
11,180 |
6,591 |
15,758 |
33,529 |
515 |
24,398 |
9.09 |
70,149 |
9.22 |
Feb 2007 |
11,627 |
7,794 |
19,063 |
38,484 |
467 |
21,167 |
10.49 |
72,795 |
9.87 |
Mar 2007 |
11,608 |
8,687 |
17,662 |
37,957 |
739 |
17,838 |
11.33 |
93,272 |
10.75 |
Apr 2007 |
14,845 |
7,173 |
18,086 |
40,104 |
440 |
18,759 |
10.52 |
95,980 |
10.55 |
May 2007 |
10,238 |
8,965 |
20,810 |
40.013 |
277 |
22,024 |
9.87 |
99,715 |
9.87 |
Jun 2007 |
8,413 |
10,294 |
20,742 |
39,450 |
308 |
25,500* |
9.13 |
99,287 @ |
9.31 |
– : Not available. * : June 15, 2007. @ : June 8, 2007.
WADR : Weighted Average Discount Rate. |
Commercial Paper
Issuances of commercial papers (CPs) increased in the first quarter of 2007-08. Outstanding CPs rose from Rs.17,838 crore at end-March 2007 to Rs. 25,500 crore as on June 15, 2007 (Table 39). The WADR on CPs which had hardened to 11.33 per cent during the fortnight ended March 31, 2007 stayed firm at around 10.50 per cent till mid-May before declining to 9.13 per cent during the fortnight ended June 15, 2007 in tandem with the moderation in other money market rates. The discount rate on CPs was in the range of 7.00-10.80 per cent during the fortnight ended June 15, 2007 (10.25-13.00 per cent during the fortnight ended March 31, 2007). Leasing and finance companies remained the major issuers of CPs (Table 40).
Table 40: Commercial Paper – Major Issuers |
(Rupees crore) |
Category of Issuer |
End of |
|
March 2006 |
March 2007 |
June 2007* |
|
|
|
|
1 |
2 |
3 |
4 |
Leasing and Finance |
9,400 |
12,569 |
17,341 |
|
(73.9) |
(70.5) |
(68.0) |
Manufacturing |
1,982 |
2,754 |
4,068 |
|
(15.6) |
(15.4) |
(15.9) |
Financial Institutions |
1,336 |
2,515 |
4,091 |
|
(10.5) |
(14.1) |
(16.1) |
Total |
12,718 |
17,838 |
25,500 |
|
(100.0) |
(100.0) |
(100.0) |
* : June 15, 2007. |
|
|
|
Note : Figures in parentheses are percentage shares in the total outstanding. |
Treasury Bills
The primary market yields on Treasury Bills (TBs) softened during the first quarter of 2007-08, especially in June 2007, reflecting the trends in money market segments as well as fall in domestic inflation rate (Chart 30). The yield spread between 364-day and 91-day TBs was 28 basis points in June 2007, marginally higher than that in March 2007 (22 basis points) (Table 41). The primary market yields of Treasury Bills softened further during July 2007 (up to July 20, 2007).
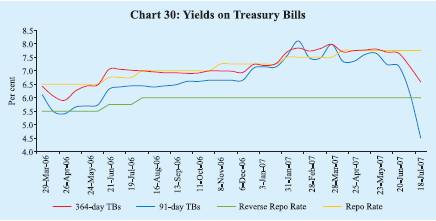
Table 41: Treasury Bills in the Primary Market |
Month |
Notified Amount
(Rupees crore) |
Average Implicit
Yield at Minimum
Cut-off Price
(Per cent) |
Average Bid-Cover Ratio |
|
|
91-day |
182-day 364-day |
91-day |
182-day |
364-day |
1 |
2 |
3 |
4 |
5 |
6 |
7 |
8 |
2004-05 |
1,38,500 @ |
4.91 |
– |
5.16 |
2.43 |
– |
2.52 |
2005-06 |
1,55,500 @ |
5.68 |
5.82 |
5.96 |
2.64 |
2.65 |
2.45 |
2006-07 |
1,86,500 @ |
6.64 |
6.91 |
7.01 |
1.97 |
2.00 |
2.66 |
Jan 2006 |
5,000 |
6.25 |
6.22 |
6.21 |
2.86 |
2.83 |
2.72 |
Feb 2006 |
5,000 |
6.63 |
6.74 |
6.78 |
3.04 |
2.07 |
2.71 |
Mar 2006 |
6,500 |
6.51 |
6.66 |
6.66 |
4.17 |
3.43 |
3.36 |
Apr 2006 |
5,000 |
5.52 |
5.87 |
5.98 |
5.57 |
4.96 |
2.02 |
May 2006 |
18,500 |
5.70 |
6.07 |
6.34 |
1.88 |
1.84 |
1.69 |
Jun 2006 |
15,000 |
6.14 |
6.64 |
6.77 |
1.63 |
1.35 |
2.11 |
Jul 2006 |
16,500 |
6.42 |
6.75 |
7.03 |
1.82 |
1.55 |
3.12 |
Aug 2006 |
19,000 |
6.41 |
6.70 |
6.96 |
2.03 |
2.71 |
3.48 |
Sep 2006 |
15,000 |
6.51 |
6.76 |
6.91 |
1.35 |
1.80 |
2.92 |
Oct 2006 |
15,000 |
6.63 |
6.84 |
6.95 |
1.31 |
1.20 |
2.02 |
Nov 2006 |
18,500 |
6.65 |
6.92 |
6.99 |
1.33 |
1.22 |
2.49 |
Dec 2006 |
15,000 |
7.01 |
7.27 |
7.09 |
1.19 |
1.29 |
3.34 |
Jan 2007 |
19,000 |
7.28 |
7.45 |
7.39 |
1.02 |
1.35 |
1.74 |
Feb 2007 |
15,000 |
7.72 |
7.67 |
7.79 |
2.48 |
2.56 |
3.16 |
Mar 2007 |
15,000 |
7.68 |
7.98 |
7.90 |
2.08 |
2.15 |
3.87 |
Apr 2007 |
14,000 |
7.53 |
7.87 |
7.72 |
2.87 |
3.36 |
3.16 |
May 2007 |
18,500 |
7.59 |
7.70 |
7.79 |
2.33 |
2.57 |
2.33 |
Jun 2007 |
35,000 |
7.39 |
7.76 |
7.67 |
3.23 |
4.11 |
3.97 |
@ : Total for the financial year.
Note : 1. 182-day TBs were reintroduced with effect from April 2005.
2. Notified amounts are inclusive of issuances under the Market Stabilisation Scheme (MSS). |
Foreign Exchange Market
During the first quarter of 2007-08, the Indian rupee appreciated vis-à-vis the US dollar. During 2007-08 (up to July 26, 2007), the Indian rupee moved in a range of Rs.40.24-43.15 per US dollar (Chart 31). Reflecting a variety of factors
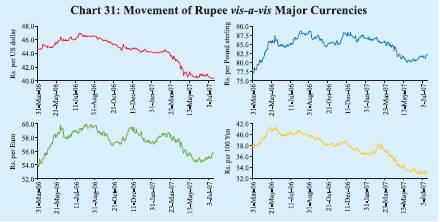
such as large capital inflows, weakening of the US dollar vis-à-vis other major currencies in international markets and the widening of the daily trading band of yuan against the US dollar (0.5 per cent from 0.3 per cent effective May 21, 2007), the Indian rupee appreciated from Rs.43.60 per US dollar as at end-March 2007 to reach a level of Rs.40.46 per US dollar as on May 29, 2007. Since then, the rupee has been largely range-bound. The exchange rate of the rupee was Rs.40.28 per US dollar on July 26, 2007. At this level, the Indian rupee appreciated by 8.2 per cent vis-à-vis the US dollar over its level on March 31, 2007. Over the same period, the rupee appreciated by 3.7 per cent against the Pound sterling, 5.3 per cent against the Euro and 10.8 per cent against the Japanese yen.
The nominal effective exchange rate (NEER) of the Indian rupee (six-currency trade-based weights) appreciated by 7.3 per cent between March 2007 and July 26, 2007. Over the same period, the real effective exchange rate (REER) of the Indian rupee (six-currency trade-based weights) appreciated by 7.7 per cent (Table 42). The 36-currency NEER and REER of the Indian rupee appreciated by 3.5 per cent and 2.9 per cent, respectively, between March 2007 and April 2007.
Table 42: Nominal and Real Effective Exchange Rate of |
the Indian Rupee (Trade-Based Weights) |
|
Base : 1993-94 (April-March) = 100 |
Year/Month |
|
6-Currency Weights |
36-Currency Weights |
|
|
NEER |
REER |
NEER |
REER |
1 |
|
2 |
3 |
4 |
5 |
1993-94 |
|
100.00 |
100.00 |
100.00 |
100.00 |
2000-01 |
|
77.43 |
102.82 |
92.12 |
100.09 |
2001-02 |
|
76.04 |
102.71 |
91.58 |
100.86 |
2002-03 |
|
71.27 |
97.68 |
89.12 |
98.18 |
2003-04 |
|
69.97 |
99.17 |
87.14 |
99.56 |
2004-05 |
|
69.58 |
101.78 |
87.31 |
100.09 |
2005-06 |
|
72.28 |
107.30 |
89.84 |
102.34 |
2006-07 (P) |
|
68.93 |
105.46 |
86.04 |
98.50 |
Mar 2006 |
|
72.45 |
107.41 |
89.52 |
101.25 |
Apr 2006 |
|
71.04 |
105.75 |
87.88 |
98.12 |
May 2006 |
|
68.79 |
103.48 |
85.58 |
96.35 |
Jun 2006 |
|
68.21 |
103.06 |
85.26 |
96.48 |
Jul 2006 |
|
67.59 |
102.25 |
84.37 |
95.64 |
Aug 2006 |
|
67.08 |
102.14 |
83.76 |
95.54 |
Sep 2006 |
|
67.84 |
104.75 |
84.80 |
97.91 |
Oct 2006 |
|
69.11 |
107.25 |
86.33 |
99.89 |
Nov 2006 |
|
69.34 |
107.82 |
86.65 |
100.30 |
Dec 2006 |
|
68.82 |
106.39 |
86.05 |
99.20 |
Jan 2007 (P) |
|
69.77 |
107.70 |
87.20 |
100.86 |
Feb 2007 (P) |
|
69.88 |
107.71 |
87.29 |
100.77 |
Mar 2007 (P) |
|
69.70 |
107.41 |
87.26 |
100.94 |
Apr 2007 (P) |
|
72.18 |
111.59 |
90.32 |
103.83 |
May 2007 (P) |
|
74.64 |
115.34 |
– |
– |
Jun 2007 (P) |
|
74.83 |
115.39 |
– |
– |
July 26, 2007 (P) |
|
74.80 |
115.66 |
– |
– |
– : not available. P : Provisional. NEER : Nominal Effective Exchange Rate.
REER : Real Effective Exchange Rate.
Note: Rise in indices indicates appreciation of the Indian rupee and vice versa. |
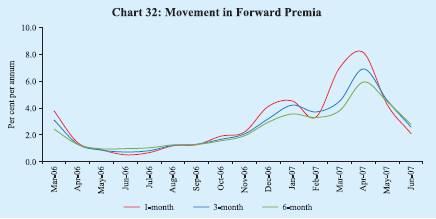
Forward premia declined during the first quarter of 2006-07, mirroring the decline in domestic overnight interest rates. The one-month forward premia declined from 6.99 per cent in March 2007 to 2.10 per cent in June 2007, while the six-month forward premia declined from 3.80 per cent to 2.79 per cent over the same period (Chart 32).
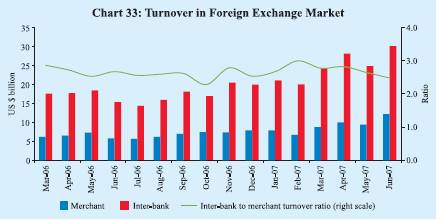
The average daily turnover in the foreign exchange market increased to US $ 38.2 billion during April-June 2007 from US $ 23.6 billion in the corresponding period of 2006. While the inter-bank turnover increased from US $ 17.1 billion to US $ 27.7 billion, the merchant turnover increased from US $ 6.5 billion to US $ 10.5 billion (Chart 33). The ratio of inter-bank to merchant turnover at 2.6 during April-June 2007 was the same as a year ago.
Credit Market
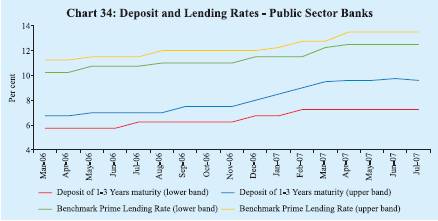
The deposit and lending rates of scheduled commercial banks (SCBs) increased further during the first quarter of 2007-08. However, there was some softening in deposit rates in July 2007, particularly at the short-end of the maturity spectrum. Interest rates of public sector banks (PSBs) on deposits of maturity of one year to three years were placed in the range of 7.25-9.60 per cent in July 2007 as compared with 7.25-9.50 per cent in March 2007, while those on deposits of maturity of above three years were placed in the range of 7.75-9.60 per cent in July 2007 as compared with 7.50-9.50 per cent in March 2007 (Table 43 and Chart 34).
The weighted average benchmark prime lending rate (BPLR) of public sector banks increased from 10.7 per cent in March 2006 and 12.4 per cent in March 2007 to 13.1 per cent in July 2007. The weighted average BPLR of private sector banks increased from 12.4 per cent in March 2006 and 14.1 per cent in March 2007 to 14.9 per cent in July 2007. The weighted average BPLR of foreign banks rose from 12.7 per cent in March 2007 to 13.9 per cent in July 2007.
Table 43: Deposit and Lending Rates |
(Per cent) |
Interest Rate |
March |
March |
March |
March |
June |
July |
|
|
2004 |
2005 |
2006 |
2007 |
2007 |
2007 |
# |
1 |
2 |
3 |
4 |
5 |
6 |
7 |
|
1. |
Domestic Deposit Rate |
|
|
|
|
|
|
|
|
Public Sector Banks |
|
|
|
|
|
|
|
|
Up to 1 year |
3.75-5.25 |
2.75-6.00 |
2.25-6.50 |
2.75-8.75 |
2.75-8.75 |
2.75-8.50 |
|
More than 1 year and up to 3 years |
5.00-5.75 |
4.75-6.50 |
5.75-6.75 |
7.25-9.50 |
7.25-9.75 |
7.25-9.60 |
|
More than 3 years |
5.26-6.00 |
5.25-7.00 |
6.00-7.25 |
7.50-9.50 |
7.75-9.75 |
7.75-9.60 |
|
Private Sector Banks |
|
|
|
|
|
|
|
|
Up to 1 year |
5.00-6.50 |
3.00-6.25 |
3.50-7.25 |
3.00-9.00 |
3.00-9.50 |
1.00-9.25 |
|
More than 1 year and up to 3 years |
5.00-6.50 |
5.25-7.25 |
5.50-7.75 |
6.75-9.75 |
6.75-10.25 |
6.75-10.25 |
|
More than 3 years |
5.25-7.00 |
5.75-7.00 |
6.00-7.75 |
7.75-9.60 |
7.50-10.00 |
7.50-10.00 |
|
Foreign Banks |
|
|
|
|
|
|
|
|
Up to 1 year |
2.75-7.75 |
3.00-6.25 |
3.00-6.15 |
3.00-9.50 |
0.25-9.00 |
0.25-8.50 |
|
More than 1 year and up to 3 years |
3.25-8.00 |
3.50-6.50 |
4.00-6.50 |
3.50-9.50 |
3.50-9.50 |
2.50-9.00 |
|
More than 3 years |
3.25-8.00 |
3.50-7.00 |
5.50-6.50 |
4.05-9.50 |
4.05-9.50 |
2.50-9.50 |
2. |
Benchmark Prime Lending Rate |
|
|
|
|
|
|
|
|
Public Sector Banks |
10.25-11.50 |
10.25-11.25 |
10.25-11.25 |
12.25-12.75 |
12.50-13.50 |
12.50-13.50 |
|
Private Sector Banks |
10.50-13.00 |
11.00-13.50 |
11.00-14.00 |
12.00-16.50 |
13.00-17.25 |
13.00-17.25 |
|
Foreign Banks |
11.00-14.85 |
10.00-14.50 |
10.00-14.50 |
10.00-15.50 |
10.00-15.50 |
10.00-15.50 |
3. |
Actual Lending Rate* |
|
|
|
|
|
|
|
|
Public Sector Banks |
4.00-16.00 |
2.75-16.00 |
4.00-16.50 |
4.00-17.00 |
– |
|
– |
|
Private Sector Banks |
4.50-22.00 |
3.15-22.00 |
3.15-20.50 |
3.15-25.50 |
– |
|
– |
|
Foreign Banks |
3.75-23.00 |
3.55-23.50 |
4.75-26.00 |
5.00-26.50 |
– |
|
– |
– : Not available.
# : As on July 25, 2007.
* : Interest rate on non-export demand and term loans above Rs.2 lakh excluding lending rates at the
extreme five per cent on both sides. |
Government Securities Market
The yields in the Government securities market initially hardened during the first quarter of 2007-08, partly reflecting global trends and announcement of an unscheduled auction (Chart 35). Subsequently, yields eased from mid-June 2007 onwards. The 10-year yields moved in a range of 7.80-8.41 per cent during 2007-08 (up to July 26, 2007). The 10-year yield was 7.89 per cent as on July 26, 2007, 8 basis points lower than that at end-March 2007.
The spread between 1-10 year yields was 65 basis points at end-June 2007 as compared with 42 basis points at end-March 2007. The spread between
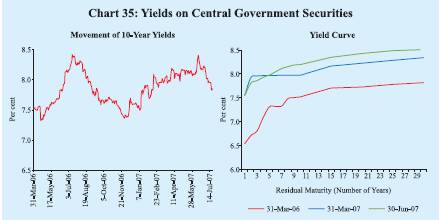
10-year and 30-year yields was 31 basis points at end-June 2007 (37 basis points at end-March 2007).
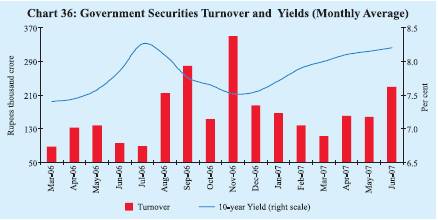
The daily turnover in the Government securities market averaged Rs. 5,109 crore during April-June 2007, which was 25.6 per cent higher than that in the preceding quarter (Chart 36).
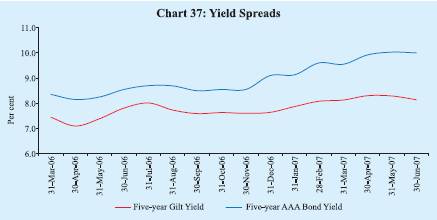
The yield spread between 5-year AAA-rated bonds and 5-year Government securities widened to 186 basis points at end-June 2007 from 142 basis points at end-March 2007 (Chart 37).
Equity Market
Primary Market
Resources raised through the domestic public issues aggregated Rs.23,851 crore during April-June 2007, an increase of 124.1 per cent over the corresponding period of 2006 (Table 44). The average size of public issues increased from Rs.426 crore during April-June 2006 to Rs.994 crore during April-June 2007. All the 24 public issues during April-June 2007 were in the form of equity, of which, 20 were initial public offerings (IPOs) accounting for 54.8 per cent of total resource mobilisation.
Mobilisation of resources through private placement increased by 50.9 per cent to Rs.1,45,571 crore during 2006-07 over the previous year (Table 44). This was mainly on account of more than doubling of resources mobilised by private sector entities to Rs.84,387 crore, while resources raised by public sector
Table 44: Mobilisation of Resources from the Primary Market |
(Amount in Rupees crore) |
Item |
2006-07 (April-June) |
2007-08 (April-June) P |
|
No. of Issues |
|
Amount |
No. of Issues |
Amount |
1 |
2 |
|
3 |
4 |
5 |
A. Prospectus and Rights Issues* |
|
|
|
|
|
|
1. |
Private Sector (a+b) |
25 |
|
10,642 |
23 |
23,324 |
|
|
a) |
Financial |
1 |
|
15 |
1 |
10,063 |
|
|
b) |
Non-financial |
24 |
|
10,627 |
22 |
13,261 |
|
2. |
Public Sector (a+b+c) |
– |
|
– |
1 |
527 |
|
|
a) |
Public Sector Undertakings |
– |
|
– |
1 |
527 |
|
|
b) |
Government Companies |
– |
|
– |
– |
– |
|
|
c) |
Banks/Financial Institutions |
– |
|
– |
– |
– |
|
3. |
Total (1+2) |
25 |
|
10,642 |
24 |
23,851 |
|
|
of which: |
|
|
|
|
|
|
|
(i) |
Equity |
25 |
|
10,642 |
24 |
23,851 |
|
|
(ii) |
Debt |
– |
|
– |
– |
– |
|
|
|
|
|
2005-06 |
|
2006-07 |
|
B. |
Private Placement |
|
|
|
|
|
|
1. |
Private Sector |
946 |
|
41,190 |
1,539 |
84,387 |
|
|
a) |
Financial |
375 |
|
26,463 |
649 |
51,321 |
|
|
b) |
Non-financial |
571 |
|
14,727 |
890 |
33,066 |
|
2. |
Public Sector |
169 |
|
55,283 |
139 |
61,184 |
|
|
a) |
Financial |
137 |
|
39,165 |
108 |
49,026 |
|
|
b) |
Non-financial |
32 |
|
16,119 |
31 |
12,158 |
|
3. |
Total (1+2) |
1,115 |
|
96,473 |
1,678 |
1,45,571 |
|
|
of which: |
|
|
|
|
|
|
|
(i) |
Equity |
1 |
|
150 |
1 |
57 |
|
|
(ii) Debt |
1,114 |
|
96,323 |
1,677 |
1,45,514 |
Memo: |
C. |
Euro Issues |
21 |
|
5,786 |
3 |
1,251 |
P : Provisional. * : Excluding offers for sale. – : Nil/Negligible. |
entities increased by only 10.7 per cent. Resource mobilisation by financial intermediaries (both from public sector and private sector) increased by 52.9 per cent to Rs.1,00,347 crore accounting for 68.9 per cent of total resource mobilisation during 2006-07 (68.0 per cent a year ago).
Resources raised through euro issues - American Depository Receipts (ADRs) and Global Depository Receipts (GDRs) - by Indian corporates during April-June 2007 at Rs.1,251 crore were lower than the corresponding period of previous year.
During April-June 2007, net mobilisation of resources by mutual funds was Rs.51,450 crore, a decline of 1.2 per cent over the corresponding period of 2006 (Table 45). Bulk of the net mobilisation of funds (55.0 per cent of total) was under debt-oriented schemes followed by liquid/money market-oriented schemes (36.2 per cent). Growth/equity-oriented schemes accounted for 4.7 per cent of the net mobilisation of funds.
Secondary Market
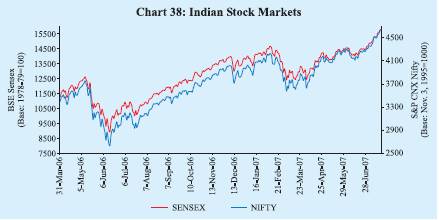
The domestic stock markets recorded gains during the first quarter of 2007- 08 (Chart 38). Liquidity support from foreign institutional investors (FIIs) and mutual funds, buoyant growth and strong corporate profitability provided support to the domestic stock markets. During 2007-08 (up to July 26, 2007), the BSE Sensex moved in a range of 12455-15795 with a record high of 15795 on July 24, 2007. The S&P CNX Nifty also reached a record high of 4621 on July 24, 2007. The BSE Sensex closed at 15776 on July 26, 2007, an increase of 20.7 per cent over end-March 2007.
Profits after tax of sampled companies increased by 45.2 per cent during 2006-07 (24.2 per cent during 2005-06) (see Table 11). According to the data released by the Securities and Exchange Board of India (SEBI), FIIs have invested
Table 45: Resource Mobilisation by Mutual Funds |
(Rupees crore) |
|
April-March |
April-June |
Mutual Fund |
2006-07 |
2006-07 |
|
2007-08 |
|
Net
Mobilis
ation @ |
Net Assets # |
Net Mobilis
ation @ |
Net Assets # |
Net Mobilis
ation @ |
Net
Assets # |
1 |
2 |
3 |
4 |
5 |
6 |
7 |
Private Sector |
79,038 |
2,62,079 |
43,039 |
2,11,225 |
48,542 |
3,29,421 |
Public Sector * |
14,947 |
64,213 |
9,013 |
54,309 |
2,908 |
71,421 |
Total |
93,985 |
3,26,292 |
52,052 |
2,65,534 |
51,450 |
4,00,842 |
@ : Net of redemptions. # : End-period. * : Including UTI Mutual fund.
Note : Data exclude funds mobilised under Fund of Funds Schemes.
Source : Securities and Exchange Board of India. |
Rs.36,438 crore (US $ 8.8 billion) in the Indian stock markets during 2007-08 so far (up to July 25, 2007) as against net sales of Rs.6,084 crore (US $ 1.3 billion) during the corresponding period of the previous year (Chart 39). Mutual funds have made net investments of Rs.1,759 crore during 2007-08 so far (up to July 25, 2007) as compared with net investments of Rs.8,538 crore during the corresponding period of the last year.
The gains in the domestic stock markets during 2007-08 (up to July 24, 2007) were led by capital goods, metal, banking, oil and gas, PSU and consumer durables stocks (Table 46).
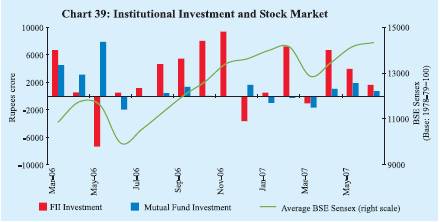
Table 46: BSE Sectoral Stock Indices |
Sector |
|
Variation (per cent) |
|
|
End-March
2006@ |
End-March
2007@ |
July 24,
2007 $ |
1 |
2 |
3 |
4 |
Auto |
101.2 |
-8.5 |
5.3 |
Bankex |
36.8 |
24.3 |
27.7 |
BSE 500 |
65.2 |
9.7 |
24.6 |
BSE Sensex |
73.7 |
15.9 |
20.8 |
Capital Goods |
156.0 |
11.1 |
51.7 |
Consumer Durables |
115.4 |
11.1 |
18.2 |
Fast Moving Consumer Goods |
109.9 |
-21.3 |
6.0 |
Health Care |
51.2 |
-5.4 |
3.5 |
Information Technology |
49.2 |
21.6 |
1.3 |
Metal |
40.3 |
-4.3 |
45.7 |
Oil and Gas |
61.1 |
30.5 |
27.9 |
Public Sector Undertakings |
44.0 |
-3.2 |
23.1 |
@ : year-on-year variation. $ : variation over end-March 2007.
Source : Bombay Stock Exchange Limited. |
Reflecting the upward trend in stock prices, the price-earnings (P/E) ratios of the 30 scrips included in the BSE Sensex rose from 20.3 at end-March 2007 to 21.1 by end-June 2007 (Table 47). The market capitalisation of the BSE increased by 17.6 per cent between end-March 2007 and end-June 2007. The volatility in the stock market declined during April-June 2007. The combined turnover of BSE and NSE in the cash and derivative segments during April-June 2007 was higher by 7.3 per cent and 7.8 per cent, respectively, than the corresponding period of 2006.
Table 47: Stock Market Indicators |
Indicator |
BSE |
NSE |
|
|
2005-06 |
2006-07 |
Apr-June |
2005-06 |
2006-07 |
Apr-June |
|
|
|
|
2006 |
2007 |
|
|
2006 |
2007 |
1 |
|
2 |
3 |
4 |
5 |
6 |
7 |
8 |
9 |
1. |
BSE Sensex / S&P CNX Nifty |
|
|
|
|
|
|
|
|
|
(i) End-period |
11280 |
13072 |
10609 |
14651 |
3403 |
3822 |
3128 |
4318 |
|
(ii) Average |
8280 |
12277 |
11032 |
13998 |
2513 |
3572 |
3263 |
4121 |
2. |
Coefficient of Variation |
16.7 |
11.1 |
9.0 |
3.6 |
15.6 |
10.4 |
9.6 |
3.9 |
3. |
Price-Earning Ratio |
|
|
|
|
|
|
|
|
|
(end-period)* |
20.9 |
20.3 |
19.4 |
21.1 |
20.3 |
18.4 |
18.4 |
20.6 |
4. |
Price-Book Value Ratio* |
5.1 |
5.1 |
4.4 |
4.8 |
5.2 |
4.9 |
4.7 |
5.4 |
5. |
Yield* (per cent |
|
|
|
|
|
|
|
|
|
per annum) |
1.2 |
1.3 |
1.5 |
1.1 |
1.3 |
1.3 |
1.5 |
1.1 |
6. |
Number of Listed Companies |
4,781 |
4,821 |
4,793 |
4,842 |
1,069 |
1,228 |
1,099 |
1,283 |
7. |
Cash Segment Turnover |
|
|
|
|
|
|
|
|
|
(Rupees crore) |
8,16,074 |
9,56,185 |
2,55,320 |
2,72,782 |
15,69,556 |
19,45,285 |
5,29,831 |
5,69,800 |
8. |
Derivative Segment |
|
|
|
|
|
|
|
|
|
Turnover (Rupees crore) |
9 |
59,007 |
19 |
50,357 |
48,24,174 |
73,56,242 |
20,37,019 |
21,46,272 |
9. |
Market Capitalisation |
|
|
|
|
|
|
|
|
|
(Rupees crore) @ |
30,22,191 |
35,45,041 |
27,21,678 |
41,68,272 |
28,13,201 |
33,67,350 |
25,24,659 |
39,78,381 |
* : Based on 30 scrips included in the BSE Sensex and 50 scrips included in the S&P CNX Nifty.
@ : End-period.
Source : Bombay Stock Exchange Ltd. (BSE) and National Stock Exchange of India Ltd. (NSE). |
|
 IST,
IST,


