International Financial Markets
During the second quarter of 2007-08 (July-September), international financial markets turned volatile as uncertainties about the size and distribution of losses from the US sub-prime mortgage market made investors to adjust their positions. The fallout from strains in the US sub-prime mortgage market led to spikes in yields on structured credit vehicles and in other high risk credit markets, particularly in the US and the Euro area. Rising concerns about counterparty risks led to a drying up of liquidity in various segments of the financial market which forced major central banks to step in to inject liquidity to manage volatility. The losses, though concentrated in the US, dispersed globally to European and Asian investors holding asset-backed securities and collateralised debt obligations. Within Asia, exposure was reported to be concentrated in Japan, China, Taiwan Province of China, South Korea and Australia. Uncertainty over the location and scale of exposures induced a widespread ‘safe-haven’ demand for short maturity Government paper for collateral and investment purposes. As a result, long-term bond yields softened. Global equity markets recorded further gains, albeit with intermittent corrections. In the currency markets, the US dollar depreciated against major currencies.
Central banks in the US and other affected economies have undertaken measures by injecting liquidity to stabilise inter-bank markets. Open market operations of increased size and maturity were undertaken by the Bank of England, the European Central Bank (ECB) and the US Federal Reserve System. Central bank actions have, to some extent, stabilised short-term inter-bank markets but appetite for asset-backed commercial paper (ABCP) may take some time to return.
According to IMF’s assessment in October 20071, notwithstanding the recent volatility and the ‘extremely turbulent correction’, an underlying resilience in the advanced economies lay in the form of the strong balance sheets and capital positions of core financial institutions, the high profitability and generally low leverage of the corporate sector, healthy situation in labour markets and household net wealth. Emerging market economies (EMEs) have generally been less affected by turbulence in the advanced economies. The resilience of these economies reflected absence of innovative credit instruments and institutional structures prevalent in the advanced economies as well as strengthening of public balance sheets and policy frameworks, thereby reducing their external vulnerabilities. Nevertheless, financial market conditions continue to pose a major source of downside risk to the global outlook. Furthermore, although emerging markets have been less affected so far, some of them have become dependent on large external financing and may get adversely affected if a fuller re-pricing of risk and tightening of lending standards, and a general increase in risk aversion were to take place in the wake of continued turbulent conditions.
Several central banks such as the Bank of England, Bank of Canada, Reserve Bank of Australia, Reserve Bank of New Zealand, Sveriges Riksbank (Sweden), Norges Bank (Norway), People’s Bank of China, Bank of Korea and South African Reserve Bank raised their policy rates further during the quarter ended September 2007 to contain inflation and stabilise inflationary expectations. Money market rates hardened further during the quarter ended September 2007 in a number of economies on account of elevated volatility in financial markets (Table 36). On the other hand, short-term interest rates in the US declined reflecting the cut in the fed funds target rate by 50 basis points to 4.75 per cent on September 18, 2007. The fed funds rate cut in the US was the first after a series of 17 consecutive rate hikes by the Federal Reserve Board from June 2004 to June 2006 followed by a pause up to August 2007. Short-term rates eased in a few EMEs such as Brazil and Thailand, as central banks in these countries continued to cut policy rates to support growth. Bangko Sentral ng Pilipinas (Philippines) lowered its key policy rates, i.e., overnight borrowing rate and overnight lending rate by 25 basis points each to 5.75 per cent and 7.75 per cent, respectively, on October 4, 2007.
In contrast to money market interest rates, long-term Government bond yields softened in major advanced economies during the second quarter of 2007-08, reversing the increasing trend of the first quarter (Chart 26). Decline in bond yields reflected lower investor appetite for riskier assets in the wake of deteriorating housing market and turmoil in the credit market. Between end-June 2007 and end-September 2007, 10-year yield declined by 46 basis points in the US, 35 basis points in the UK,
Table 36: Short-term Interest Rates |
(Per cent) |
Region/Country |
At end of |
|
March
2006 |
March
2007 |
June
2007 |
September
2007 |
October
2007* |
1 |
2 |
3 |
4 |
5 |
6 |
Advanced Economies |
Euro Area |
2.80 |
3.91 |
4.16 |
4.73 |
4.66 |
Japan |
0.04 |
0.57 |
0.63 |
0.73 |
0.73 |
Sweden |
1.99 |
3.21 |
3.42 |
3.54 |
3.74 |
UK |
4.58 |
5.55 |
5.92 |
6.28 |
6.25 |
US |
4.77 |
5.23 |
5.27 |
4.72 |
4.72 |
Emerging Market Economies |
Argentina |
9.63 |
9.63 |
9.25 |
12.31 |
12.94 |
Brazil |
16.54 |
12.68 |
11.93 |
11.18 |
11.18 |
China |
2.40 |
2.86 |
3.08 |
3.86 |
3.87 |
Hong Kong |
4.47 |
4.17 |
4.43 |
4.97 |
5.45 |
India |
6.11 |
7.98 |
7.39 |
7.19 |
7.10 |
Malaysia |
3.51 |
3.64 |
3.62 |
3.62 |
3.62 |
Philippines |
7.38 |
5.31 |
6.19 |
6.94 |
6.63 |
Singapore |
3.44 |
3.00 |
2.55 |
2.56 |
2.50 |
South Korea |
4.26 |
4.94 |
5.03 |
5.34 |
5.34 |
Thailand |
5.10 |
4.45 |
3.75 |
3.55 |
3.55 |
* : As on October 17, 2007.
Note : Data for India refer to 91-day Treasury Bills rate and for other
countries 3-month money market rates.
Source : The Economist. |
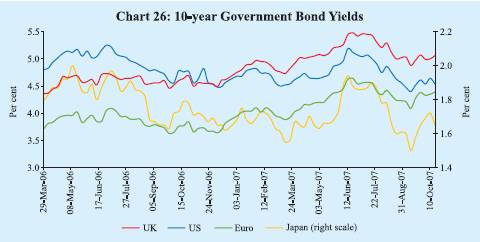
21 basis points in Japan and 16 basis points in the Euro area. Between end-March 2007 and October 17, 2007, 10-year yield declined by 8 basis points in the US and 2 basis points in Japan, while these increased by 36 basis points in the Euro area and 14 basis points in the UK. Higher long-term bond yields in the UK and Euro area reflected higher short-term rates and better growth prospects.
Global equity markets recorded further gains during the second quarter of 2007-08, amidst intermittent corrections. Robust corporate earnings, buoyant merger and acquisition activity and increased risk appetite buoyed equity markets in major emerging market economies (Chart 27). However, factors such as slump in the US home sales and rising concerns about the US mortgage and corporate lending
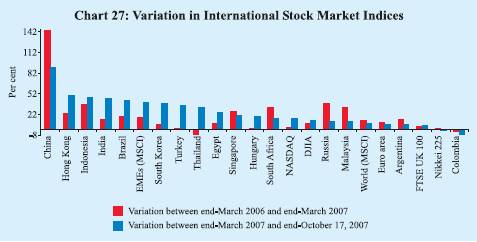
Table 37: Appreciation (+)/Depreciation (-) of the US dollar
vis-à-vis other Currencies |
(Per cent) |
Currency |
End-March
2006 @ |
End-March
07 @ |
October 19,
2007 * |
1 |
2 |
3 |
4 |
Euro |
7.1 |
-9.1 |
-6.8 |
Pound Sterling |
8.5 |
-11.4 |
-4.4 |
Japanese Yen |
9.4 |
0.2 |
-2.2 |
Chinese Yuan |
-3.1 |
-3.4 |
-2.9 |
Russian Rubble |
-0.6 |
-6.1 |
-4.5 |
Turkish Lira |
-2.0 |
3.2 |
-13.6 |
Indian Rupee |
2.2 |
-2.5 |
-8.7 |
Indonesian Rupiah |
-4.3 |
0.5 |
-1.1 |
Malaysian Ringgit |
-3.0 |
-6.2 |
-2.7 |
South Korean Won |
-4.7 |
-3.7 |
-2.4 |
Thai Baht |
-0.7 |
-9.9 |
-2.4 |
Argentine Peso |
5.4 |
0.7 |
2.0 |
Brazilian Peso |
-18.1 |
-6.4 |
-12.0 |
Mexican Peso |
-2.6 |
1.3 |
-2.1 |
South African Rand |
-0.5 |
17.2 |
-6.8 |
@ : Year-on-year variation. * : Variation over end-March 2007. |
markets, increase in international crude oil prices, surge in China’s inflation rate and contraction in Japan’s economy affected the market sentiment intermittently. Between end-March 2007 and October 17, 2007, the MSCI World and MSCI emerging market indices increased by 9.4 per cent and 40.1 per cent, respectively. These gains in the stock markets were led by China (90.0 per cent), Hong Kong (49.8 per cent), Indonesia (46.7 per cent), India (45.3 per cent), Brazil (42.1 per cent), South Korea (37.8 per cent), Turkey (34.5 per cent) and Thailand (32.2 per cent).
In the foreign exchange market, the US dollar has depreciated against major currencies during 2007-08 so far (up to October 19, 2007), reflecting worries in the mortgage market, falling housing sales in the US and weakening consumer confidence. While the pound sterling strengthened against the US dollar and reached a 25-year high level during July 2007, Japanese yen appreciated against US dollar as a result of unwinding of Yen carry trade. Between end-March 2007 and October 19, 2007, the US dollar depreciated by 6.8 per cent against the euro, 4.4 per cent against the Pound sterling and 2.2 per cent against the yen. Amongst the Asian currencies, the US dollar depreciated by 2.9 per cent against Chinese Yuan, 2.7 per cent against the Malaysian Ringgit, 2.4 per cent against Thai Baht and 2.4 per cent against South Korean won (Table 37).
Domestic Financial Markets
Indian financial markets remained orderly for the most part of the second quarter of 2007-08. The call money rate, which had remained below the reverse repo rate during June-July 2007 on the back of the easing of liquidity conditions and prevalence of a ceiling on absorption through reverse repo operations under
Table 38: Domestic Financial Markets at a Glance |
Year/ Month |
Call Money |
Government
Securities |
Foreign Exchange |
Liquidity
Management |
Equity |
|
Aver
age
Daily
Turn
over
(Rs.
crore) |
Aver
age
Call
Rates*
(Per
cent) |
Aver
age
Turn
over
in
Govt
Securities
(Rs.
crore)+ |
Aver
age 10-Year
Yield
@
Per
cent) |
Ave
rage
Daily
Inter-bank
Turnover (US $
million) |
Average
Ex
change Rate
(Rs.
per
US $) |
RBI’s
net
Foreign
Currency
Sales
(-)/
Purchases
(+)
(US $
million) |
Ave
rage3-
month
Forward
Premia
(Per
cent) |
Average MSS
Out-
standing
#
(Rs.
crore) |
Average
Daily
LAF
Out- standing (Rs crore) |
Average Daily
BSE
Turnover (Rs. crore) |
Average Daily
NSE
Turnover (Rs.
crore) |
Ave
rage
BSE
Sensex
**
|
Ave
rage
S&P
CNX
Nifty
** |
1 |
2 |
3 |
4 |
5 |
6 |
7 |
8 |
9 |
10 |
11 |
12 |
13 |
14 |
15 |
2004-
05 |
14,170 |
4.65 |
4,826 |
6.22 |
8,892 |
44.93 |
20,847 ## |
1.66 |
46,445 |
35,592 |
2,050 |
4,506 |
5741 |
1805 |
2005-
06 |
17,979 |
5.60 |
3,643 |
7.12 |
12,738 |
44.27 |
8,143 ## |
1.60 |
58,792 |
10,986 |
3,248 |
6,253 |
8280 |
2513 |
2006-07 |
21,725 |
7.22 |
4,863 |
7.78 |
18,717 |
45.25 |
26,824## |
2.14 |
37,698 |
21,973 |
3,865 |
7,812 |
12277 |
3572 |
Mar 2006 |
18,290 |
6.58 |
2,203 |
7.40 |
17,600 |
44.48 |
8,149 |
3.11 |
29,652 |
-6,319 |
5,397 |
9,518 |
10857 |
3236 |
Apr 2006 |
16,909 |
5.62 |
3,685 |
7.45 |
17,712 |
44.95 |
4,305 |
1.31 |
25,709 |
46,088 |
4,860 |
9,854 |
11742 |
3494 |
May 2006 |
18,074 |
5.54 |
3,550 |
7.58 |
18,420 |
45.41 |
504 |
0.87 |
26,457 |
59,505 |
4,355 |
9,155 |
11599 |
3437 |
Jun 2006 |
17,425 |
5.73 |
2,258 |
7.86 |
15,310 |
46.06 |
0 |
0.73 |
31,845 |
48,610 |
3,130 |
6,567 |
9935 |
2915 |
Jul 2006 |
18,254 |
5.86 |
2,243 |
8.26 |
14,325 |
46.46 |
0 |
0.83 |
36,936 |
48,027 |
2,604 |
5,652 |
10557 |
3092 |
Aug 2006 |
21,294 |
6.06 |
5,786 |
8.09 |
15,934 |
46.54 |
0 |
1.22 |
40,305 |
36,326 |
2,867 |
5,945 |
11305 |
3306 |
Sep 2006 |
23,665 |
6.33 |
8,306 |
7.76 |
18,107 |
46.12 |
0 |
1.31 |
40,018 |
25,862 |
3,410 |
6,873 |
12036 |
3492 |
Oct 2006 |
26,429 |
6.75 |
4,313 |
7.65 |
16,924 |
45.47 |
0 |
1.67 |
41,537 |
12,983 |
3,481 |
6,919 |
12637 |
3649 |
Nov 2006 |
25,649 |
6.69 |
10,654 |
7.52 |
20,475 |
44.85 |
3,198 |
2.07 |
38,099 |
9,937 |
4,629 |
8,630 |
13434 |
3869 |
Dec 2006 |
24,168 |
8.63 |
5,362 |
7.55 |
19,932 |
44.64 |
1,818 |
3.20 |
38,148 |
-1,713 |
4,276 |
8,505 |
13628 |
3910 |
Jan 2007 |
22,360 |
8.18 |
4,822 |
7.71 |
21,171 |
44.33 |
2,830 |
4.22 |
39,553 |
-10,738 |
4,379 |
8,757 |
13984 |
4037 |
Feb 2007 |
23,254 |
7.16 |
4,386 |
7.90 |
20,298 |
44.16 |
11,862 |
3.71 |
40,827 |
648 |
4,675 |
9,483 |
14143 |
4084 |
Mar 2007 |
23,217 |
14.07 |
2,991 |
8.00 |
25,992 |
44.03 |
2,307 |
4.51 |
52,944 |
-11,858 |
3,715 |
7,998 |
12858 |
3731 |
Apr 2007 |
29,689 |
8.33 |
4,636 |
8.10 |
28,131 P |
42.15 |
2,055 |
6.91 |
71,468 |
-8,937 |
3,935 |
8,428 |
13478 |
3947 |
May 2007 |
20,476 |
6.96 |
4,442 |
8.15 |
24,843 P |
40.78 |
4,426 |
4.58 |
83,779 |
-6,397 |
4,706 |
9,885 |
14156 |
4184 |
Jun 2007 |
16,826 |
2.42 |
6,250 |
8.20 |
30,132 P |
40.77 |
3,192 |
2.59 |
83,049 |
1,689 |
4,537 |
9,221 |
14334 |
4222 |
Jul 2007 |
16,581 |
0.73 |
13,273 |
7.94 |
32,254 P |
40.41 |
11,428 |
1.12 |
82,996 |
2,230 |
5,684 |
12,147 |
15253 |
4474 |
Aug 2007 |
23,603 |
6.31 |
6,882 |
7.95 |
33,400 P |
40.82 |
1,815 |
1.59 |
1,00,454 |
21,729 |
4,820 |
10,511 |
14779 |
4301 |
Sep 2007 |
21,991 |
6.41 |
5,859 |
7.92 |
36,557 P |
40.34 |
– |
1.45 |
1,17,674 |
16,558 |
6,157 |
13,302 |
16046 |
4660 |
* : Average of daily weighted call money borrowing rates.
+ : Average of daily outright turnover in Central Government dated securities.
@ : Average of daily closing rates. # : Average of weekly outstanding MSS.
** : Average of daily closing indices. ## : Cumulative for the financial year.
LAF : Liquidity Adjustment Facility. MSS : Market Stabilisation Scheme.
BSE : Bombay Stock Exchange Limited. NSE : National Stock Exchange of India Limited.
P : Provisional – : Not available.
Note : In column 11, (-) indicates injection of liquidity, while (+) indicates absorption of liquidity. |
the liquidity adjustment facility (LAF), reverted to the corridor set by the reverse repo and repo rates in August-September 2007 after removal of the reverse repo ceiling. Interest rates in the collateralised segment of the overnight money market also increased in tandem and remained below the call rate during the quarter. In the foreign exchange market, the Indian rupee generally appreciated vis-à-vis the US dollar during the quarter. Yields in the Government securities market softened. Banks’ deposit and lending rates softened during the second quarter particularly at the upper end of the range of various maturities. The stock markets remained buoyant and the benchmark indices reached record highs (Table 38). The primary market segment of the capital market witnessed increased activity in the second quarter of 2007-08.
Money Market
Money market rates eased during the first quarter of 2007-08 from their elevated levels witnessed in the second half of March 2007 (Chart 28). This trend continued in July 2007 with call money rates remaining below one per cent level for most of days and averaging 0.73 per cent for the month. In view of the prevailing
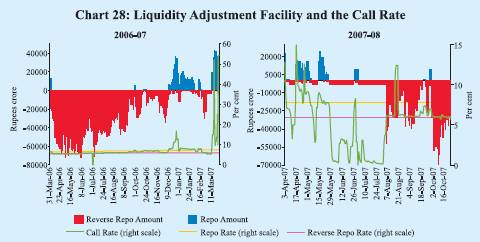
macroeconomic and overall monetary and liquidity conditions, the First Quarter Review of the Annual Statement on Monetary Policy for 2007-08 announced the withdrawal of the ceiling of Rs.3,000 crore on daily reverse repo under the LAF and the discontinuation of the Second LAF with effect from August 6, 2007. After the withdrawal of daily reverse repo ceiling, the weighted average rate in the call money market increased to 6.31 per cent during August 2007. Barring a few days in August 2007, call money rates have remained within the informal corridor set by reverse repo and repo rates. The call money rate was at 6.02 per cent on October 24, 2007.
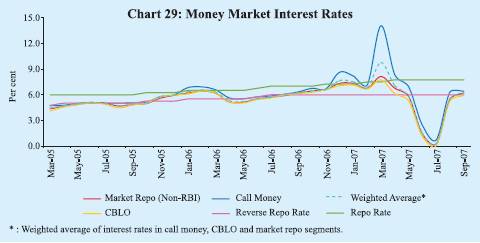
Interest rates in the collateralised segment of the money market – market repo (outside the LAF) and collateralised borrowing and lending obligation (CBLO) – increased in line with call rates, but remained lower than the call money rate during July-September 2007 (Chart 29). During July-September 2007, interest rates averaged 4.48 per cent, 3.74 per cent and 3.98 per cent, respectively, in the call, CBLO and market repo segments (6.08 per cent, 5.91 per cent and 5.93 per cent, respectively, a year ago). The weighted average rate in all the three money market segments combined together was 3.97 per cent during July-September 2007 (5.97 per cent a year ago).
The average daily total volumes in the call, CBLO and market repo (outside the LAF) segments during July-September 2007 were 48.4 per cent higher than those in the same period of 2006. The collateralised market remained the predominant segment of the money market, accounting for about 80 per cent of the total volume during the second quarter of 2007-08 (Table 39). In both the CBLO and market repo segments, mutual funds have been the major lenders, while banks and primary dealers (PDs) have been the major borrowers.
Certificates of Deposit
The outstanding amount of certificates of deposit (CDs) increased from Rs.93,272 crore at end-March 2007 (4.8 per cent of aggregate deposits of issuing banks) to Rs. 1,13,892 crore (5.9 per cent of deposits) by September 14, 2007 (Table 39). Most of the CDs issued were of 12-month duration. As on September 14, 2007, the weighted average discount rate (WADR) declined to 8.64 per cent from 9.37 per cent at end-June 2007 (10.75 per cent as at end-March 2007) in tandem with the decline in other money market rates.
Commercial Paper
Issuances of commercial paper (CP) increased in the second quarter of 2007-08. Outstanding CP rose from Rs. 17,838 crore at end-March 2007 to Rs.33,227 crore by September 15, 2007 (Table 39). The weighted average discount rate (WADR) on CP declined to 8.84 per cent as on September 15, 2007 from 8.93 per cent at end-June 2007 (11.33 per cent at end-March 2007) following easy liquidity conditions in short-term money market. The most preferred maturity of CP was for periods ranging from ‘61 to 90 days’ and ‘181 days and above’. Leasing and financing companies continued to be the major issuers of CP partly reflecting the policy decision to phase out the access of these companies to public deposits (Table 40).
Treasury Bills
The primary market yields on Treasury Bills (TBs) softened in July 2007, reflecting the trends in money market segments as well as fall in domestic inflation rate (Chart 30). TBs’ yields dipped on July 18, 2007, reflecting easy liquidity conditions and very low short term rates. The surplus liquidity in the
Table 39: Activity in Money Market Segments |
(Rupees crore) |
|
Average Daily Volume (One Leg) |
Commercial Paper |
Certificates of Deposit |
Year/ Month |
Call |
Repo |
Collateralised |
Total |
Term |
Outstanding |
WADR |
Outstanding |
WADR |
|
Money |
Market |
Borrowing |
(2+3+4) |
Money |
|
(per cent) |
|
(per cent) |
|
Market |
(Outside |
and Lending |
|
Market |
|
|
|
|
|
|
the LAF) |
Obligation
(CBLO) |
|
|
|
|
|
|
1 |
2 |
3 |
4 |
5 |
6 |
7 |
8 |
9 |
10 |
2004-05 |
7,085 |
4,284 |
3,349 |
14,718 |
263 |
11,723 |
5.34 |
6,052 |
– |
2005-06 |
8,990 |
5,296 |
10,020 |
24,306 |
417 |
17,285 |
6.46 |
27,298 |
– |
2006-07 |
10,863 |
8,419 |
16,195 |
35,477 |
506 |
21,372 |
8.08 |
65,021 |
8.23 |
Mar 2006 |
9,145 |
7,991 |
17,888 |
35,024 |
669 |
12,718 |
8.59 |
43,568 |
8.62 |
Apr 2006 |
8,455 |
5,479 |
16,329 |
30,263 |
447 |
16,550 |
7.30 |
44,059 |
7.03 |
May 2006 |
9,037 |
9,027 |
17,147 |
35,211 |
473 |
17,067 |
6.89 |
50,228 |
7.17 |
Jun 2006 |
8,713 |
10,563 |
13,809 |
33,085 |
628 |
19,650 |
7.10 |
56,390 |
7.19 |
Jul 2006 |
9,127 |
9,671 |
15,670 |
34,468 |
432 |
21,110 |
7.34 |
59,167 |
7.65 |
Aug 2006 |
10,647 |
7,764 |
15,589 |
34,000 |
510 |
23,299 |
7.31 |
65,621 |
7.77 |
Sep 2006 |
11,833 |
9,185 |
14,771 |
35,789 |
568 |
24,444 |
7.70 |
65,274 |
7.80 |
Oct 2006 |
13,214 |
9,721 |
16,964 |
39,899 |
466 |
23,171 |
7.77 |
65,764 |
7.73 |
Nov 2006 |
12,825 |
9,374 |
16,069 |
38,268 |
348 |
24,238 |
7.88 |
68,911 |
7.99 |
Dec 2006 |
12,084 |
7,170 |
15,512 |
34,766 |
481 |
23,536 |
8.52 |
68,619 |
8.28 |
Jan 2007 |
11,180 |
6,591 |
15,758 |
33,529 |
515 |
24,398 |
9.09 |
70,149 |
9.22 |
Feb 2007 |
11,627 |
7,794 |
19,063 |
38,484 |
467 |
21,167 |
10.49 |
72,795 |
9.87 |
Mar 2007 |
11,608 |
8,687 |
17,662 |
37,957 |
739 |
17,838 |
11.33 |
93,272 |
10.75 |
Apr 2007 |
14,845 |
7,173 |
18,086 |
40,104 |
440 |
18,759 |
10.52 |
95,980 |
10.75 |
May 2007 |
10,238 |
8,965 |
20,810 |
40,013 |
277 |
22,024 |
9.87 |
99,715 |
9.87 |
Jun 2007 |
8,413 |
10,295 |
20,742 |
39,450 |
308 |
26,256 |
8.93 |
98,337 |
9.37 |
Jul 2007 |
8,290 |
12,322 |
20,768 |
41,380 |
288 |
30,631 |
7.05 |
1,05,317 |
7.86 |
Aug 2007 |
11,802 |
16,688 |
26,890 |
55,380 |
319 |
31,527 |
8.30 |
1,09,224 |
8.67 |
Sep 2007 |
10,995 |
17,876 |
29,044 |
57,915 |
265 |
33,227* |
8.84* |
1,13,892+ |
8.64+ |
* : As on September 15, 2007. + : As on September 14, 2007. – : Not available.
WADR : Weighted Average Discount Rate. |
wake of ceiling of Rs. 3,000 crore in LAF reverse repo resulted in extremely low short-term rates and aggressive bidding in auctions of TBs and hence the lower auction cut-off. TBs’ yields hardened during August-September 2007 in tandem with higher money market interest rates and removal of the ceiling on absorption through reverse repo. The yield spread between 364-day and 91-day TBs widened to 40 basis points in September 2007 from 26 basis points in June 2007 (17 basis points in March 2007) (Table 41).
Table 40: Commercial Paper – Major Issuers |
(Rupees crore) |
Category of Issuer |
End of |
|
March 2006 |
March 2007 |
June 2007 |
September 2007* |
1 |
2 |
3 |
4 |
5 |
Leasing and Finance |
9,400 |
12,569 |
18,260 |
24,191 |
|
(73.9) |
(70.5) |
(69.5) |
(72.8) |
Manufacturing |
1,982 |
2,754 |
3,956 |
6,006 |
|
(15.6) |
(15.4) |
(15.1) |
(18.1) |
Financial Institutions |
1,336 |
2,515 |
4,040 |
3,030 |
|
(10.5) |
(14.1) |
(15.4) |
(9.1) |
Total |
12,718 |
17,838 |
26,256 |
33,227 |
|
(100.0) |
(100.0) |
(100.00) |
(100.00) |
* : As on September 15, 2007.
Note : Figures in parentheses are percentage shares in the total outstanding. |
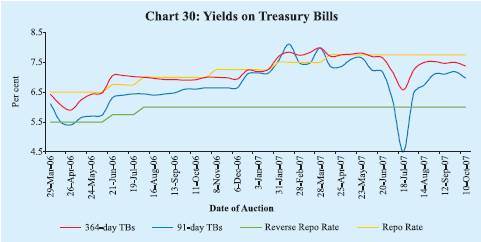
Table 41: Treasury Bills in the Primary Market |
Month |
Notified Amount
(Rupees crore) |
Average Implicit Yield at Minimum
Cut-off Price (Per cent) |
Average Bid-
Cover Ratio |
|
|
91-day |
182-day |
364-day |
91-day |
182-day |
364-day |
1 |
2 |
3 |
4 |
5 |
6 |
7 |
8 |
2004-05 |
1,38,500 @ |
4.91 |
– |
5.16 |
2.43 |
– |
2.52 |
2005-06 |
1,55,500 @ |
5.68 |
5.82 |
5.96 |
2.64 |
2.65 |
2.45 |
2006-07 |
1,86,500 @ |
6.64 |
6.91 |
7.01 |
1.97 |
2.00 |
2.66 |
Mar 2006 |
6,500 |
6.51 |
6.66 |
6.66 |
4.17 |
3.43 |
3.36 |
Apr 2006 |
5,000 |
5.52 |
5.87 |
5.98 |
5.57 |
4.96 |
2.02 |
May 2006 |
18,500 |
5.70 |
6.07 |
6.34 |
1.88 |
1.84 |
1.69 |
Jun 2006 |
15,000 |
6.15 |
6.64 |
6.77 |
1.63 |
1.35 |
2.11 |
Jul 2006 |
16,500 |
6.42 |
6.75 |
7.03 |
1.82 |
1.55 |
3.12 |
Aug 2006 |
19,000 |
6.41 |
6.70 |
6.96 |
2.03 |
2.71 |
3.48 |
Sep 2006 |
15,000 |
6.51 |
6.76 |
6.91 |
1.35 |
1.80 |
2.92 |
Oct 2006 |
15,000 |
6.63 |
6.84 |
6.95 |
1.31 |
1.20 |
2.02 |
Nov 2006 |
18,500 |
6.65 |
6.92 |
6.99 |
1.33 |
1.22 |
2.49 |
Dec 2006 |
15,000 |
7.01 |
7.27 |
7.09 |
1.19 |
1.29 |
3.34 |
Jan 2007 |
19,000 |
7.28 |
7.45 |
7.39 |
1.02 |
1.35 |
1.74 |
Feb 2007 |
15,000 |
7.72 |
7.67 |
7.79 |
2.48 |
2.56 |
3.16 |
Mar 2007 |
15,000 |
7.73 |
7.98 |
7.90 |
2.08 |
2.15 |
3.87 |
Apr 2007 |
15,000 |
7.53 |
7.87 |
7.72 |
2.87 |
3.36 |
3.16 |
May 2007 |
18,500 |
7.59 |
7.70 |
7.79 |
2.33 |
2.57 |
2.33 |
Jun 2007 |
35,000 |
7.41 |
7.76 |
7.67 |
3.23 |
4.11 |
3.97 |
Jul 2007 |
12,500 |
5.07 |
5.94 |
6.87 |
4.48 |
2.70 |
4.56 |
Aug 2007 |
20,500 |
6.74 |
7.37 |
7.42 |
2.11 |
1.41 |
2.46 |
Sep 2007 |
25,000 |
7.08 |
7.33 |
7.48 |
2.07 |
2.91 |
2.83 |
@ : Total for the financial year.
Note :
1. 182-day TBs were reintroduced with effect from April 2005.
2. Notified amounts are inclusive of issuances under the Market Stabilisation Scheme (MSS). |
Foreign Exchange Market
During the second quarter of 2007-08, the Indian rupee generally appreciated vis-à-vis the US dollar (Chart 31). Between end-March 2007 and October 24, 2007, the rupee moved in the range of Rs.39.31-43.15 per US dollar. The rupee, which had appreciated till end of May 2007, depreciated thereafter up to the last week of June 2007. The rupee, however, appreciated again from the first week of July 2007 and reached a level of Rs. 39.31 per US dollar on October 15, 2007 from its level of Rs. 43.60 per US dollar at end-March 2007. The rupee’s appreciation reflected, inter alia, large capital inflows and weakening of US dollar overseas against all the major currencies. The exchange rate of the rupee was Rs. 39.58 per US dollar as on October 24, 2007. At this level, the Indian rupee appreciated by 10.1 per cent vis-à-vis the US dollar over its level on March 31, 2007. Over the same period, the rupee appreciated by 5.6 per cent against the Pound sterling, 3.1 per cent against the Euro and 7.2 per cent against the Japanese yen.
The six-currency nominal effective exchange rate (NEER) and real effective exchange rate (REER) of the Indian rupee, on an average basis, appreciated by 6.3 per cent and 7.1 per cent, respectively, between March 2007 and September 2007. The six-currency NEER and REER appreciated further by 1.1 per cent and 1.3 per cent, respectively, between end-September 2007 and October 15, 2007. The 36-currency NEER and REER of the Indian rupee, on an average basis, appreciated by 6.8 per cent and 6.9 per cent, respectively, between March 2007 and July 2007 (Table 42).
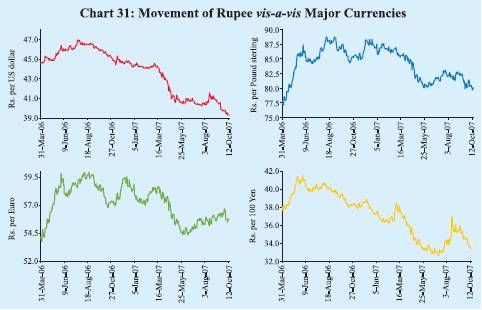
Table 42: Nominal and Real Effective Exchange Rate of the
Indian Rupee (Trade-Based Weights) |
|
Base : 1993-94 (April-March) = 100 |
Year/Month |
6-Currency Weights |
36-Currency Weights |
|
NEER |
REER |
NEER |
REER |
1 |
2 |
3 |
4 |
5 |
|
|
|
|
|
1993-94 |
100.00 |
100.00 |
100.00 |
100.00 |
2000-01 |
77.43 |
102.82 |
92.12 |
100.09 |
2001-02 |
76.04 |
102.71 |
91.58 |
100.86 |
2002-03 |
71.27 |
97.68 |
89.12 |
98.18 |
2003-04 |
69.97 |
99.17 |
87.14 |
99.56 |
2004-05 |
69.58 |
101.78 |
87.31 |
100.09 |
2005-06 |
72.28 |
107.30 |
89.85 |
102.35 |
2006-07 (P) |
68.93 |
105.47 |
85.88 |
98.50 |
Mar |
2006 |
72.45 |
107.41 |
89.52 |
101.25 |
Apr |
2006 |
71.04 |
105.75 |
87.73 |
98.22 |
May |
2006 |
68.79 |
103.48 |
85.43 |
96.44 |
Jun |
2006 |
68.21 |
103.06 |
85.11 |
96.57 |
Jul |
2006 |
67.59 |
102.25 |
84.22 |
95.72 |
Aug |
2006 |
67.08 |
102.14 |
83.61 |
95.61 |
Sep |
2006 |
67.84 |
104.75 |
84.65 |
97.98 |
Oct |
2006 |
69.11 |
107.25 |
86.18 |
99.94 |
Nov |
2006 |
69.34 |
107.82 |
86.50 |
100.31 |
Dec |
2006 |
68.82 |
106.39 |
85.89 |
99.16 |
Jan |
2007 (P) |
69.77 |
107.70 |
87.05 |
100.74 |
Feb |
2007 (P) |
69.88 |
107.71 |
87.13 |
100.63 |
Mar |
2007 (P) |
69.70 |
107.41 |
87.11 |
100.74 |
Apr |
2007 (P) |
72.18 |
111.59 |
91.50 |
103.79 |
May |
2007 (P) |
74.64 |
115.67 |
94.38 |
107.21 |
Jun |
2007 (P) |
74.83 |
115.28 |
93.24 |
107.37 |
Jul |
2007 (P) |
74.62 |
114.95 |
93.06 |
107.70 |
Aug |
2007 (P) |
73.91 |
114.10 |
– |
– |
Sep |
2007 (P) |
74.11 |
115.08 |
– |
– |
October 15, 2007 |
75.53 |
117.54 |
– |
– |
NEER : Nominal Effective Exchange Rate. REER : Real Effective Exchange Rate.
P : Provisional. – : Not available.
Note : Rise in indices indicates appreciation of the rupee and vice versa. |
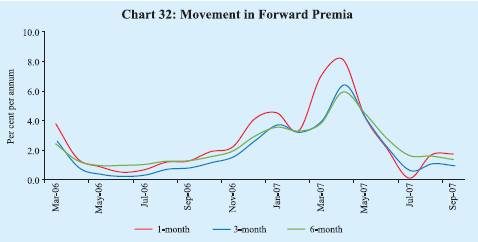
Forward premia increased during the second quarter of 2007-08, after dipping in July 2007, in tandem with the domestic overnight interest rates (Chart 32). The forward premia, however, remained lower than their end-March 2007 and end-June 2007 levels. The one-month forward premia declined from 6.99 per cent in March 2007 to 1.75 per cent in September 2007, while the six-month forward premia declined from 3.80 per cent to 1.37 per cent over the same period.
The average daily turnover in the foreign exchange market increased to US $ 43.8 billion during April-September 2007 from US $ 23.0 billion in the corresponding period of 2006. While the average inter-bank turnover increased to US $ 30.9 billion from US $ 16.6 billion, the average merchant turnover increased to US $ 13.0 billion from US $ 6.4 billion (Chart 33). The ratio of inter-bank to merchant turnover was 2.5 during April-September 2007 as compared with 2.6 a year ago.
Credit Market
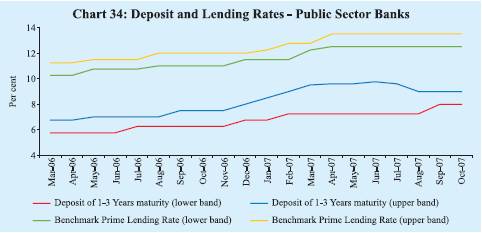
Deposit rates of scheduled commercial banks (SCBs) softened somewhat, particularly at the upper end of the range for various maturities during the second quarter of 2007-08. Interest rates of public sector banks (PSBs) on
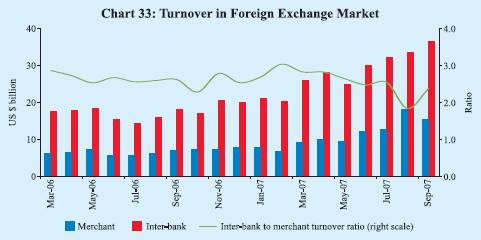
Table 43: Deposit and Lending Rates |
(Per cent) |
Interest Rate |
March |
March |
June |
September |
October |
|
2006 |
2007 |
2007 |
2007 |
2007 @ |
1 |
2 |
3 |
4 |
5 |
6 |
1. |
Domestic Deposit Rate |
|
|
|
|
|
|
Public Sector Banks |
|
|
|
|
|
|
Up to 1 year |
2.25-6.50 |
2.75-8.75 |
2.75-8.75 |
2.75-8.50 |
2.75-8.50 |
|
More than 1 year and up to 3 years |
5.75-6.75 |
7.25-9.50 |
7.25-9.75 |
8.00-9.00 |
8.00-9.00 |
|
More than 3 years |
6.00-7.25 |
7.50-9.50 |
7.75-9.75 |
8.00-9.50 |
8.00-9.50 |
|
Private Sector Banks |
|
|
|
|
|
|
Up to 1 year |
3.50-7.25 |
3.00-9.00 |
3.00-9.50 |
2.50-9.25 |
2.50-9.25 |
|
More than 1 year and up to 3 years |
5.50-7.75 |
6.75-9.75 |
6.75-10.25 |
6.25-10.00 |
6.25-9.60 |
|
More than 3 years |
6.00-7.75 |
7.75-9.60 |
7.50-10.00 |
7.25-10.00 |
7.25-10.00 |
|
Foreign Banks |
|
|
|
|
|
|
Up to 1 year |
3.00-6.15 |
3.00-9.50 |
0.25-9.00 |
2.00-9.00 |
2.00-9.00 |
|
More than 1 year and up to 3 years |
4.00-6.50 |
3.50-9.50 |
3.50-9.50 |
2.00-9.50 |
2.00-9.50 |
|
More than 3 years |
5.50-6.50 |
4.05-9.50 |
4.05-9.50 |
2.00-9.50 |
2.00-9.50 |
2. |
Benchmark Prime Lending Rate |
|
|
|
|
|
|
Public Sector Banks |
10.25-11.25 |
12.25-12.75 |
12.50-13.50 |
12.50-13.50 |
12.50-13.50 |
|
Private Sector Banks |
11.00-14.00 |
12.00-16.50 |
13.00-17.25 |
13.00-16.50 |
13.00-16.50 |
|
Foreign Banks |
10.00-14.50 |
10.00-15.50 |
10.00-15.50 |
10.00-15.50 |
10.00-15.50 |
3. |
Actual Lending Rate* |
|
|
|
|
|
|
Public Sector Banks |
4.00-16.50 |
4.00-17.00 |
4.00-17.75 |
– |
– |
|
Private Sector Banks |
3.15-20.50 |
3.15-25.50 |
4.00-26.00 |
– |
– |
|
Foreign Banks |
4.75-26.00 |
5.00-26.50 |
2.98-28.00 |
– |
– |
– : Not available. @ : As on October 19, 2007.
* : Interest rate on non-export demand and term loans above Rs.2 lakh excluding lending rates at the
extreme five per cent on both sides. |
deposits of maturity of one year to three years were placed in the range of 8.00-9.00 per cent by mid-October 2007 as compared with 7.25-9.75 per cent in June 2007 (7.25-9.50 per cent in March 2007), while those on deposits of maturity of above three years were placed in the range of 8.00-9.50 per cent by mid-October 2007 as compared with 7.75-9.75 per cent in June 2007 (7.50-9.50 per cent in March 2007).
Benchmark Prime Lending Rates (BPLRs) of private sector banks softened to the range of 13.00-16.50 per cent by mid-October 2007 from 13.00-17.25 per cent in June 2007. The range of BPLRs of PSBs and foreign banks, however, remained unchanged during this period (Table 43 and Chart 34).
The weighted average BPLR of public sector banks increased from 12.43 per cent in March 2007 to 13.07 per cent in June 2007 and remained unchanged in October 2007. The weighted average BPLR of private sector banks increased from 14.34 per cent in March 2007 to 15.12 per cent in June 2007, but marginally softened to 15.08 per cent in October 2007. The weighted average BPLR of foreign banks increased from 12.63 per cent in March 2007 to 13.83 per cent in June 2007 and further to 14.07 per cent in October 2007.
Government Securities Market
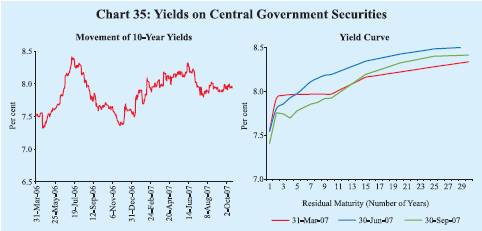
Yields in the Government securities market softened during the second quarter of 2007-08, partly reflecting global trends in yields, lower inflation and comfortable liquidity conditions (Chart 35). The 10-year yield moved in a range of 7.80-8.32 per cent during 2007-08 (up to October 24, 2007). As on October 24, 2007, the yield was 7.89 per cent, 8 basis points lower than that at end-March 2007. The spread between 1-10 year yields was 52 basis points at end-September 2007 as compared with 65 basis points at end-June 2007 (42 basis points at end-March 2007). The spread between 10-year and 30-year yields was 49 basis points at end-September 2007 as compared with 31 basis points at end-June 2007 (37 basis points at end-March 2007).
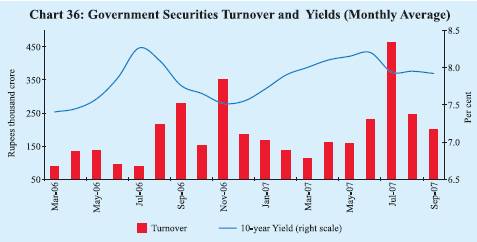
The turnover in the Government securities market almost doubled in July 2007 from its level in June 2007 on account of low funding cost at the shorter-end, but reverted in August-September 2007 as overnight rates rose to the corridor set by the reverse repo and repo rates (Chart 36).
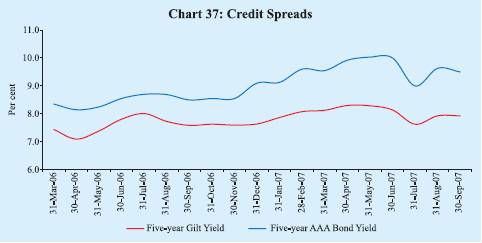
The yield on 5-year AAA-rated corporate bonds softened during the second quarter of 2007-08 in tandem with lower Government securities yield. The credit spread between the yields on 5-year AAA-rated bonds and 5-year Government securities narrowed to 157 basis points at end-September 2007 from 186 basis points at end-June 2007 (142 basis points at end-March 2007) (Chart 37).
Equity Market
Primary Market
Resources raised through public issues at Rs.31,854 crore increased by 149.4 per cent during April-September 2007 over the corresponding period of 2006. The number of issues also increased from 50 to 60 (Table 44). Most of the resources raised were, however, during June-2007 (Rs.22,688 crore out of Rs.31,854 crore), due to two large issues. The average size of public issues increased from Rs.255 crore during April-September 2006 to Rs.531 crore during April-September 2007. All the public issues during April-September 2007 were in the form of equity except one issue. Out of 60 issues during April-September 2007, 46 issues were initial public offerings (IPOs), constituting 62.3 per cent of total resource mobilisation.
Table 44: Mobilisation of Resources from the Primary Market |
(Amount in Rupees crore) |
Item |
2006-07 |
2007-08 |
|
(April-September) |
(April-September) P |
|
No. of Issues |
Amount |
No. of Issues |
Amount |
1 |
|
2 |
3 |
4 |
5 |
A. |
Prospectus and Rights Issues* |
|
|
|
|
|
1. |
Private Sector (a+b) |
50 |
12,770 |
57 |
28,521 |
|
|
a) |
Financial |
3 |
261 |
5 |
11,021 |
|
|
b) |
Non-financial |
47 |
12,509 |
52 |
17,500 |
|
2. |
Public Sector (a+b+c) |
– |
– |
3 |
3,333 |
|
|
a) |
Public Sector Undertakings |
– |
– |
– |
– |
|
|
b) |
Government Companies |
– |
– |
2 |
2,517 |
|
|
c) |
Banks/Financial Institutions |
– |
– |
1 |
816 |
|
3. |
Total (1+2) |
50 |
12,770 |
60 |
31,854 |
|
|
of which: |
|
|
|
|
|
|
(i) |
Equity |
50 |
12,770 |
59 |
31,354 |
|
|
(ii) |
Debt |
– |
– |
1 |
500 |
|
2006-07 (April-June) |
2007-08 (April-June) |
B. |
Private Placement |
|
|
|
|
|
1. |
Private Sector |
312 |
15,315 |
428 |
30,872 |
|
|
a) |
Financial |
113 |
7,963 |
195 |
13,728 |
|
|
b) |
Non-financial |
199 |
7,352 |
233 |
17,144 |
|
2. |
Public Sector |
22 |
15,813 |
20 |
19,002 |
|
|
a) |
Financial |
20 |
14,118 |
14 |
11,971 |
|
|
b) |
Non-financial |
2 |
1,695 |
6 |
7,031 |
|
3. |
Total (1+2) |
334 |
31,128 |
448 |
49,874 |
|
of which: |
|
|
|
|
|
|
(i) |
Equity |
– |
– |
– |
– |
|
|
(ii) |
Debt |
334 |
31,128 |
448 |
49,874 |
Memo: |
C. |
Euro Issues (Apr-Sep) |
29 |
7,916 |
10 |
11,284 |
P : Provisional. * : Excluding offers for sale. – : Nil/Negligible. |
Mobilisation of resources through private placement increased by 60.2 per cent to Rs.49,874 crore during April-June 2007 as compared with an increase of 48.4 per cent during April-June 2006 (see Table 44). Public sector entities accounted for 38.1 per cent of total mobilisation during April-June 2007, lower than the corresponding period of the previous year (50.8 per cent). Resource mobilisation through financial intermediaries (both from public sector and private sector) registered a growth of 16.4 per cent over the corresponding period of last year, accounting for 51.5 per cent of total mobilisation during April-June 2007. Resources raised by non-financial intermediaries registered a higher growth of 167.2 per cent (48.5 per cent of total resource mobilisation) during April-June 2007 over the corresponding period of last year.
During April-September 2007, resources raised through Euro issues –American Depository Receipts (ADRs) and Global Depository Receipts (GDRs) –by Indian corporates increased sharply by 42.5 per cent to Rs.11,284 crore (see Table 44).
During April-September 2007, net mobilisation of funds by mutual funds increased by 75.9 per cent to Rs.1,05,614 crore (Table 45). Inflows in private sector mutual funds increased by 107.0 per cent over the corresponding period of last year. Net inflows were witnessed in both income/debt-oriented schemes and growth/equity-oriented schemes.
Secondary Market
The domestic stock markets recorded further gains during the second quarter of 2007-08 amidst intermittent corrections (Chart 38). Liquidity support from foreign institutional investors (FIIs) on the back of strong GDP growth, robust
Table 45: Resource Mobilisation by Mutual Funds |
(Rupees crore) |
|
April-March |
April-September |
Mutual Fund |
2006-07 |
|
2006-07 |
2007-08 |
|
Net |
Net |
Net |
Net |
Net |
Net |
|
Mobilisation @ |
Assets # |
Mobilisation @ |
Assets # |
Mobilisation @ |
Assets # |
1 |
2 |
3 |
4 |
5 |
6 |
7 |
Private Sector |
79,038 |
2,62,079 |
46,311 |
2,28,254 |
95,845 |
3,93,431 |
Public Sector * |
14,947 |
64,213 |
13,737 |
62,953 |
9,769 |
83,558 |
Total |
93,985 |
3,26,292 |
60,048 |
2,91,207 |
1,05,614 |
4,76,989 |
@ : Net of redemptions. #: End-period. * : Including UTI Mutual fund.
Note : Data exclude funds mobilised under Fund of Funds Schemes.
Source : Securities and Exchange Board of India. |
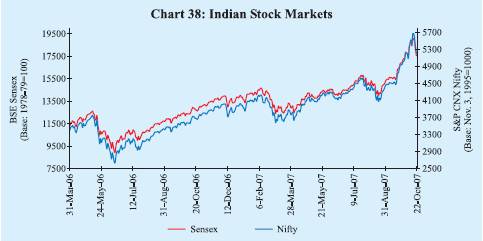
corporate profitability, decline in domestic inflation rate and upward trend in major international equity markets provided support to the domestic stock markets. However, slump in the US home sales and rising concerns over the US sub-prime mortgage and corporate lending markets, increase in global crude oil prices to record high levels, political uncertainty in the wake of the Indo-US nuclear deal and deceleration in India’s industrial production during the month of July 2007 depressed the markets intermittently.
Between end-March 2007 and end-September 2007, the BSE Sensex moved in a range of 12455-17291. The BSE Sensex closed at a record high of 19059 on October 15, 2007, an increase of 45.8 per cent over end-March 2007. The S&P CNX Nifty also reached a record high of 5670 on October 15, 2007. However, key indices slipped from their record levels after the Securities and Exchange Board of India (SEBI) proposed to restrict investments through offshore derivative instruments/participatory notes on October 16, 2007 leading to large sales by FIIs. Subsequently, on allaying concerns of overseas investors by the SEBI and assuring them speeding up the process of registration as FIIs, the BSE Sensex recorded biggest ever single day gain of 879 points on October 23, 2007. The BSE Sensex closed at 18513 on October 24, 2007.
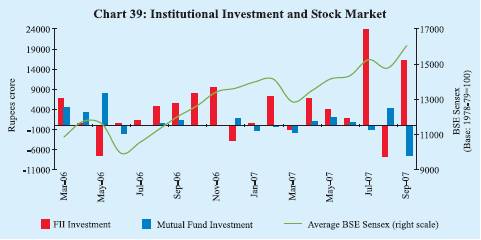
According to the data released by the SEBI, FIIs have invested Rs.62,139 crore (US $ 15.1 billion) in the Indian stock markets during 2007-08 so far (up to October 19, 2007) as compared with net purchases of Rs.10,231 crore (US $ 2.2 billion) during the corresponding period of the previous year (Chart 39). Mutual funds have made net investments of Rs. 2,595 crore during 2007-08 so far (up to October 19, 2007) as compared with net investments of Rs.10,344 crore during the corresponding period of the last year.
The major gainers in the domestic stock markets during the current financial year so far (up to October 19, 2007) were metal followed by capital goods, oil and gas, public sector undertaking, banking, consumer durables, fast moving consumer goods, auto and healthcare sector stocks (Table 46).
Reflecting the upward trend in stock prices, the price-earnings (P/E) ratios of the 30 scrips included in the BSE Sensex rose from 20.3 at end-March 2007 to 23.3 by end-September 2007 (Table 47). The market capitalisation of the BSE increased by 46.7 per cent between end-March 2007 and end-September 2007. The volatility in the stock markets declined during April-September 2007. The combined turnover of BSE and NSE in the cash and derivatives segments during April-September 2007 was higher by 43.2 per cent and 51.5 per cent, respectively, over the corresponding period of 2006.
Table 46: BSE Sectoral Stock Indices |
(Base: 1978-79=100) |
Sector |
Variation (per cent) |
|
End-March
2006 @ |
End-March
2007 @ |
October 19,
2007 # |
1 |
2 |
3 |
4 |
Fast Moving Consumer Goods |
109.9 |
-21.4 |
16.2 |
Public Sector Undertakings |
44.0 |
-3.2 |
38.7 |
Information Technology |
49.2 |
21.6 |
-4.4 |
Auto |
101.2 |
-8.5 |
8.8 |
Oil and Gas |
61.1 |
30.5 |
59.6 |
Metal |
40.3 |
-4.3 |
70.6 |
Health Care |
51.2 |
-5.4 |
1.8 |
Bankex |
36.8 |
24.2 |
35.1 |
Capital Goods |
156.0 |
11.1 |
70.0 |
Consumer Durables |
115.4 |
11.1 |
33.8 |
BSE 500 |
65.2 |
9.7 |
37.4 |
BSE Sensex |
73.7 |
15.9 |
34.3 |
@ : Year-on-year variation. # : Variation over end-March 2007.
Source : Bombay Stock Exchange Limited. |
Table 47: Stock Market Indicators |
Indicator |
BSE |
NSE |
|
2005-06 |
2006-07 |
April-September |
2005-06 |
2006-07 |
April-September |
|
|
|
2006 |
2007 |
|
|
2006 |
2007 |
1 |
|
2 |
3 |
4 |
5 |
6 |
7 |
8 |
9 |
1. |
BSE Sensex / S&P CNX Nifty |
|
|
|
|
|
|
|
|
|
(i) End-period |
11280 |
13072 |
12454 |
17291 |
3403 |
3822 |
3588 |
5021 |
|
(ii) Average |
8280 |
12277 |
11167 |
14679 |
2513 |
3572 |
3280 |
4300 |
2. |
Coefficient of Variation |
16.7 |
11.1 |
7.7 |
6.2 |
15.6 |
10.4 |
7.8 |
5.9 |
3. |
Price-Earning Ratio |
|
|
|
|
|
|
|
|
|
(end-period)* |
20.9 |
20.3 |
21.3 |
23.3 |
20.3 |
18.4 |
20.9 |
22.6 |
4. |
Price-Book Value Ratio* |
5.1 |
5.1 |
4.6 |
5.5 |
5.2 |
4.9 |
4.8 |
5.4 |
5. |
Yield* (per cent per annum) |
1.2 |
1.3 |
1.4 |
1.0 |
1.3 |
1.3 |
1.3 |
1.1 |
6. |
Listed Companies |
4,781 |
4,821 |
4,785 |
4,871 |
1,069 |
1,228 |
1,116 |
1,319 |
7. |
Cash Segment Turnover |
|
|
|
|
|
|
|
|
|
(Rupees crore) |
8,16,074 |
9,56,185 |
4,44,731 |
6,27,022 |
15,69,556 |
19,45,285 |
9,23,664 |
13,34,318 |
8. |
Derivative Segment |
|
|
|
|
|
|
|
|
|
Turnover (Rupees crore) |
9 |
59,007 |
379 |
1,12,316 |
48,24,174 |
73,56,242 |
35,06,882 |
52,90,968 |
9. |
Market Capitalisation |
|
|
|
|
|
|
|
|
|
(Rupees crore) @ |
30,22,191 |
35,45,041 |
31,85,680 |
52,02,955 |
28,13,201 |
33,67,350 |
29,94,132 |
48,86,561 |
* : Based on 30 scrips included in the BSE Sensex and 50 scrips included in the S&P CNX Nifty.
@: End period.
Source : Bombay Stock Exchange Ltd. (BSE) and National Stock Exchange of India Ltd. (NSE). |
|
 IST,
IST,


