 IST,
IST,


V. Monetary Policy and Inflation (Part 2 of 2)
Impact of Oil Price Shocks
5.39 In view of the recent sharp increase in international crude oil prices, this Section undertakes an assessment of their impact on economic activity. Nominal international crude oil prices have increased sharply recording new highs in the second half of 2004. The increase, however, needs to be viewed keeping in mind the sharp decline during the period 1999-2000. Notwithstanding this order of increase, prices in real terms remain less than the levels reached in 1981. An increase in oil prices affects both supply and demand in the economy. A hike in oil prices leads to an increase in the input costs for firms, reduces their profits which induces them to lower their output. As oil dependency has declined in industrialised countries over time, this supply side effect has weakened in these economies. In contrast, this effect remains significant for developing economies, in view of their increased oil dependency. On the demand side, higher oil prices reduce consumption and investment in the economy. Both supply and demand effects reinforce each other leading to a reduction in output. Consequent variations in exchange rate can add to these effects. High inflation might lead to a tightening of monetary policy,
the macroeconomic performance of the three key monetary regimes: exchange rate targeting countries, money growth targeting countries and IT countries. They find that what matters most for macroeconomic performance - low and stable inflation and output stability - is clear-cut quantitative goals by the monetary authority. Both having and hitting quantitative targets for monetary policy is found to be systematically and robustly associated with lower inflation. The exact form of the monetary target matters somewhat, but is less important than having some quantitative target. Successfully achieving a quantitative monetary goal is also associated with less volatile output.
5.37 In a similar vein, Sterne (2004) makes a distinction between inflation targeting and inflation targets. While only around 20 central banks follow the inflation targeting approach, a large number of central banks - such as, India - make public some sort of loose inflation targets (which could take the form of inflation forecasts/projections rather than targets per se). According to one survey, out of 95 countries, as many as 57 countries had some sort of inflation target/ projection/forecast (Table 5.10). Such inflation targets/ forecasts increase transparency and help to reinforce societies support for low inflation policies. They also provide a platform to the central bank to voice its independent opinion. In cases where inflation targets/ forecasts are missed, a central bank can provide analytical insights by identifying factors (say, fiscal dominance) contributing to missing the target. This can increase the costs to the government of ignoring the central bank advice. Explicit inflation targets and a credible commitment to them helps to stabilise financial markets. Gurkanyak, Sack and Swanson (2003) find that long-term forward interest rates in the US often react considerably to surprises in macroeconomic data releases and monetary policy announcements. In contrast, in the UK - which has an explicit inflation target - long-term forward interest rates demonstrate less excess sensitivity.
|
Table 5.10: Number of Countries |
||
| Year |
Countries with |
Of which: Inflation |
|
Inflation Target |
Targeting Countries |
|
|
1 |
2 |
3 |
|
1990 |
7 |
1 |
|
1993 |
23 |
9 |
|
1995 |
37 |
11 |
|
2000 |
56 |
17 |
|
2001 |
57 |
18 |
|
Source :Mahadeva and Sterne (2002). |
||
5.38 A stylised fact in regard to inflation is that it is highly persistent, i.e., if there is a shock that raises inflation today, inflation continues to remain high in the future and vice versa. High persistence (a unit root) indicates that inflation expectations are not well-anchored and policy efforts to reduce inflation will have to bear significant output losses. In this context, increased transparency in monetary policy formulation with priority to price stability as a key objective is expected to provide an anchor to inflation expectations and hence lower the persistence of inflation (Clark, 2003). This has an important implication: any future shock that raises inflation temporarily will not lead to a permanent rise in inflation expectations and actual inflation. Empirical evidence on persistence of inflation remains mixed. IMF (2002) suggests that inflation has become more predictable and less persistent. Levin, Natalucci and Piger (2004) find that IT anchors inflation expectations and, therefore, inflation is less persistent in IT countries than in non-IT countries. On the other hand, Cecchetti and Debelle (2004) and Marques (2004) argue that there has not been much change in persistence. Once a structural break in the mean of inflation is taken into account, there is no evidence that inflation persistence has been high in the previous decades.
Impact of Oil Price Shocks
5.39 In view of the recent sharp increase in international crude oil prices, this Section undertakes an assessment of their impact on economic activity. Nominal international crude oil prices have increased sharply recording new highs in the second half of 2004. The increase, however, needs to be viewed keeping in mind the sharp decline during the period 1999-2000. Notwithstanding this order of increase, prices in real terms remain less than the levels reached in 1981. An increase in oil prices affects both supply and demand in the economy. A hike in oil prices leads to an increase in the input costs for firms, reduces their profits which induces them to lower their output. As oil dependency has declined in industrialised countries over time, this supply side effect has weakened in these economies. In contrast, this effect remains significant for developing economies, in view of their increased oil dependency. On the demand side, higher oil prices reduce consumption and investment in the economy. Both supply and demand effects reinforce each other leading to a reduction in output. Consequent variations in exchange rate can add to these effects. High inflation might lead to a tightening of monetary policy, which could further reduce output. Furthermore, high oil prices transfer income to oil producers. As oil producers have a lower propensity to consume than oil consumers, global demand falls (IMF, 2004).
5.40 According to IMF (2004), a permanent increase of US $ 5 per barrel in crude oil prices is estimated to reduce world output by 0.3 per cent a year after the hike. Although the recent increase in oil prices is large enough to constitute a shock to the system (Bernanke, 2004), the impact is likely to prove less consequential to economic growth and inflation than in the 1970s (Greenspan, 2004). Inflation is estimated to increase by 60-70 basis points in major developing regions - more than three-times the increase on industrial economies (Table 5.11). Recent research stresses that the effect on economic activity may be asymmetric - the adverse effect of an increase in oil prices is larger than the beneficial effect of an equivalent decline in oil prices. Furthermore, the beneficial effect is statistically insignificant. Studies that take such non-linearity into account suggest that a doubling of oil prices reduces output by 3.5-5 per cent in the US and by 1-2 per cent in the euro area (Jimenez-Rodriguez and Sanchez, 2004).
5.41 To conclude this section, an assessment of the inflation record of the past half-century shows that while, in the short-run, supply shocks can lead to large changes in the headline inflation, persistent high inflation is ultimately the outcome of lax monetary policies - as witnessed during the 1970s. Monetary
|
Table 5.11: Impact of a Permanent US $ 5 a Barrel Increase in Oil Prices |
|||||
|
(Per cent) |
|||||
|
Impact after One Year on |
|||||
|
Region/Country |
Output |
Inflation |
Trade |
||
|
Balance |
|||||
|
1 |
2 |
3 |
4 |
||
|
World |
-0.3 |
.. |
.. |
||
|
Industrial Countries |
-0.3 |
0.2 |
-0.1 |
||
|
USA |
-0.4 |
0.3 |
-0.1 |
||
|
(-0.03 to –0.05) |
|||||
|
Euro Area |
-0.4 |
0.3 |
-0.1 |
||
|
(-0.01 to |
-0.02) |
||||
|
Japan |
-0.2 |
0.1 |
-0.2 |
||
|
(+0.02 to |
+0.05) |
||||
|
Developing Economies |
|||||
|
Latin America |
-0.1 |
0.6 |
0.0 |
||
|
Asia |
-0.4 |
0.7 |
-0.5 |
||
|
China |
-0.4 |
0.4 |
-0.3 |
||
|
India |
-0.5 |
1.3 |
-0.6 |
||
|
Note:Figures
in brackets give the cumulative impact of one per cent increase in oil
prices on output after |
|||||
tightening was insufficient during the 1970s and real interest
rates actually trended lower. With inflation in double digits, central banks
adopted deliberate disinflation strategies beginning late 1970s. Monetary policies
were tightened and industrial economies could reduce inflation significantly
by the second half of the 1980s, albeit at costs of large output and
employment losses. Developing countries have also been able to reduce inflation
during the 1990s as fiscal consolidation and structural reforms provided flexibility
to monetary policy in meeting its price stability objectives.
5.42 In view of difficulties encountered with monetary targeting
and exchange rate pegged regimes, a number of central banks including emerging
economies have adopted IT frameworks. Although these IT countries were able
to reduce inflation or maintain low inflation during the 1990s, stylised evidence
shows that even non-IT countries were successful in this endeavour. EMEs which
have adopted IT face a number of constraints. This is reflected in their performance
which is relatively worse than that of advanced economies. An explicit numerical
target is good for anchoring inflation but it comes at a cost. If the explicit
inflation target cannot be achieved it weakens the credibility of the central
bank (Mohan, 2004a). Thus it may not be appropriate to formulate monetary policy
based on a simplistic inflation target or a single point inflexible point target
as argued by many.
5.43 Sharp variations in exchange rates can have a large influence
on inflation in the short-run and this is one reason for 'fear of floating'.
Empirical evidence suggests that, even as economies have opened up, exchange
rate pass-through to domestic prices has declined during the 1990s for advanced
as well as developing economies. Success of monetary policy in maintaining low
and stable inflation is considered to be one of factors that explain the decline
in pass-through. Overall, improvements in the institutional design of the conduct
of monetary policy such as greater independence to central banks have been a
key factor that led to containment of inflation during the 1990s. A key lesson
is that monetary policy can contribute to growth and employment by ensuring
price stability - defined as low and stable inflation. Although there is uncertainty
about how economies operate and about monetary policy itself, uncertainty is
no excuse for not pursuing price stability.
5.44 Since increased globalisation and competition has been
one of the factors that has contributed towards containment of inflation, countries'
perspective on inflation needs to be informed increasingly by world price trends,
particularly in commodities of interest to them. An important consideration
for reining inflationary expectations relates to the need to have clarity on
price stability, effective communication, consistency in conduct of policy and
transparency in explaining actions. Central banks should speak clearly to markets
and listen to markets more carefully to ensure the intended objectives of policy.
II. INFLATION: THE INDIAN EXPERIENCE
5.45 Price stability has been an important objective of monetary
policy in India. Compared with many developing economies, the Indian inflation
experience can be considered satisfactory, despite recurrent supply shocks and
continuing fiscal imbalances (Reddy, 1999). This is attributed to relatively
better monetary management coupled with judicious supply management through
buffer stocks of foodgrains and imports of sensitive commodities which contained
the adverse effects of supply shocks and reined in inflation. Nonetheless, inflation
increased during the 1970s and remained high thereafter till mid-1990s. In the
period since 1996-97, inflation has edged lower reflecting concerted policy
efforts.
Wholesale Price Inflation
5.46 Annual rate of inflation measured by variations in the
wholesale price index (WPI) over the past five decades averaged 6.6 per cent
in India. Inflation was very low during the 1950s averaging 1.7 per cent, but
was quite volatile and annual inflation ranged between (-) 12.5 per cent and
13.8 per cent. The volatility was mainly on account of agricultural failures.
Inflation accelerated to 6.4 per cent during the 1960s partly induced by the
two wars during 1962 and 1965 and crop failures in 1965-66 when agricultural
production fell by more than 16 per cent.
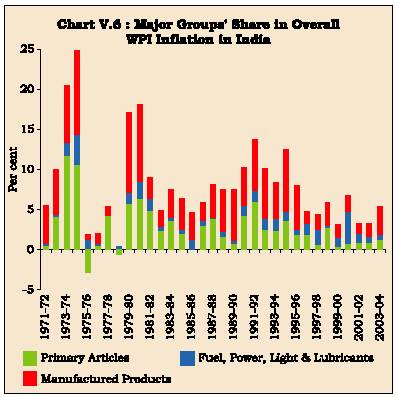
5.47 Inflation accelerated further during the 1970s due to
both supply and demand shocks. The supply shocks emanated mainly from oil and
food prices. Reflecting the first oil shock of 1973, import price deflator (measured
as year-on-year changes in the unit value index of imports) surged by 43.0 per
cent and 72.8 per cent during 1973-74 and 1974-75, respectively. In line with
the sharp increase in average international crude oil prices by over 250 per
cent in 1974, domestic fuel prices increased sharply from an annual average
of about 4.7 per cent during the three years preceding the first oil crisis
to about 26.5 per cent on average during the three years beginning 1973-74.
The adverse impact of the oil price shocks got accentuated by the drought conditions
in 1972-73, 1974-75 and 1979-80 which resulted in significant declines in agricultural
output. Thus, higher fuel prices and agricultural commodity prices got reflected
in overall inflation (Chart V.6). Sharp increases in money supply - even as
output growth decelerated during the 1970s - added to demand pressures. Consequently,
inflation moved up further in the 1970s, averaging about 9.0 per cent.
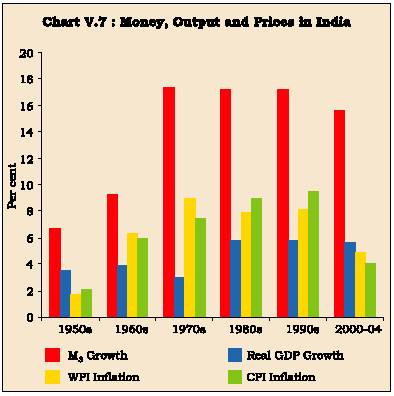
5.48 During the 1980s, demand pressures emanating from an expansionary
fiscal policy and its monetisation coupled with intermittent supply shocks kept
inflation high. Inflation averaged 8.0 per cent per annum during the 1980s,
somewhat lower than that of 9.0 per cent per annum during the 1970s. Fiscal
deficit of the Centre widened from 3.8 per cent of GDP during the 1970s to 6.8
per cent during the 1980s. A large part of this burden was borne by the Reserve
Bank - almost 32 per cent of the fiscal deficit was financed by the Reserve
Bank during the 1980s (25 per cent during the 1970s). Monetised deficit almost
doubled from 1.1 per cent of GDP during the 1970s to 2.1 per cent during the
1980s. Consequently, the net Reserve Bank credit to the Centre expanded by 20.0
per cent per annum during the 1980s as compared with 14.5 per cent per annum
during the 1970s and this led to an acceleration in reserve money growth. Broad
money growth could, however, be contained to rates lower than the 1970s, as
a result of increases in cash reserve requirements (Chart V.7). Exchange rate
pressures also added to inflation.
5.49 Empirical evidence confirmed the adverse effects of excessive
monetary expansion, emanating from the monetisation of the fiscal deficit, on
inflation (Rangarajan and Arif, 1990). The experience of the 1980s also highlighted
the inflation-fiscal-monetary nexus (Rangarajan, Basu and Jadhav, 1989; RBI,
2002a). Because of higher elasticity of government expenditure with respect
to inflation relative to that of government receipts, higher inflation meant
an enlarged fiscal deficit which, in turn, necessitated increased monetisation.
This led to a further increase in inflation, starting a vicious circle of high
inflation, high deficits and high monetisation.
5.50 Inflationary pressures accelerated in the first half of
the 1990s. High fiscal and current account deficits of the 1980s culminated
in the balance of payments difficulties during 1990-91. As part of the macroeconomic
stabilisation programme and structural reforms undertaken in the aftermath of
the crisis, exchange rate depreciated substantially. Between end-March 1991
and end-March 1992, the Indian rupee depreciated by nearly 37 per cent. Notwithstanding
the limited openness of the Indian economy, this order of depreciation added
to inflationary pressures. The exchange rate depreciated by more than 11 per
cent per annum during the first half of the 1990s, almost double that during
the second half of the 1980s. Hikes in procurement prices as well as supply-demand
imbalances in essential commodities like pulses, oilseeds and edibles oils further
added to inflation. A part of the hike in procurement prices was intentional
so as to restore the terms of trade for agriculture. Primary articles inflation
accelerated to 18.1 per cent in 1991-92 from 13.0 per cent a year back. Extremely
low foreign exchange reserves - foreign currency assets at US $ 2.2 billion
at end-March 1991, equivalent to less than one month of imports -constrained
the ability to import to meet the demand gaps. The sustained rise in fuel prices
at a double-digit rate (of about 13 per cent) in the first half of the 1990s
had its impact on inflation not only directly but also through the second round
effects.
5.51 The phased opening up of the Indian economy also added
to inflationary pressures. This emanated from large capital inflows during 1993-94
and 1994-95 and, despite a number of steps to sterilise them, monetary expansion
remained well-above the desired trajectory. As a result of the combined effect
of these factors, the first half of the 1990s saw a sharp increase in inflation
which averaged 11.0 per cent, higher than the average of 8.0 per cent during
the 1980s. The focus of monetary policy in the subsequent period, therefore,
shifted towards containment of inflationary pressures in the economy.
5.52 Despite substantial capital inflows and high fiscal deficits
in the period since 1996-97, inflation could be controlled. Inflation averaged
around five per cent in the period 1996-97 to 2003-04, less than one-half of
that during the first half of the 1990s and the average of 8-9 per cent during
the 1970s and the 1980s. In fact, even in a year such as 2002-03 when the country
faced its worst drought of the past two decades, inflation remained moderate.
Not only that, the year 2002-03 was marked by the simultaneous impact of several
other adverse developments such as border tensions and high international crude
oil prices. As the Reserve Bank's Annual Report, 2002-03 observed that, 'in
the past, the occurrence of any one of the shocks experienced in 2002-03 in
isolation had produced a sharp loss of growth, higher inflation, balance of
payments difficulties, and even financial instability in the economy. Seen in
this context, the performance of the economy during 2002-03 demonstrates the
developing resilience of the Indian economy. This suggests that perseverance
with structural reforms, despite the drag of slower growth in the second half
of the 1990s, has helped to relatively shock-proof the economy and sustain a
stable macro-economic environment'.
5.53 A number of factors explain the lowering of inflation
and inflation expectations since mid-1990s. First, the Reserve Bank could largely
contain money supply to levels consistent with its indicative inflation projections.
This was despite a large order of capital inflows from abroad and the consequent
build-up of reserves. As elaborated in Chapter IV, the expansionary effect of
large forex purchases was sterilised effectively by resorting to a number of
steps, especially open market sales of Government securities and a judicious
use of Liquidity Adjustment Facility (LAF). Moreover, the increased flexibility
due to the improved monetary-fiscal interface and reforms in the Government
securities market enabled a lower degree of monetisation of fiscal deficits.
In particular, market-determined yields on Government securities encouraged
banks to willingly hold Government securities and this reduced the pressure
on the Reserve Bank to finance the Government. Net
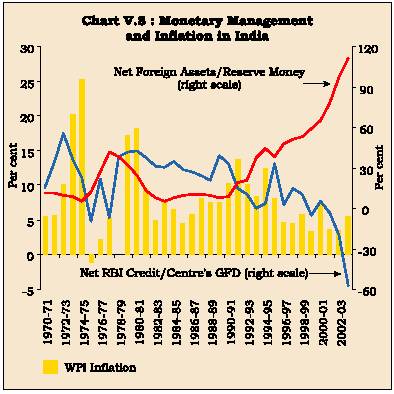
Reserve Bank credit to the Centre, in fact, recorded a negative growth in contrast
to double-digit growth over the previoustwo and half decades (Chart V.8).There
was a perceptible deceleration in the M3 growth rate from around 18 per cent
during 1990-95 to around 16 per cent during 1995-2004 even as real GDP growth
accelerated from 5.0 per cent to 6.1 per cent over the same period (Table 5.12).
|
Table 5.12: Inflation in India and Key Determinants |
||||||||
|
(Annual Averages in Per cent) |
||||||||
|
Item |
1970-75 |
1975-80 |
1980-85 |
1985-90 |
1990-95 |
1995-2004 |
||
|
1 |
2 |
3 |
4 |
5 |
6 |
7 |
||
|
WPI Inflation |
13.3 |
4.7 |
9.3 |
6.7 |
11.0 |
5.1 |
||
|
Real GDP Growth |
2.3 |
3.6 |
5.6 |
6.0 |
5.0 |
6.1 |
||
|
15.5 |
19.3 |
16.8 |
17.6 |
18.0 |
16.0 |
|||
|
Broad Money (M3) Growth |
||||||||
|
12.2 |
17.2 |
16.5 |
17.2 |
17.0 |
11.2 |
|||
|
Reserve Money (M0) Growth |
||||||||
|
Fiscal Deficit/GDP Ratio |
3.3 |
4.4 |
5.9 |
7.7 |
6.3 |
5.6 |
||
|
Growth in Net RBI Credit to Centre |
16.2 |
13.2 |
22.2 |
17.8 |
6.8 |
-5.4 |
||
|
Fiscal Deficit Financed by Net RBI Credit |
37.2 |
16.9 |
35.3 |
27.9 |
12.6 |
-2.2 |
||
|
Fuel Inflation |
18.5 |
8.4 |
12.5 |
6.0 |
12.8 |
10.1 |
||
|
Food Articles Inflation |
15.0 |
1.9 |
10.7 |
6.4 |
12.4 |
5.5 |
||
|
Increase in Procurement Prices |
||||||||
|
- Paddy |
6.6* |
7.6 |
6.3 |
13.0 |
5.5 |
|||
|
- Wheat |
2.7* |
6.1 |
6.6 |
11.2 |
7.3 |
|||
|
Import Price Inflation |
28.2 |
6.7 |
8.0 |
8.0 |
7.6 |
6.8 @ |
||
|
Depreciation in Exchange Rate |
1.1 |
0.3 |
7.2 |
6.4 |
11.3 |
4.1 |
||
|
(Rupees per US dollar) |
||||||||
|
Food Stocks (Million tonnes) |
3.2# |
14.9 |
13.6 |
13.3 |
17.4 |
28.4 |
||
|
Import Cover of Forex Reserves (in months) |
4.5 |
7.6 |
4.1 |
3.4 |
5.9 |
9.6 |
||
|
* Average for 1976-80. |
||||||||
5.54 Second, supply pressures from food prices eased as food articles inflation halved from around 12.0 per cent to around 6.0 per cent, led by a deceleration in procurement price increases. This decline, in turn, could have been enabled, inter alia, by a reduction in the headline inflation. Third, containment of global inflation reduced external pressure on domestic prices. Increase in import prices (as measured by unit value index of imports in rupees) was somewhat lower than that in the first half of the 1990s. Fourth, the exchange rate showed a significantly lower order of depreciation than in the first half of the 1990s: around four per cent per annum compared to 11 per cent. Moreover, as the results of an empirical exercise (discussed later) in this Chapter show, there is some evidence of a decline in exchange rate pass-through to domestic prices. A lower order of depreciation coupled with a decline in pass-through could have also helped in containing domestic inflation. Fifth, large buffer stocks of foodgrains have provided cushion against undue pressures on food prices through timely release of stocks. Sixth, the high level of foreign exchange reserves adds to comfort in supply management through imports of essential commodities. Adequate food stocks and foreign exchange reserves enabled not only the reduction in inflation per se but also contributed to lowering inflation expectations on a sustainable basis. Inflation expectations are quite critical. The effectiveness of monetary policy depends as much on the public's expectations about future policy as upon actual actions. Successful monetary policy is not so much a matter of effective control of overnight interest rates as it is of shaping market expectations of the way in which interest rates, inflation and income are likely to evolve over the coming year and later (Woodford, 2003).
5.55 Although inflation is not targeted per se, monetary
policy in India has been formulated with indicative projections about inflation
consistent with growth for curbing inflationary expectations. The projected
inflation rate was gradually scaled down to around five per cent in recent years
from around 7-9 per cent during the early part of the 1990s which helped in
anchoring inflationary expectations and improving policy credibility. Inflation
rate of around five per cent appears to be consistent with various research
findings on the threshold inflation rate for India (Box V.5). However, even
a moderate inflation rate poses a dilemma in an open economy. If the domestic
inflation rate of an economy, however low it may be, is higher than the average
inflation rate of its trading partners, it puts pressure on the exchange rate.
In this context, the question of simultaneous balance of the internal and external
sectors becomes a major issue.
Box V. 5
Threshold Inflation
With price stability as the dominant objective of monetary policy, the choice of an appropriate rate of inflation consistent with maximising growth attains importance. Friedman (1969) argued that anticipated inflation should, on average, be negative. Steady deflation - at a rate equal to the real rate of interest - is optimal because only at a nominal zero rate of interest is the marginal opportunity cost of holding cash equal to its marginal production cost (close to zero in practice). If shocks are only nominal and rigidities are symmetrical (of equal size both downward and upward) then near zero inflation may be optimal. However, the real world is marked by existence of nominal rigidities and zero inflation is not an optimal target (Akerlof et al., 1996). Zero inflation is also not favoured because of the upward bias in measured inflation. Moreover, a target of zero inflation rate increases the level of sustainable unemployment and hence, reduces output. In other words, a long-run output-inflation trade-off may exist at very low levels of inflation. The output effects of this trade-off may be large; for instance, the median increase in the equilibrium unemployment rate associated with zero rather than 3 per cent inflation is more than 2 percentage points. For Europe, even higher increases in unemployment are indicated (Holden 2002). For all these reasons, a low but positive rate of inflation is favoured as a target for 'greasing the wheels' of the economy (Krugman, 1998).
A number of studies have attempted to estimate threshold inflation rates for a range of countries. Identification of the threshold has, however, generally been a matter of debate because of lack of consensus on the specification of the appropriate model for estimating the inflation-growth relationship. This is probably because the relationship itself changes under shifting inflation regimes. Estimates of threshold inflation are sensitive to the choice of methodology, the sample period, and plausible growth determining factors or 'conditioning' variables in the model specification. International evidence shows a wide range for estimates of threshold inflation. While for industrial countries’ threshold is placed between 1 to 3 per cent, for developing countries, it ranges from eight per cent to 40 per cent (Bruno and Easterly, 1995; Khan and Senhadji, 2002; Sarel, 1996). The results suggest that threshold is not fixed over time across countries - it is time varying and country specific in nature.
For India, since the second half of the 1990s, a number of studies have attempted to estimate threshold inflation. The Chakravarty Committee (RBI, 1985) referred to an inflation rate of four per cent as an acceptable rise in prices. This can be regarded as the first influential fix on the threshold rate of inflation in India. More recent studies have made estimates of threshold inflation using Sarel methodology and these estimates place threshold inflation for India in the range of 4-7 per cent (Kannan and Joshi, 2002; Rangarajan, 1997; RBI, 2003a; Samantaraya and Prasad, 2001; Vasudevan, Bhoi and Dhal, 1998). The estimate of threshold inflation has, however, a shifting perspective (RBI, 2003b). With structural changes in the economy, prolonged price stability at the global level as well as in India and the credible anchoring of inflationary expectations at a lower level, the threshold inflation could also move downwards.
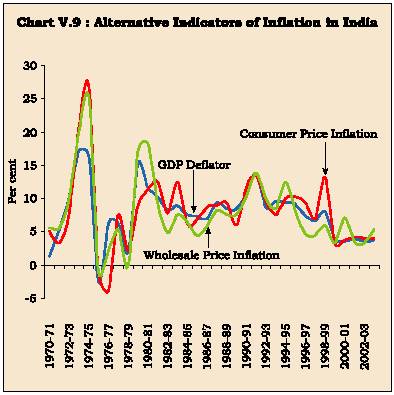
Alternative Indicators of Inflation
5.56 The above analysis of inflation trends is based on movement in wholesale price index (WPI). In addition to WPI, two other key measures of inflation in India are consumer price inflation (industrial workers) and GDP deflator. Inflation measured by these alternative indicators over long-periods of time is broadly the same as that measured by WPI. Illustratively, over the period 1970-2004, WPI inflation averaged 8.0 per cent as compared with 8.2 per cent based on CPI inflation and 7.8 per cent based on GDP deflator and, moreover, the indicators show a fairly high correlation (Table 5.13 and Chart V.9). At the same time, year-to-year movements in alternative indicators often diverge from each other - decadal correlations are lower than the full sample period and do not display any consistent pattern. In particular, during the 1990s, correlation
|
Table 5.13: Alternative Indicators of Inflation in India |
|||
|
(Per cent) |
|||
|
Period |
WPI |
CPI |
GDPD |
|
1 |
2 |
3 |
4 |
|
Average Inflation Rate |
|||
|
1970-2004 |
8.0 |
8.2 |
7.8 |
|
Sub-periods |
|||
|
1970-1980 |
9.0 |
7.7 |
7.7 |
|
1980-1990 |
8.0 |
9.0 |
8.7 |
|
1990-2000 |
8.1 |
9.5 |
8.7 |
|
Standard Deviation |
|||
|
1970-2004 |
5.6 |
5.6 |
4.2 |
|
Sub-periods |
|||
|
1970-1980 |
9.0 |
9.5 |
6.8 |
|
1980-1990 |
3.9 |
2.4 |
1.4 |
|
1990-2000 |
3.6 |
3.0 |
2.6 |
|
Correlation between |
|||
|
WPI |
WPI |
CPI |
|
|
and CPI |
and GDP |
and GDP |
|
|
1970-2004 |
0.83 |
0.88 |
0.81 |
|
Sub-periods |
|||
|
1970-1980 |
0.93 |
0.93 |
0.81 |
|
1980-1990 |
0.59 |
0.84 |
0.64 |
|
1990-2000 |
0.63 |
0.88 |
0.78 |
|
WPI : Wholesale Price Inflation. CPI : Consumer Price Inflation. GDPD : GDP Deflator Inflation. |
|||
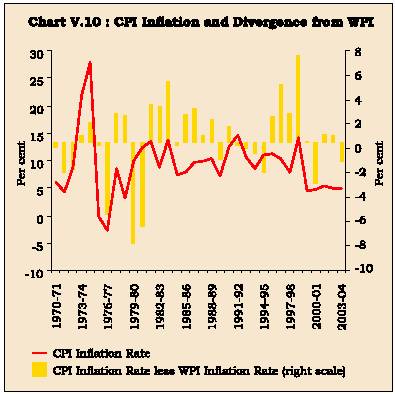
5.57 In recent months, gap between inflation rates based on alternative indicators has persisted. While point-to-point WPI inflation increased from 5.1 per cent at end-October 2003 to 7.1 per cent by October 2004, CPI inflation increased from 3.3 per cent to 4.6 per cent over the same period. The CPI inflation has thus been lower than WPI inflation by more than two percentage points. On earlier occasions, there has also been a divergence between the two measures: at times, CPI inflation has been higher than WPI inflation and vice versa (Chart V.10). While over the period 1970-2004, CPI inflation has exceeded WPI inflation, decadal pattern is not consistent. WPI inflation exceeded CPI inflation during the 1970s and vice versa during the 1980s and 1990s. In the first four years of the current decade, the pattern has again reversed with CPI inflation trailing WPI inflation. Two key factors - coverage and weights - explain the difference between these alternative indicators. Food group has a larger weight in the CPI while services are excluded from the WPI. In regard to trends during 2003-04, the sub-group 'iron and steel' which contributed more than a fifth of overall WPI inflation has almost a negligible weight in the CPI. At the same time, inflation in India in recent months also reflects supply shocks emanating from international markets. The international factors relate primarily to oil but also, to some extent, other commodities and financial markets, including interest rates and exchange rates
5.58 As noted earlier, over long-periods of time, the inflation rates based on alternative measures tend to converge. This suggests that deviations between the various indicators of inflation appear to be self-correcting and the various inflation measures co-move in the long-run (Samanta, 1999). In other words, inflation indicators are co-integrated. This Section attempts to examine the time series properties of the two main indicators - WPI and CPI - using monthly data from April 1980 to March 2004 in a cointegration framework. Formal econometric evidence confirms that WPI and CPI in India are co-integrated and the results of short-run dynamics indicate that the error correction term is statistically significant in the equation for consumer prices. Thus, these results indicate that shocks that cause short-run divergence between the two indices are corrected through movements in the CPI2. The estimated coefficient of the error correction term at 0.034 suggests that more than three per cent of the divergence from the long-run relationship is corrected every month, i.e., almost one-half of the divergence is corrected within one year.
Box V. 6
Goods and Services Inflation
A stylised fact of the global inflation trends is that services inflation has consistently exceeded that in goods inflation. During the most recent decade, the gap between the two was as high as two percentage points in some of the advanced economies such as the US and the UK (Table 5.14). In fact, during the last couple of years, when the world faced a threat of deflation, goods inflation was actually negative and declining even further in a number of the advanced economies. It was the services inflation which held up the headline inflation in countries like the US and the UK and, consequently, the gap between the two series was even higher in 2003.
A number of factors explain the gap. First, services are largely non-tradable and exhibit low productivity. Therefore, the higher services inflation can be attributed to faster productivity growth in manufacturing. Productivity in goods sectors is increasing at a rate of around two per cent per annum - more or less the same rate as the inflation target in most of the advanced economies. If the headline target of two per cent is to be achieved, inflation in goods will have to be close to zero or even declining. Second, as populations age, demand for services gets stronger than that that of goods. With the increasing elderly population in advanced economies, the demand of services has been strong in these economies and this puts pressures on the prices of services. Third, the increased divergence in recent years in the US can also be attributed to sharp exchange rate movements. Although there is evidence that exchange rate pass-through has declined, it appears to have been offset by the large order of appreciation of the US dollar in the 1990s. This appreciation moderated goods inflation while leaving services inflation unaffected (Clark, 2004). If this hypothesis is correct, the recent depreciation of the US dollar is expected to reduce the gap in the coming years. Difficulties in measurements of prices of services can also contribute to the divergence. For instance, the quality bias in measurement of services exceeds that of goods.
|
2 |
Co-integration analysis in the Johansen-Juselius framework is undertaken
for the period using monthly data from April 1980 to March 2004. |
|||
|
LWPI = -0.6 + 0.91 LCPI |
||||
|
The error-correction equations are as below: |
||||
|
– |
||||
|
DLWPI = -0.004 ECM(t-1) |
+ lags |
R2 = 0.28 |
DW = 1.96 |
|
|
(0.3) |
||||
|
DLCPI = 0.034 ECM(t-1) |
+ lags |
R –2 = 0.44 |
DW = 1.97 |
|
|
(3.2)* |
||||
|
LWPI and LCPI are logs of wholesale price and consumer price indices,
respectively. Prefix D indicates first difference. |
||||
|
Table 5.14: Goods and Services Inflation in Major Economies |
|||||
|
(Excess of Services over Goods Inflation) |
|||||
|
Period |
Canada |
US |
Euro Area |
UK |
Japan |
|
1 |
2 |
3 |
4 |
5 |
6 |
|
1962-70 |
1.7 |
1.7 |
|||
|
1970-90 |
0.4 |
2.2 |
2.3 |
1.5 |
|
|
1990-2002 |
0.8 |
1.7 |
1.3 |
2.2 |
1.2 |
|
Source : Gagnon, Sabourin and Lavoie (2004). |
|||||
5.59 Divergence between various indicators of headline inflation complicates the conduct of monetary policy as it becomes difficult to make a correct assessment of the potential inflationary pressures based on the available data for the current period. While there are uncertainties, it is perhaps useful to look at the recent inflation history for an assessment of inflationary expectations. Measures of underlying inflation - core inflation - can also be useful (Box V.7). From the viewpoint of formulation of monetary policy, it is the underlying inflation or core inflation that is important and analytical work on defining appropriate 'core inflation' for India may be worth exploring (Reddy, 1999).
Box V.7
Core Inflation
Headline inflation reflects not only the effect of demand pressures but also supply shocks which impart transitory noise and bias to the headline. Thus, a supply shock arising from crop failures will have the effect of raising the headline inflation. On the other hand, a positive supply shock - say, from a good harvest - may reduce the headline inflation for some time even if underlying inflationary pressures are building up. In the event of such supply disturbances, policy actions to counter the impact on the aggregate price level will tend to accentuate the output effects of the disturbances, generating a short-run conflict between the central bank's inflation and output objectives. According to Woodford (2003), it is the stickiness in prices that leads to deviation of actual output from its natural (potential) level of output. As all goods prices are not sticky, central banks should target a measure of core inflation that places greater weight on those prices which are stickier.
The term core inflation was propounded by Eckstein (1982) who defined it as 'the trend increase of the cost of factors of production' that 'originates in the long-term expectations of inflation in the minds of households and businesses, in the contractual arrangements which sustain the wage-price momentum, and in the tax system'. A number of approaches are used to compute core inflation. The most common approach is the 'exclusion' approach which excludes specific components of the headline inflation that are regarded as subject to extreme price variations due to temporary factors. A key feature of this method is its simplicity. A major criticism of this approach is that temporary disturbances are not necessarily limited to specific sub-components. Moreover, completely removing the volatile items has the potential risk of a permanent loss of significant information. These weaknesses are overcome to some extent by the limited influence estimator approach of Bryan and Cecchetti (1993). The basic premise of this approach is that in the face of relative price shocks, the empirical distribution of disaggregated price change is not normal and hence the sample mean looses its robustness. Under these circumstances, a robust measure of core inflation can be devised through statistical measures of trimmed mean or weighted median. Under the trimmed mean approach, the sample points are rearranged from the lowest to the highest values, and a fixed percentage of the lowest and highest sample points is ignored in computing the mean value. However, by excluding components experiencing a very large relative price change, the trimmed mean method may miss price changes that provide useful information on trend inflation. If prices of some goods adjust faster than others, trimming the large price changes will exclude such quick-to-rise components that signal a shift in aggregate demand and underlying inflation trend (Clark, 2003).
A third approach estimates core inflation through a structural Vector Auto Regression (VAR) method (Quah and Vahey, 1995). The authors define core inflation as that component of measured inflation that has no long-run impact on real output - a notion consistent with the vertical long-run Phillips Curve interpretation of movement in inflation and output. This definition excludes the impact of supply shocks that may have a permanent impact on the price level, but no lasting impact on the rate of inflation. The underlying proposition of this approach that inflation is neutral in its effects on the real economy is debatable; and, if it is assumed that the proposition is correct, then it raises the issue as to why should a central bank be concerned about price stability (Wynne, 1999). Morana (2004) has recently attempted to compute core inflation, based on recent theoretical developments in the estimation of fractionally co-integrated process. Howsoever, they are measured, for core measures to be useful for monetary policy formulation, they should be computable in real time and have some predictive power for future inflation (Wynne, 1999).
Two alternatives, exclusion-based and limited influence estimators (trimmed mean), have been examined for India (Samanta, 1999; Mohanty, Rath and Ramaiah, 2000). However, the loss of information content in the construction of core inflation and the relatively greater public acceptability of the headline inflation make the core measures useful only as indicators of the underlying inflationary process rather than as policy targets. Furthermore, in developing countries, a measure of core inflation excluding food items - which can account for more than half of the weight in the index -may not be very meaningful (Jalan, 2002).
5.60 A related issue is the relevance of inflation targeting for a country like India. As discussed in Section I, during the 1990s, both IT and non-IT countries have succeeded in reducing inflation and there is no clear evidence that IT countries perform better than non-IT countries. As the empirical evidence showed, the record of EMEs that have adopted IT is relatively weaker than that of advanced economies for a variety of reasons discussed earlier. In addition, there are several constraints such as recurrent supply shocks, persistence of fiscal dominance and absence of fully integrated financial markets in pursuing an IT framework in India (RBI, 2000a; Jalan 2002) (see Chapter III).
Modelling Inflation in India
5.61 Monetary policy affects output and prices with lags. Accordingly, for a forward-looking monetary policy, a key input is estimates of the future path of inflation and demand conditions. A number of approaches are available for modelling inflation and deriving inflation expectations such as model-based forecasts or breakeven inflation rates (Box V.8). A common approach to modelling inflation is provided by estimating a short-run aggregate supply curve, i.e., Phillips curve which relates inflation to demand pressures in the economy. The Phillips Curve appears to be one of the few ways to forecast inflation that have been reliable (Stock and Watson, 2001)3. Actual inflation movements are
Box V.8
Inflation Indexed Bonds and Inflation Expectations
Apart from model-based forecasts and periodic surveys of inflation expectations, inflation-indexed bonds provide central banks an estimate of the likely outturn of inflation. Indexed-bonds are particularly attractive, with the advantage of being available for a wide range of maturities, entirely forward looking, timely and updated every working day.
Assuming that the real yield promised by an inflation indexed bond equals the expected real yield on a conventional bond of a similar maturity, the 'breakeven inflation rate' - difference between the conventional bond's nominal yield and the indexed bond's real yield - roughly equals the expected inflation plus risk premium. With an unchanged inflation risk premium, if conventional bond yields rise and indexed bond yields are unchanged, one can infer that there has been a rise in inflation expectations. If yields on conventional and indexed bonds rise by the same amount, one can infer that real interest rates have risen with no change in expected inflation. Looking at conventional and indexed Treasury bonds with various maturities, one can obtain information about real interest rates and market expectations of inflation over various horizons.
Although useful and quite simple, inflation expectations derived from indexed bonds have some limitations (Bernanke, 2004). First, since the breakeven inflation rate includes an (unknown) inflation risk premium, it does not give an estimate of the level of expected inflation per se. Thus, breakeven inflation rates provide an overestimate of the expected inflation. Second, inflation risk premium itself could change over time which further complicates the analysis. Third, the stock of indexed-bonds is typically quite small compared to conventional bonds and hence indexed bonds might also include some liquidity premium. Illustratively, due to a rise in demand for indexed-bonds by various investors such as insurance companies, breakeven inflation rates derived from French government bonds increased in early 2004 without any increase in inflation expectations (Noyer, 2004). Fourth, yields on indexed-bonds are linked to headline inflation whereas monetary policy-makers are more interested in core inflation. This link with headline inflation makes inflation expectations derived from indexed-bonds much more volatile than true expectations. In view of the above factors, the various biases, although small, may add together in a potentially non-systematic way and breakeven inflation rates may, therefore, not be a reliable guide about the expected inflation rate (Dudley et al., 1996; Bernanke, 2004).
Capital Indexed Bonds in India
In India, one variant of capital indexed bonds (CIBs) (viz., 6 per cent Capital Indexed Bond 2002) was issued for the first time on December 29, 1997. Subsequently, there was no further issuance of CIB mainly due to lack of an enthusiastic response of market participants for the instrument. Taking into account past experience as well as the internationally popular structure of CIBs, a modified structure of CIBs is proposed to be introduced. The proposed CIB would offer inflation-linked returns on both the coupons and principal repayments at maturity. The coupon rate for the bonds would be specified in real terms. Such real coupon rate would be applied to the inflation-adjusted principal to calculate the periodic semi-annual coupon payments. The principal repayment at maturity would be the inflation-adjusted principal amount or its original par value, whichever is greater. There is thus an in-built insurance that at the time of redemption the principal value would not fall below par. The proposed CIB would facilitate measuring the inflation expectations of the market participants and provide a useful input in assessing the inflation conditions in the conduct of monetary policy.
3 Atkeson and Ohanian (2001) argue that this approach is not reliable. This finding is believed to be special to the sample period of their study period (Fisher, Lin and Zhou, 2002).
influenced not only by demand side pressures but also by supply shocks. A stylised fact in regard to inflation movements is that it exhibits an inertia indicating that expectations are largely adaptive (Fuhrer and Moore, 1995; Mankiw, 2001). Lagged inflation, therefore, remains an important determinant of inflation and the lags could reflect the structure of the economy. An augmented Phillips Curve extended to include supply shocks and incorporate adaptive expectations - termed as the 'triangle model of inflation' - provides more robust estimates of inflation (Gordon, 1997). The phrase triangle stresses that inflation depends on a tripartite set of basic determinants: inertia (in inflation), demand and supply shocks as follows.
pt = a(L) pt-1 + b(L)Dt + c(L)zt.
where, pt, D and t,Zt denote inflation, a measure of
excess demand (unemployment gap or output gap) and supply shocks (foodgrains prices or imported inflation or exchange rate movements), respectively. The above framework is especially relevant for emerging markets where supply side shocks can heavily dominate year-to-year inflation. A recent survey of inflation determinants in EMEs shows that conventional determinants of inflation such as output gaps, excess money supply and wages have a significant influence on inflation. At the same time, supply shocks emanating from food prices are the most common inflation determinant in almost all EMEs followed by exchange rate movements (Mohanty and Klau, 2001). This section, therefore, models inflation for India by estimating a Phillips Curve which includes both demand and supply side factors.
5.62 Although in the medium-term, alternative indicators of inflation may show a similar order of variation, year-to-year movements, as noted earlier, in the various measures could differ due to differencesin the coverage and weighing scheme. An attempt is, therefore, made to model the behaviour of the three major measures of inflation in India: wholesale price inflation, consumer price inflation and inflation based on GDP deflator. Excess demand in the economy is proxied by output gap defined as actual output less potential output (as percent of potential output)4. Foodgrains inflation is included in the equation to incorporate supply shocks that could be on account of weather conditions as well as the administered pricing mechanism (procurement prices).
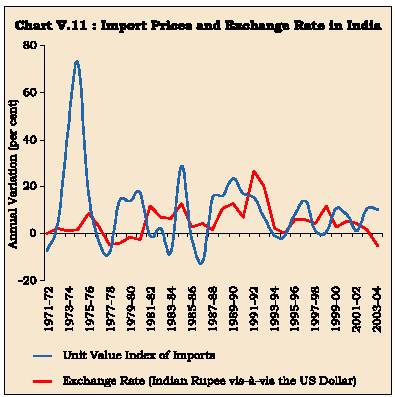
5.63 With gradual opening up of the Indian economy, international prices have started to play a key role in domestic inflation. Import prices in local currency terms include not only the effect of international prices but also exchange rate movements. There are periods when the exchange rate has appreciated while import prices have increased and vice versa (Chart V.11). Movements in import prices in rupee terms could, therefore, be on account of movements in the import prices in foreign currency or in exchange rate or a combination of both. Segregating the influences of import prices in foreign currency on domestic inflation from that of the exchange rate movements could provide additional analytical insights in understanding the inflation process (Mihaljek and Klau, 2001). Accordingly, the equation includes import price inflation (in US dollar terms) and exchange rate separately.
5.64 In brief, the explanatory variables include: lagged inflation, output gap, foodgrains inflation, import price inflation in US dollar terms and variation in exchange rate of the Indian rupee (vis-a-vis the US dollar). The equations are estimated over the period 1970-2004 using annual data5. The explanatory power of the equation is satisfactory, ranging from 60-92 per cent6. The various diagnostic tests such as serial correlation and ARCH errors suggest that estimates are robust.
|
4 |
Potential output is measured by applying HP filter to real GDP. |
|||||||
|
5 |
Unit root tests based on ADF tests indicate that all the variables are stationary. The order selection was based on AIC as well as BIC criteria. |
|||||||
|
6 |
INFWPI = |
0.15 INFWPI(-1) + |
0.41 YGAP(-1) + 0.59 INFFOOD + 0.11 UVMGD + |
0.14 DEXC(-1) + |
9.0 DUM8081 – |
4.6 DUM97 |
||
|
(2.7) |
(2.0) (12.7) |
(6.2) |
(2.6) |
(18.3) |
(13.3) |
|||
|
– |
||||||||
|
Durbin’s h = 0.1; |
R2 = 0.86 |
|||||||
|
INFCPI = |
0.18 INFCPI(-1) + |
0.31 YGAP(-1) + 0.78 INFFOOD + 0.05 UVMGD + |
0.08 DEXC(-2) – 5.3 DUM92 – 3.0 DUM00 |
|||||
|
(3.8) |
(2.4) (21.2) |
(3.0) |
(2.0) |
(5.4) |
(5.5) |
|||
|
– |
||||||||
|
Durbin’s h = -0.7; |
R2 = 0.92 |
|||||||
|
INFGDP = 0.26 INFGDP(-1) + 0.56 YGAP(-1) + 0.53 INFFOOD + 0.08 UVMGD + 0.17 DEXC(-1) + |
7.2 DUM80 – 7.3 DUM75 - |
3.4 DUM00 |
||||||
|
(2.3) |
(2.4) (7.2) |
(3.4) |
(1.7) |
(5.0) |
(4.0) |
(3.6) |
||
|
– |
||||||||
|
Durbin’s h = -1.2; |
R2 = 0.59 |
|||||||
|
INFWPI, INFCPI and INFGDP denote annual averages of WPI inflation rate, CPI inflation rate (for industrial workers) and GDP deflator, respectively. Amongst explanatory variables, YGAP, INFFOOD, UVMGD and DEXC are output gap (HP filtered), foodgrains inflation rate, import price inflation (variation in DGCI&S import unit values deflated by Rupee-US dollar exchange rate) and variation in exchange rate (Rupees per US dollar), respectively. DUM75, DUM80, DUM8081, DUM92, DUM97 and DUM00 are dummies for 1974-75, 1979-80, 1979- 81, 1991-92, 1996-97 and 1999-00, respectively. The equations have been estimated over the period 1970-2004, although the actual estima- tion period starts from 1972 or 1973 in view of lags. t-ratios are in parentheses. |
||||||||
5.65 Key results emerging from these estimates are as follows. First, lagged inflation is significant although the size of the coefficient is not very large. This suggests that inflation may be persistent, i.e., a shock that raises inflation in one year will impart an upward push to inflation expectations in the year ahead and vice versa. Amongst the three measures of inflation, the persistence appears to be maximum for GDP deflator measure and the lowest for wholesale price inflation. Second, excess domestic demand conditions have the expected positive effect on inflation. An increase of one percentage point in output gap (i.e., if actual output exceeds its trend level by one per cent) raises inflation rate by 31-56 basis points with a lag of one year, depending upon the inflation measure. The effect is maximum in case of GDP deflator and the least in the case of consumer price inflation.
5.66 Third, the supply shocks emanating from foodgrains prices play an important role in the inflation process in India. Fourth, import price inflation has the expected positive effect on domestic inflation. Estimates suggest that an increase of 10 per cent in import price inflation raises domestic inflation by up to 1.1 percentage points. The effect is the minimum for CPI inflation (0.5 percentage points) followed by GDP deflator (0.8 percentage points) and wholesale inflation (1.1 percentage points). These estimates appear to be consistent with the openness of the Indian economy over the sample period - an average of around nine per cent, increasing from four per cent to 13 per cent. Finally, exchange rate depreciation has also the expected effect of raising domestic prices and the coefficient of exchange rate pass-through to domestic inflation ranges between 8-17 basis points, i.e., a 10 per cent depreciation of the Indian rupee (vis-a-vis the US dollar) would, other things remaining unchanged, increase consumer inflation by less than one percentage point and the GDP deflator by 1.7 percentage points. The empirical results throw some differences between the pass-through from import price inflation and exchange rate movements. While import prices impact on domestic inflation in the same year, the exchange rate movements seem to affect inflation with a lag of one year (two years in case of consumer inflation). Another difference is that the pass-through from exchange rates to inflation is somewhat larger than that of pass-through from import prices. This result is consistent with available empirical evidence for the EMEs. Mihaljek and Klau (2001) who undertake separate estimates of the two pass-through effects for a sample of 13 EMEs find that the exchange rate pass-through coefficient to consumer price inflation is larger than that of import price inflation in seven countries; the coefficient is the same in four countries and lower in the remaining two countries. In contrast, for a sample of nine industrial economies, McCarthy (2000) finds that the effect of import prices on inflation is stronger than that of exchange rate.
5.67 Compared to many other EMEs, pass-through coefficients in India are fairly small (Table 5.15). This could be attributed to two key factors: the relatively low degree of openness of the Indian economy as well as low inflation rates. Most studies document that pass-through is high in a high-inflation environment.
|
Table 5.15: Estimates of Pass-through to Domestic Inflation |
|||
|
Study |
Country |
Pass-through to |
|
|
Domestic Inflation from |
|||
|
Exchange Rates |
Import Prices |
||
|
1 |
2 |
3 |
4 |
|
Mihaljek |
Mexico |
0.94 |
0.22 |
|
and Klau |
Brazil |
0.84 |
0.17 |
|
(2001) |
Turkey |
0.56 |
0.52 |
|
Hungary |
0.54 |
0.43 |
|
|
Poland |
0.45 |
0.32 |
|
|
Thailand |
0.28 |
0.03 |
|
|
Philippines |
0.17 |
0.11 |
|
|
South Africa |
0.14 |
0.16 |
|
|
Korea |
0.13 |
0.07 |
|
|
Peru |
0.11 |
0.22 |
|
|
Malaysia |
0.07 |
0.05 |
|
|
Chile |
0.07 |
0.04 |
|
|
Czech Republic |
0.06 |
0.49 |
|
|
This Chapter |
India |
0.08-0.17 |
0.05-0.11 |
5.68 The Indian economy has witnessed significant structural changes since the reforms process began in early 1990s. These could have impacted upon the coefficient estimates. Formal stability tests such as Andrews and Andrews-Ploberger tests suggest that parameter estimates have been stable over the sample. Rolling regressions provide an alternative approach of assessing if parameters are stable over the period. For this purpose, rolling regressions (based on a moving sample of 20 years) are undertaken. The results from this analysis can be summarised as follows (Chart V.12). First, there is some increase in the coefficient on lagged inflation, i.e., inflation persistence appears to have increased. Second, the coefficient on output gap remains almost unchanged in the equations for consumer price inflation and GDP deflator. For WPI equation, the coefficient shows some decline, but is imprecisely
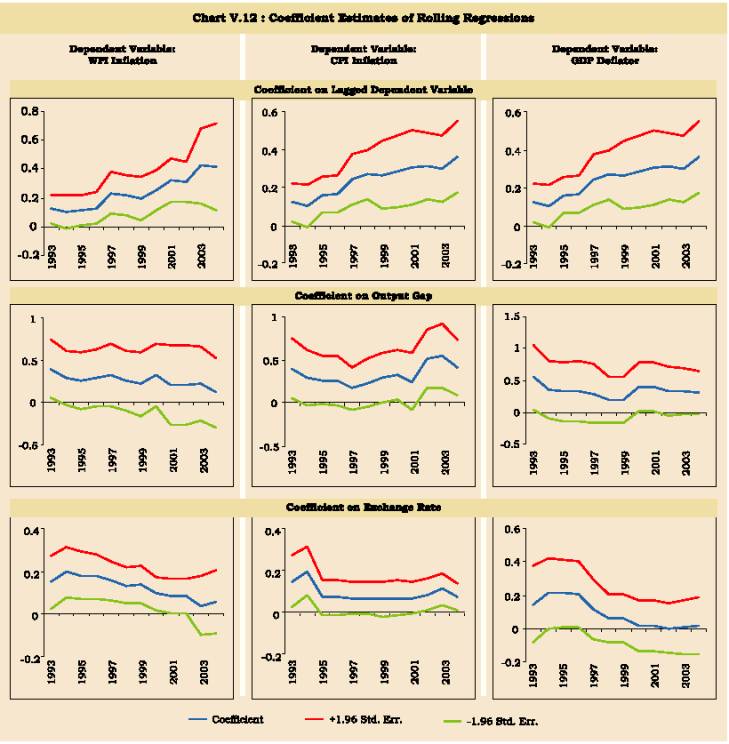
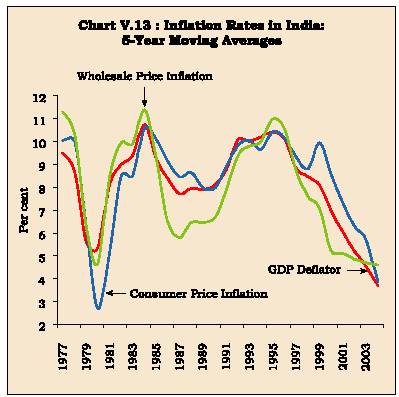
5.69 Third, the coefficient on the exchange rate exhibits a declining trend although the estimates turn out to be somewhat imprecise. This suggests a possible decline in exchange rate pass-through to domestic inflation - these results appear to be consistent with the empirical exercise undertaken in Chapter VII which shows a lower pass-through in the recent decade. The decline in pass-through during the 1990s is consistent with the cross-country empirical evidence discussed earlier. In India, as noted earlier, inflation rates have declined significantly since the second half of the 1990s and this could be one explanation for the lower pass-through (Chart V.13). Another key factor that could have lowered the pass-through is the phased decline in tariffs as well as non-tariff barriers such as quotas. Average import duties are now less than one-third of what they were a decade ago. This steep reduction in tariffs could have easily allowed domestic producers to absorb some part of the exchange rate depreciation without any effect on their profitability.
5.70 The regression results are subject to the caveat that these are average estimates over the
5.71 In brief, while supply shocks - both oil and food - have an important role in year-to-year inflation, expansionary fiscal policy during the 1980s and its monetisation was indeed a major cause of the increase in inflation. Structural reforms, improved monetary-fiscal interface, reforms in the Government securities markets and effective sterilisation of capital inflows enabled better monetary management from the second half of the 1990s onwards. Large food stocks and foreign exchange reserves have played an important role in supply management efforts by keeping actual inflation low and inflation expectations under control. This was amply exhibited during 2002-03 when the country faced its worst drought in nearly two decades but adequate food stocks and large reserves kept inflation as well as expectations low. This has led to a sustained reduction in inflation, notwithstanding increases in some years due to large supply shocks. Empirical exercise undertaken in this Section confirms that both demand and supply shocks have an impact on inflation. Excess demand conditions increase inflation. There is some preliminary evidence that exchange rate pass-through to domestic inflation has declined since mid-1990s.
5.72 The success with achieving and maintaining low inflation since mid-1990s has led to a number of positive developments (Reddy, 2004). First, there is virtually a national consensus that high inflation is not good and that it should be brought down. Second, inflation expectations have come down and, consequently, inflation tolerance has also come down. 'The society, the economic agents and the market participants are now reacting to a lower headline inflation, which is a good thing because if we want a sustained strong growth, it is necessary to rein in inflationary expectations' (Reddy, 2004).
In this context, despite a significant improvement in the monetary-fiscal interface during the 1990s, fiscal dominance continues to persist with growing volume of gross market borrowings (RBI, 2003). Inflation expectations, inter alia, depend upon fiscal prudence. It is, therefore, essential to pursue fiscal consolidation, promptly and with resolve, from a medium-term perspective. In this context, the Fiscal Responsibility and Budget Management (FRBM) Act enacted by the Central Government is expected to provide the Reserve Bank necessary flexibility to maintain low and stable inflation. Adherence to these fiscal rules thus become important to stabilise inflation expectations.
III. CONCLUDING OBSERVATIONS
5.73 This Chapter has undertaken an assessment of the inflation record of the past half-century. Consensus has emerged that monetary policy can contribute to growth and employment by ensuring price stability - defined as low and stable inflation. In the short-run, supply shocks can lead to large changes in the headline inflation. However, persistent high inflation is ultimately the outcome of lax monetary policies - as witnessed during the 1970s. With inflation in double digits, central banks in advanced economies adopted deliberate disinflation strategies beginning in the late 1970s. Monetary policies were tightened and industrial economies could reduce inflation significantly by the second half of the 1980s, albeit at costs of large output and employment losses. Developing countries have also been able to reduce inflation during the 1990s as fiscal consolidation and structural reforms provided flexibility to monetary policy in meeting its price stability objective. The experience with inflation targeting frameworks is evolving - both IT and non-IT countries have been successful in reducing inflation during the 1990s. Many EMEs have also adopted IT. Their performance is quite impressive when judged in terms of the reduction in inflation although they have not been always able to meet their inflation targets. However, compared with many advanced economies, their performance is relatively weaker, reflecting additional constraints on these economies. Moreover, the stylised fact of the 1990s has been that not only IT countries but even non-IT countries have been able to reduce inflation. The jury is still out on the extent to which inflation targeting policies have actually contributed to the reduction in inflation that has occurred (Mohan, 2004a). Exchange rate pass-through to domestic prices has declined during the 1990s for advanced as well as developing economies, inter alia, due to success of monetary policy in maintaining a low and stable inflation environment.
5.74 Overall, improvements in the institutional setup of monetary policy - independent central banks, better communication strategies, increased transparency, improved techniques - have been a key factor contributing to low and stable inflation although the relative role of monetary policy per se in containing inflation continues to be matter of debate. Prudent fiscal policies, structural reforms, productivity growth, deregulation, globalisation and competition have also contributed in achieving the low inflation environment. A reversal in the trend of any of these above factors can, in turn, be a threat to this low inflation environment (Rogoff, 2003). As discussed in Chapter IV, current global macroeconomic imbalances and concomitant adjustment dynamics present one such threat to price stability (Mohan, 2004a). Evolving demographics - rising elderly populations in advanced economies - pose a new challenge to fiscal authorities (Mohan, 2004b). The concomitant rising public debt can be a threat to the present low inflation environment. A prudent fiscal policy remains the single largest pre-requisite for monetary stability. Monetary arrangements per se have only limited power to fix real problems arising from a fiscal regime inconsistent with the goal of price stability (IMF, 2002). Efforts towards fiscal consolidation have, therefore, been strengthened with clear-cut fiscal rules. Successful monetary policy involves shaping market expectations of the way in which inflation and other critical variables are likely to evolve. The various reforms in the monetary policy arena since 1980s such as central bank independence, accountability through clear-cut targets and transparency have been progressively aimed at enhancing the credibility of the central banks in order to stabilise inflation expectations. Once inflation expectations are stabilised firmly, temporary shocks to current inflation do not have any adverse impact on long-run inflation expectations.
5.75 In India, inflation increased from the 1970s onwards before moderating in mid-1990s. Expansionary fiscal policy during the 1980s and its monetisation were a major cause of the increase in inflation. Structural reforms since the early 1990s coupled with improved monetary-fiscal interface and reforms in Government securities markets enabled better monetary management since the second half of the 1990s. The expansionary effect emanating from massive capital flows to India since 1993-94 has been effectively sterilised through a variety of instrumentsincluding open market sales of Government bonds and repo operations under liquidity adjustment facility. Judicious use of innovative instruments such as the Market Stabilisation Bills/Bonds was resorted to manage liquidity conditions consistent with the objective of price stability. Thus, notwithstanding the unprecedented order of external capital flows, monetary management was effective in ensuring a reduction in inflation and lowering inflation expectations. There is a widespread agreement that the record of the Reserve Bank in monetary management has been, on balance, satisfactory. The degree of credibility that the Reserve Bank has earned over time is in itself likely to be an effective instrument of monetary policy in meeting the challenges of the future (Jadhav, 2003).
5.76 The success with achieving and maintaining low inflation in India since mid-1990s has led to a number of positive developments (Reddy, 2004). First, there is virtually a national consensus that high inflation is not good and that it should be brought down. Second, inflation expectations have come down and, consequently, inflation tolerance has also come down. As the global experience shows, it is very important to keep inflation expectations low. Inflation expectations, inter alia, depend upon fiscal prudence. It is, therefore, essential to pursue fiscal consolidation, promptly and with resolve, from a medium-term perspective. Transparent and monitorable fiscal rules assume importance in this context. The recently enacted Fiscal Responsibility and Budget Management Act by the Central Government with its envisaged reduction in key deficit indicators is expected to reduce the fiscal dominance over time and will provide the Reserve Bank necessary flexibility so as to maintain low and stable inflation. It would be necessary to put in place similar fiscal responsibility rules at State levels. Adherence to these fiscal rules will help to stabilise inflation expectations and keep inflation low and stable in the country.
|
Annex V.1 |
||||||||
|
Implementation and Design of Inflation Targeting |
||||||||
|
Country |
Date |
Target Price |
Target Width |
Target |
Escape |
Accountability |
Target set |
Publications |
|
Introduced |
Index |
Horizon |
Clauses |
of Target Misses |
by |
and Accountability |
||
|
1 |
2 |
3 |
4 |
5 |
6 |
7 |
8 |
9 |
|
Australia |
Sept. 1994 |
Core CPI |
2-3% |
Overone business cycle |
None |
None |
Jointly by Government and Central Bank |
Inflation report. Inflation projections (2-year point estimate) |
|
Brazil |
Jun. 1999 |
Headline CPI |
1999:8% |
1 year |
None |
Issuance of open letter to Minister of Finance explaining target breach and measures taken (and the time required) to bring inflation within he target |
Government in consultation with Central Bank |
Inflation report. Inflation projections (2- year fan chart) Extract of Board meetings. Models used for inflation outlook. |
|
Canada |
Feb. 1991 |
CoreCPI (excl.food,energy, and indirect taxes) |
1991: 3-5% |
1991: 22months Since1992: multi-year |
Revision of target path under exceptional circumstances (ex.major oil price shock,naturaldisaster) |
Public explanation |
Jointly byGovernment andCentral Bank |
Monetary policyInflation projectionspoint(1-yearestimate)report. |
|
Chile |
Jan. 1991 |
Headline CPI |
1991: 15-20% |
1991-2000: |
None | None |
Central Bank in consultation with Government |
Inflation report (2000). Minutes of monetary policy meetings. Inflation projections (2-year fan chart) |
| Colombia | Sep.1999 | Headline CPI | 1999:
15% 2000: 10% 2001: 8% 2002: 6% |
1 year | None | None | Jointly
by Government and Central Bank |
Inflation report |
|
Czech Republic |
Jan. 1998 |
Core CPI (excl. regulated prices and indirect taxes) |
1998: 5.5-6.5% 1999: 4-5% 2000:3.5-5.5% 2001: 2-4% |
1 year |
Natural disasters, global raw material price shocks, exchange rate shocks unrelated to domestic economic fundamentals and monetary policy, and agricultural production shocks |
None | Central Bank |
Inflation report (1998) Minutes of monetary policy meetings. Inflation projections (1-year range) |
|
Annex V.1 |
||||||||
|
Implementation and Design of Inflation Targeting(Contd...) |
||||||||
| Country |
Date Introduced |
Target Price Index |
Target Width |
Target Horizon |
Escape Clauses |
Accountability of Target Misses |
Target set by |
Publications and Accountability |
| 1 | 2 | 3 | 4 | 5 | 6 | 7 | 8 | 9 |
| Finland |
Feb. 1993 to Jun. 1998 |
Core CPI (excl. indirect taxex, subsidies, housing prices, and mortgage interest) |
Annual average of 2% by 1995 |
Until 1995: multi-year. Since 1996: indefinite |
None | None | Central Bank | None |
| Israel | Jan. 1992 | Headline CPI |
1992: 14-15% 1993: 10% 1994: 8% 1995: 8-11% 1996: 8-10% 1997: 7-10% 1998: 7-10% 1999: 4% 2000: 3-4% 2001: 3-4% |
1 year | None |
Public explanation of deviation of inflation forecast from target in excess of 1% |
Government in consultation with Central Bank |
Inflation report (1998) |
| Korea, Rep. |
Jan. 1998 | |
1998:
9% (+1%) 1999: 3% (+1%) 2000 : 2.5% (+1%) 2001 onwards: 2.5% |
1998-2000:
1 year.2001 onwards : indefinite |
None
(before 2000: changes caused by major forces) |
None | Government in consultation with Central Bank |
Inflation
report and submission to Parliament. Monthly announcement of monetary policy direction. Minutes of monetary policy meetings. |
| Mexico | Jan. 1999 | Headline CPI |
1999: 13% 2000: <10% 2001: 6.5% 2002: 4.5% 2003: similar to trade partners inflation (3%) |
1998-2002: 1 year. 2002 onwards : indefinite |
None | None | Central Bank | Inflation report |
|
New Zealand |
Mar. 1990 |
Headline CPI (since 1999, headline CPI excludes interest changes; prior to then, targets where defined in terms of the headline CPI less interest charges and other first round effect prices) |
1990: 3-5% 1991: 2.5-4.5% 1992: 1.5-3.5% 1993-1996: 0.2% Since 1997 0-3% |
1990-1992: 1 year. 1993-1996: multi-year. Since 1997: indefinite |
Unusual events provided they do not cause general inflationary pressures |
Public explanation of target breach and measures taken (and the time required to bring inflation within the target. Minister of Finance may ask for resignation of RBNZ Governor. |
Jointly by Government and Central Bank |
Inflation report (1990). Inflation projections. |
|
Annex V.1 Implementation and Design of Inflation Targeting (Concld.) |
||||||||
| Country |
Date Introduced |
Target Price Index |
Target Width |
Target Horizon |
Escape Clauses |
Accountability of Target Misses |
Target setby |
Publicationsand Accountability |
| 1 | 2 | 3 | 4 | 5 | 6 | 7 | 8 | 9 |
| Peru | Jan. 1994 | Headline CPI |
1994: 15-20% 1995: 9-11% 1996: 9.5-10% 1997: 8-10% 1998: 7.5-9% 1999: 5-6% 2000: 3.5-4% 2001: 2.5-3-5% 2002: 1.5-2.5% 2003: 1.5-2.5% |
1 year | None | None |
Central Bank in consultation with Government |
None |
| Poland | Oct. 1998 | Headline CPI | 1998:
< 9.5% 1999: 6.6-7.8% 2000: 5.4-6.8% 2001: <4% |
1998-2000:
1 year.2000-2003: multi-year . 2003 onwards: indefinite |
None | None | Central Bank | Inflation
report. Inflation guidelines. Report on Monetary Policy Implementation |
| South Africa |
Feb. 2000 | Core CPI (excl. Interest costs) |
2003: 3-6% | Multi-year | Major
unforeseen events outside CB control |
None | Central Bank | Inflation report |
| Spain | Nov.
1994 to Jun. 1998 |
Headline CPI | Jun.
1996: 3.5-4% 1997: 2.5% 1998: 2% |
Until 1996: multi-year |
None | None | Central Bank | Governor
reports regularly to Parliament. Inflation report (1995) |
| Sweden | Jan. 1993 | Headline CPI | Since
1995: 2% (+ 1%) |
Until 1995: multi-year.Since 1995: indefinite |
None | None | Central Bank | Inflation
report (1997) Minutes of monetary policy meetings. Inflation projections (2-year fan chart)Submission of monetary policy report to Parliament |
| Switzer- land |
Jan. 2000 | Headline CPI | <2% | 3 years | Unusual events provided they do not cause general inflationary pressures |
None | Central Bank | Inflation
report Inflation projections (3 years) |
| Thailand | Apr. 2000 |
Core CPI (excl. raw food and energy prices) |
2000: 0-3.5% | Indefinite | None |
Public explanation of target breach and measures taken (and the time required) to bring inflation within the target |
Government in consultation with Central Bank |
Inflation report (2000) inflation projections (2-year fan chart). Minutes of monetary policy meetings. |
|
United Kingdom |
Oct. 1992 |
RPIX (excl. m o r t g a g e interest) |
1992-1995: 1-4% Since 1996: 2.5% |
Until 1995: multi-year Since 1996: Indefinite |
None |
Issuance of open letter to the Minister of Finance explain- ing target breach and measures taken (and the time required) to bring the inflation within the target |
Government |
Inflation report. Inflation projections (2-year fan chart) Models used for inflationoutlook. |
| Source : Mishkin and Klaus (2001). | ||||||||

Share this page:


Install the RBI mobile application and get quick access to the latest news!
Scan the QR code to install our app


Page Last Updated on:


