 IST,
IST,


VI Management of Capital Flows (Part 2 of 3)
Liberalisation of norms relating to FDI and adoption of a policy stance supportive of globalisation do not by themselves ensure that the economy would attain a high growth path. On the contrary, such policies could, in fact, be inimical to the long-term development process of the country in the absence of adequate ‘safeguards’. If FDI is to be utilised for sustaining the growth process of a country, it is essential to create local technological capabilities. The success of an industry in a globalised scenario hinges on its capacity to effectively cope with technical change. Skill development, industrial specialisation, enterprise learning and industrial restructuring lead to improvement in productivity and help industries to cope with technical change. In order to create such processes within an economy, the government may need to formulate a strategic FDI policy.
A strategic FDI policy entails government intervention in factor markets in order to develop local skills and to target FDI in areas where the country has dynamic comparative advantage (UNCTAD, 2003). The policy of the government should be aimed at reducing macro level inefficiencies and improving micro level conditions. The government should be an effective regulator, being neutral to domestic and foreign capital.
The effectiveness of a strategic FDI policy is, however, an unsettled issue. Some studies suggest that government intervention aimed at affecting FDI flows is at best ineffective and could be counterproductive. It is observed that direct foreign investors were not induced by incentives such as tax concessions or subsidies. Instead, policy measures aimed at strengthening the economic fundamentals of the host economy induced FDI inflows. It has also been argued that industrial policies that seek to direct foreign investment flows towards certain sectors only distort the normal functioning of the market. While such measures do not induce FDI, these can have serious negative implications in the form of reduced competition and creation of excess capacity in certain sectors (McKinsey Global Institute, 2003). competitive position vis-à-vis the rest of the world. Accordingly, the formulation of an effective strategy mainly requires a vision of development, coherence and coordination between its different objectives (Box VI.4).
Modelling FDI Flows
6.47 An empirical exercise was undertaken to find the major factors influencing FDI inflows and outflows for India over the period 1970-71 to 2002-03. FDI inflows were modelled to depend upon growth in world GDP as a proxy for push factors as well as a domestic constraint in terms of the ratio of gross fiscal deficit to GDP, which also proxied for the credit rating of the Indian economy (Ranjan and Nachane, 2003). FDI outflows were hypothesised to be related to the ratio of exports plus imports to GDP, which is taken to reflect the extent of openness of the economy. The results indicate that growth in world GDP has significantly large positive impact on FDI inflows. 2 On the other hand, ratio of gross fiscal deficit to GDP has a negative impact on FDI inflows. Furthermore, FDI outflows varied in tandem with the level of openness of the Indian economy.3
FDI Inflow and Exports
6.48 Empirical analysis based on bivariate vector auto regression (VAR) model using quarterly data on FDI inflows and the growth rate of exports over the period from the first quarter of 1992-93 to third quarter
| 2 | Ln FDIIN | = | -13.13 + | 0.43 Ln FDIIN{-1} + | 3.45 Ln WGDP - 0.82 Ln GFDRATIO + 0.86 DUM94 | ||
| (-4.29)*** | (2.97)*** | (4.50)*** | (-2.54)** | (2.21)** | |||
| R2 | = | 0.97 | h = 0.21 | SEE = 0.32 | |||
| 3 | Ln FDIOUT | = | -10.10 + | 5.22 Ln OPENNESS - | 0.96 DUMFDI1 - | 1.71 DUMFDI2 - | 0.78 DUMFDI3 |
| (-4.73)*** | (5.96)*** | (-1.17) | (-1.95)* | (-1.36) | |||
| R –2 | = | 0.61 | DW = 1.69 | SEE = 1.09 | |||
| Where FDIIN | = | Foreign direct investment inflows; WGDP= World GDP; | |||||
| GFDRATIO | = | Ratio of gross fiscal deficit to GDP; DUM94= Dummy variable with value one for period after 1993 to capture the policy regime | |||||
| changes with respect to foreign direct investment and zero for previous period; | |||||||
| FDIOUT | = | Foreign Direct Investment outflows; | |||||
| OPENNESS | = | Ratio of export plus imports to GDP. Three dummies were included in the FDIOUT equation to account for abrupt decline in | |||||
| FDI outflows during the period 1974-76 (DUMFDI1), 1986-97 (DUMFDI2) and changes in FDI policy since 1993-94 (DUMFDI3). | |||||||
| Figures in brackets are t-values; ***, ** and * denote the 1, 5 and 10 per cent level of significance, respectively. | |||||||
REPORT ON CURRENCY AND FINANCE
of 2002-03 indicates that there is a uni-directional causal relationship running from FDI to export growth in India.4 Empirical analysis also suggests that an increase in FDI flows leads to rise in export growth to the extent of 1 to 1.5 percentage points over 3-4 quarters. On the other hand, changes in export growth positively affect FDI inflows after a lag of two quarters and the effect could persist for the subsequent three quarters. FDI flows account for up to one-fifth of the total variation in exports over a medium term horizon of about 3-5 years. On the other hand, export growth could explain about one-tenth of total variation in FDI flows over the same horizon.
FDI Outflows
6.49 Overseas investments in JVs and WOSs have been recognised as important channels for promoting global business by Indian entrepreneurs. The rules regarding Indian overseas investments have been progressively relaxed and the procedures have been simplified. Resident corporates and registered partnership firms have been allowed to invest up to 100 per cent of their net worth in overseas joint ventures or wholly owned subsidiaries, without any separate monetary ceiling. In recent years, outward FDI has increased significantly reflecting the global outreach of some Indian companies. The actual investment outflows during the financial year 2002-03 were placed at US $ 654 million as compared with US $ 469 during 2001-02. During April-November 2003, these outflows amounted to US $ 702 million. Since December 1995, 4,645 proposals have been cleared by the Reserve Bank amounting to US $ 9,885 million.
6.50 To sum up, there has been a marked increase in the magnitude of FDI inflows to India during the 1990s reflecting the liberal policy regime and growing investors’ confidence. Inflows from Mauritius and the USA dominated during most of the 1990s, while engineering and chemical and allied products were the most favoured industries. The services and IT sectors have attracted large FDI in recent years. A comparison of FDI flows to China and India suggests that the difference is somewhat less pronounced than what is generally believed, although India still lags behind China in terms of FDI flows. The results of an empirical exercise reveal that the push factors proxied by growth in world GDP play an important role in attracting FDI flows to India. A uni-directional causal relationship running from FDI inflows to export growth is also found in the Indian context.
IV. PORTFOLIO INVESTMENT
6.51 One of the major forces changing the face and structure of international capital markets since 1990s has been the flow of cross border portfolio investments - especially by FIIs, from developed countries to the developing countries. Portfolio investors provide institutional character to the capital markets, flavoured by highly intensive research and diversified investments. FII investments inject global liquidity into the markets, raise the price-earning ratio and thereby reduce the cost of capital. Available evidence suggests a positive relationship between portfolio flows and the growth rate of an economy (Bekaert and Harvey, 2000). Although the issue is far from settled, some studies have also pointed out that foreign portfolio investment in equities promotes (inhibits) growth in countries with comparatively large (small) equity markets and limited (pervasive) corruption (Durham, 2003).
6.52 From the perspective of FIIs, investments in various countries provide a measure of portfolio diversification and hedging as also means to take advantage of arbitrage opportunities. The forces driving the recent change in the investment portfolio of FIIs, as reflected in the growing emphasis on equities of emerging market economies were, inter alia, increased accessibility of these markets after liberalisation, improved marketability, fewer problems relating to thin trading and improved macroeconomic fundamentals of these countries (Avgoustinos et al., 1997). Although the home bias in equities is large, receding home bias in the 1990s can also explain the increased FII inflows to EMEs (Bohn and Tesar, 1996).
6.53 Notwithstanding the merits of FII flows, the Mexican crisis and more recently the East Asian crisis have highlighted the downside risks of such flows. The downside risks include political risk, currency risk, problems associated with low liquidity and volatility on returns. Cross-country studies indicate that reversal of portfolio flows could be disorderly and result in substantial economic hardship for EMEs (Gupta et al., 2002).
4 Null Hypothesis F-Statistic Level of significance FDI does not Granger cause export growth 4.11457 0.01289 Export growth does not Granger cause FDI 1.23969 0.32455
MANAGEMENT OF CAPITAL FLOWS
Volatility of Portfolio Flows
6.54 There is a general consensus that the main problem in managing portfolio flows towards developing countries emanates from the larger volatility associated with such flows as compared to FDI. It has been argued that under the process of globalisation, highly diversified investors participate in cross-border movement of capital. Such investors pay little attention to economic fundamentals and in the presence of asymmetric information they resort to herd behaviour, which results in volatility of international capital flows (Stiglitz, 2000). Such a view has, however, been challenged and it has been argued that there is high level of substitutability between various forms of foreign capital (Claessens et al., 1995).
6.55 Countries with modest growth potentials and semi-developed financial market infrastructure are most vulnerable to reversal of portfolio investment flows (Chen and Khan, 1997). Existence of large asymmetry of information among the domestic companies and foreign investors in such countries can lead to sharp changes in portfolio and private debt flows in the face of even a slight change in investor perception about the health of the recipient economy or its financial system. This type of volatility is, however, not limited to portfolio flows. Even external commercial borrowings in the form of bank borrowing or bond financing show similar patterns.
Portfolio Flows to Developing Countries
6.56 While modest portfolio investment inflows to developing countries started in the 1980s, such flows assumed significant proportions only in the 1990s. Portfolio investment inflows reached a peak in the period prior to the onset of the East Asian crisis, but remained subdued thereafter (Table 6.9 and Chart VI.4). It may be noted that in the entire period since 1970, portfolio investments towards developing
| Table 6.9: Developing Countries: Inward Portfolio Equity Flows and Equity Issuance | |||||||||
| (US $ billion) | |||||||||
| Country | 1990 | 1995 | 1996 | 1997 | 1998 | 1999 | 2000 | 2001 | 2002 |
| 1 | 2 | 3 | 4 | 5 | 6 | 7 | 8 | 9 | 10 |
| Inward Portfolio Equity Flows | |||||||||
| All developing countries | 4.5 | 20.2 | 33.6 | 26.7 | 7.4 | 15.0 | 26.0 | 6.0 | 9.4 |
| Argentina | 0.1 | 1.1 | 1.0 | 1.4 | -0.2 | -10.8 | -3.2 | -0.1 | -0.6 |
| Brazil | 0.1 | 2.8 | 5.8 | 5.1 | -1.8 | 2.6 | 3.1 | 2.5 | 1.2 |
| Chile | 0.4 | -0.2 | 0.7 | 1.7 | 0.6 | 0.5 | -0.4 | -0.2 | -0.1 |
| China | 0.2 | 3.3 | 4.1 | 9.3 | 1.4 | 3.8 | 21.4 | 3.0 | 4.0 |
| India | 0.1 | 1.6 | 4.0 | 2.6 | -0.6 | 2.3 | 1.6 | 1.7 | 0.9 |
| Indonesia | 0.5 | 1.5 | 1.8 | -5.0 | -4.4 | -0.8 | -1.0 | 0.2 | 0.2 |
| Malaysia | 0.4 | 2.2 | 0.8 | -7.8 | -0.4 | 0.1 | -1.9 | -0.7 | 1.0 |
| Mexico | 2.0 | 0.5 | 2.8 | 3.2 | -0.7 | 3.8 | 0.4 | 0.2 | 0.5 |
| Philippines | 0.1 | – | 2.1 | -0.4 | 0.3 | 0.5 | -0.2 | 0.4 | 0.3 |
| Thailand | 0.4 | 2.1 | 1.2 | 3.9 | 0.3 | 0.9 | 0.9 | – | – |
| Turkey | 0.1 | 0.2 | 0.2 | – | -0.5 | 0.4 | 0.5 | -0.1 | 0.1 |
| Gross International Equity Issuance by Developing Countries | |||||||||
| 1995 | 1996 | 1997 | 1998 | 1999 | 2000 | 2001 | 2002 | ||
| All developing countries | 6.4 | 12.6 | 21.4 | 8.0 | 13.5 | 34.3 | 5.7 | 10.9 | |
| Argentina | – | 0.4 | 1.1 | – | 0.3 | 0.4 | – | – | |
| Brazil | 0.2 | 0.4 | 2.4 | 0.1 | 0.2 | 3.1 | 1.1 | 1.1 | |
| Chile | 0.2 | 0.1 | 0.6 | 0.1 | – | – | – | – | |
| China | 0.8 | 2.1 | 9.1 | 1.2 | 3.7 | 21.9 | 2.9 | 5.5 | |
| India | 0.3 | 1.3 | 1.0 | 0.1 | 0.9 | 0.9 | 0.5 | 0.3 | |
| Indonesia | 1.4 | 1.3 | 0.9 | – | 1.2 | – | 0.3 | 0.3 | |
| Malaysia | 0.6 | 0.6 | 0.4 | 0.2 | – | – | – | 1.2 | |
| Mexico | – | 0.7 | 0.8 | – | 0.2 | 3.3 | – | – | |
| Philippines | 0.7 | 0.8 | 0.3 | 0.4 | 0.2 | 0.1 | – | – | |
| Thailand | 0.5 | 0.2 | – | 2.2 | 1.0 | – | 0.2 | 0.1 | |
| Turkey | 0.1 | – | 0.4 | 0.8 | – | 2.4 | – | 0.1 | |
| – : Nil / Negligible. | |||||||||
| Source : Global Development Finance, World Bank, 2003. | |||||||||
REPORT ON CURRENCY AND FINANCE
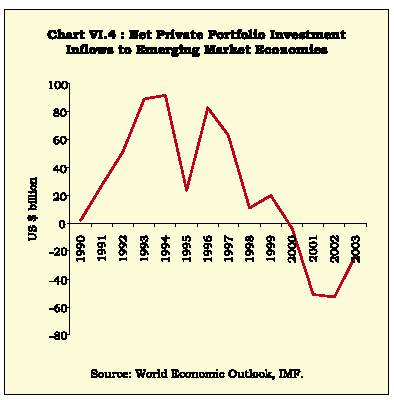
countries remained much smaller than FDI inflows. A cross-country comparison reveals that the pattern of international equity issuance by Indian companies has not been significantly different from other countries, except China.
Determinants of Portfolio Investment
6.57 From a theoretical perspective, portfolio investments are generally expected to originate from countries with high levels of financial market infrastructure but low economic growth potential, i.e., industrialised countries, and directed towards countries with high growth potential but relatively less developed financial markets, i.e. EMEs. Cross-country experience, however, does not support such a linear relationship on a universal basis. Portfolio investment flows originating from the United States and directed towards Latin America were in line with the above description. In Asia, however, portfolio investments have taken place mainly between developing countries with broadly similar growth potentials, although the capital suppliers generally had better financial market infrastructure than the recipient countries (Chen and Khan, 1997).
6.58 The debate on relative importance of domestic and external factors in determining por tfolio investment flows towards a country, however, remains inconclusive. Certain studies highlight greater importance of external factors (Calvo et al., 1993), while some other argue that domestic factors are equally important (Chuhan et al., 1998). Some studies argued that portfolio investment flows to developing countries are decided at two levels. First, the overall quantum of investment for EMEs as a whole is decided by the investors and at the second stage, a decision is taken regarding the allocation of such flows to individual EMEs (Buckberg, 1996).
6.59 The link between cross-border portfolio flows and domestic stock returns, especially the direction of causality also continues to remain a contentious issue. Many studies have found a positive relation between these two variables (Bohn and Tesar, 1996; Richards, 2002). However, it has also been argued that rather than return chasing by foreign portfolio investors, the observed positive relation could be the result of rise in domestic stock prices as a result of foreign portfolio investment (Brennan and Cao, 1997). Certain studies have pointed out that a positive feedback of high stock prices on portfolio inflows in certain East Asian countries was evident before the crisis, but the same did not hold true after the crisis (Kim and Wei, 2000).
Portfolio Investment Flows to India
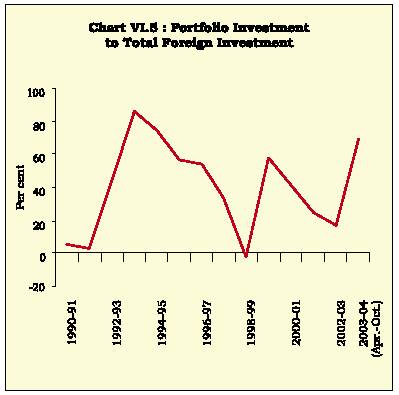
6.60 FII investments first started flowing to India in 1993. Portfolio investment inflows have since then been substantial, with the lone exception of 1998-99 (Chart VI.5). On an annual average basis, India received cross-border portfolio investment to the tune of US $ 2.2 billion per year between 1992-93 and 2002-03; the contribution of FIIs was close to US $ 1.2 billion, on an average. The cumulative FII
MANAGEMENT OF CAPITAL FLOWS
| Table 6.10: Portfolio Investment In India | ||||
| (US $ million) | ||||
| GDRs/ADRs# | FIIs* | Offshore funds | Total | |
| 1 | 2 | 3 | 4 | 5 |
| 1992-93 | 240 | 1 | 3 | 244 |
| 1993-94 | 1,520 | 1,665 | 382 | 3,567 |
| 1994-95 | 2,082 | 1,503 | 239 | 3,824 |
| 1995-96 | 683 | 2,009 | 56 | 2,748 |
| 1996-97 | 1,366 | 1,926 | 20 | 3,312 |
| 1997-98 | 645 | 979 | 204 | 1,828 |
| 1998-99 | 270 | -390 | 59 | -61 |
| 1999-00 | 768 | 2,135 | 123 | 3,026 |
| 2000-01 | 831 | 1,847 | 82 | 2,760 |
| 2001-02 | 477 | 1,505 | 39 | 2,021 |
| 2002-03(P) | 600 | 377 | 2 | 979 |
| P : Provisional. | ||||
| # : Represents the amount raised by Indian corporates through Global Depository Receipts (GDRs) and American Depository Receipts (ADRs). | ||||
| * : Represents fresh inflow of funds by Foreign Institutional Investors. | ||||
| Source : Reserve Bank of India | ||||
investment in India is close to US $ 19 billion. FII investments in India account for over 10 per cent of the total market capitalisation of the Indian stock market.
6.61 ADR/GDR issues by Indian companies are another important source of cross-border portfolio investment in India. On an average basis, ADR/GDR accounted for over one-third of the total cross-border portfolio investment to India (Table 6.10).
6.62 Studies show that volatility of cross-border portfolio investment flows into India has been less than what has been experienced by other EMEs (Table 6.11). The stability in portfolio flows to India has been attributed to factors such as robust economic performance since early 1990s and relatively low level of co-movements between Indian and global stock prices (Gordon and Gupta, 2003).
| Table 6.11: Average Portfolio Flows and their | ||
| Volatility (1995-2002) | ||
| Country | Mean | Coefficient of |
| (US $ million) | Variation (CV) | |
| (Per cent) | ||
| 1 | 2 | 3 |
| India | 1,950.3 | 69.4 |
| Malaysia | -651.0 | 109.4 |
| Philippines | 2,556.3 | 103.2 |
| Korea | 10,998.6 | 57.9 |
| Mexico | 1,705.6 | 371.3 |
| Indonesia | 234.1 | 1,253.5 |
| Source : International Financial Statistics, IMF. | ||
6.63 FII inflows to India display seasonality, with inflows being significantly higher in the first four months of each calendar year (Gordon and Gupta, 2003). The average of FII investments in equities for the first four months from January to April constituted, on an average, almost 70 per cent of the annual flows. This could be due to global factors such as money flowing into the market at the start of the year from tax saving investments and from year-end bonuses. The pattern might also reflect improved domestic sentiment, since reforms are typically announced in the run-up to the end-February Union Budget. A seasonality test using dummy variable approach, however, confirms seasonality only for the month of February.5
Policies Relating to Portfolio Flows in India
6.64 Prior to 1992, only non-resident Indians (NRIs) and overseas corporate bodies (OCBs) were allowed to undertake portfolio investment in India. In line with the recommendations of the High Level Committee on Balance of Payments (Chairman: C. Rangarajan), FIIs were allowed to invest in the Indian debt and equity market. Ceilings on FII investments have been progressively relaxed and at present, aggregate investment by FIIs in a company is allowed within the sectoral cap prescribed for FDI. Apart from equity, FIIs registered under the 100 per cent debt route can invest in debt instruments – both Government as well as corporate, the current aggregate ceiling being US
| 5 | Introducing monthly dummies, the FII equation is: | ||||||||
| FII = | 339.50 + | 401.77 M1+ | 647.59 M2 | + | 353.50 M3 + | 426.13 M4 + | 233.23 M5 + | 165.95 M6 + | |
| (1.3) | (1.1) | (1.7)* | (0.9) | (1.1) | (0.6) | (0.4) | |||
| 262.32 M7 + | 174.77 M8 +115.41 M9 – | 237.70 M10 + | 89.60 M11 | ||||||
| (0.7) | (0.5) | (0.3) | (-0.6) | (0.2) | |||||
| R2 | = 0.1 DW = 1.1 | ||||||||
| Figures in brackets are t-values. | |||||||||
| * denotes the 10 per cent level of significance. | |||||||||
| The significantly positive coefficient of M2 points towards the presence of seasonality in the month of February. | |||||||||
REPORT ON CURRENCY AND FINANCE
$ 1 billion. Indian corporates are also allowed to access equity capital from foreign sources in the form of ADR/GDR and Euro issues. At present, policies on international offerings on ADRs/GDRs have been liberalised substantially and corporates are allowed to raise funds by way of ADRs/GDRs under an automatic route, subject to specified guidelines.
6.65 Two-way fungibility in ADR/GDR issues of Indian companies has been introduced under which investors in India can purchase shares and deposit them with an Indian custodian for issue of ADRs/ GDRs by the overseas depository to the extent of the ADRs/GDRs converted into underlying shares (Box VI.5).
Determinants of Portfolio Flows to India
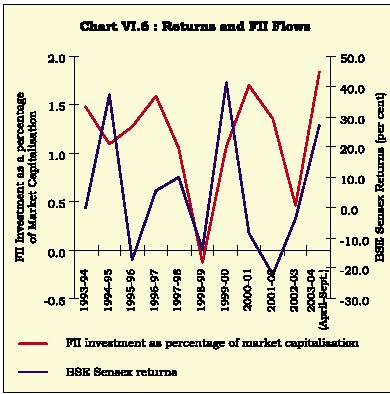
6.66 Studies on the determinants of portfolio flows to India find the co-movement between FII flows and the BSE Sensex to be fairly high (Chart VI.6). Contemporaneous domestic stock market return was found to be an important determinant for FII flows (Chakrabarti, 2002). A combination of domestic, regional and global variables has been important in determining equity flows to India (Gordon and Gupta, 2003).
6.67 With a view to evaluating the factors influencing II inflows to India, an empirical exercise was under taken in a r isk-retur n framework using monthly data. The hypothesis tested was that FIIs compare the return on Indian markets with that on international equity markets. FII investments in domestic markets are expected to be positively related to risk in international markets. Furthermore, opportunity costs measured by the one-month LIBOR rate were taken into cognisance. The results of the first order autocorrelated error regression model suggest that FII flows were positively related to returns on BSE
Box VI.5
ADRs/GDRs: Fungibility and Alignment of Share Prices
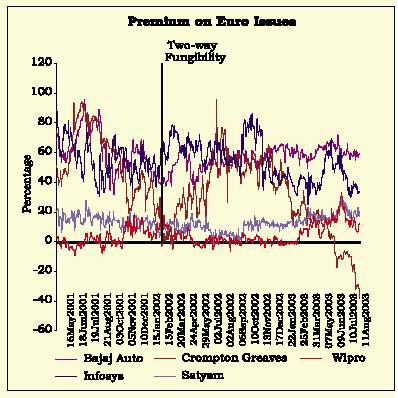
The process of convergence of domestic and international share prices becomes more efficient if there is flexibility in conversion of ADRs/GDRs into domestic shares and their re-conversion back, i.e., if two-way fungibility is permitted. Empirical findings indicate that spreads between domestic and international equity prices tend to narrow as a result of dual listing although there are periods of divergence. The evidence not only suggests strong inter-linkages across global stock markets but also a stronger relation especially for the technology stocks in the domestic and international stock exchanges.
Except for a brief interlude of 1994-95 and 1998-99, the prices of Indian GDRs/ADRs generally traded at a premium to the domestic share prices, even though many of these instruments were issued at a discount. The premium could be explained in terms of brokerage commission, tax and risk premium on account of exchange rate fluctuations. Also, the cost and time involved in conversion of GDRs into domestic shares discouraged market players from effectively using the facility of conversion. The prevalent one-way fungibility also suffered from price volatility and liquidity problems as conversion meant lower float until a fresh issuance. For facilitating conversion/ re-conversion of shares between ADRs/GDRs and domestic shares and alignment of prices, the two way ADR/GDR fungibility was announced in Union Budget, 2001-02.
The Markov-switching model (Goldfeld and Quandt, 1973) is used to evaluate impact of two-way fungibility on select scrips in aligning share prices across markets. The results suggested that industry and country specific factors primarily continue to dominate movements in share prices (Chart). Two-way fungibility, however, helped in making the share prices across
countries more aligned though perfect alignment has not been achieved yet. More significantly, the effect of two-way fungibility was evident on share prices after nearly a quarter. Partial convertibility, limited number of participants, illiquid stocks, differential demand-supply conditions, asymmetry of information, varying disclosure norms across exchanges, non-overlapping trading hours, tax and transactional costs may have led to this fragmentation of markets and a complete alignment of prices may not happen on a real time basis.
MANAGEMENT OF CAPITAL FLOWS
Sensex.6 FII investments in equities in India were also positively related to risk on Nasdaq as expected. The opportunity cost variable was significant with expected sign.
6.68 Another exercise was undertaken based on annual data for the period 1970-71 to 2002-03 to model inflows and outflows on account of portfolio investment in India. The inflows and outflows up to 1992-93 were mainly on account of non-resident Indians. It was only after 1992-93 that portfolio investment by FIIs was permitted in Indian stock exchanges. Consequently, even though the variability in the BSE Sensitive Index over the variability of the Dow Jones Index was included in the equation, it was not expected to play an important role in explaining portfolio investments during most of the period in the sample. A one-period lagged exchange rate was included to reflect the impact of an expected depreciation of the Indian rupee on the level of investments. World GDP was included as a proxy for 'push' factors. The equation was estimated in a partial adjustment framework.7 Foreign portfolio investment was found to be very strongly related to world GDP implying that 'push' factors were important in attracting foreign portfolio investment, particularly in the 1990s.
6.69 The outflows on account of por tfolio investments are explained in terms of differential in returns in India and abroad, captured by difference between rate of interest on Government securities and rate of interest on medium term US Government bonds. The ratio of gross fiscal deficit to GDP was also included to reflect the macro economic conditions in the economy. A dummy variable was included to highlight the liberalisation period. The results indicated that even though the interest rate differential had the expected negative sign, it was not significant, possibly because FIIs were not allowed to invest in Indian stock markets during major part of the sample period.
6.70 In sum, policies relating to portfolio investment in India have been substantially liberalised in the 1990s.
| 6 | FII | = | 172.52 + 584.12 DIFFRET + | 1.69 SPNASDAQ – 113.52 LIBOR1 + 1816.35 DUMMY + 0.44 AR(1) | ||||||
| (0.42) (2.03)** | (3.37)*** | (-1.94)* | (7.71)*** | (5.25)*** | ||||||
| – | ||||||||||
| R2 | = | 0.49 DW= 2.07 | ||||||||
| Sample period January 1993 to September 2003. | ||||||||||
| DIFFRET | = | Difference between returns on BSE Sensex and that on Nasdaq. | ||||||||
| SPNASDAQ | = | Proxy for risk on Nasdaq measured by the high low spread. | ||||||||
| LIBOR1 | = | One-month Libor rate. DUMMY was included to capture very large errors. | ||||||||
| 7 | Ln PIIN | = | -26.96 + 0.55 Ln PIIN{-1} | + | 7.67 Ln WGDP - | 4.38 Ln EXCHRATE{-1} | + | 0.01 VBSESEN | + 5.32 DUMPIIN | |
| (-3.14)*** (4.85)*** | (3.34)*** | (-2.81)*** | (1.68)* | (4.89)*** | ||||||
| – | ||||||||||
| R2 | = | 0.95 h = 0.51 | SEE = 0.82 | |||||||
| Ln PIOUT | = | -1.74 + 0.36 Ln PIOUT{-1} | - | 0.02 INTDIFF | + 1.45 Ln GFDRATIO + 5.15 DUMPIOUT | |||||
| (-1.21) (2.59)** | (-0.46) | (1.64)* | (4.85)*** | |||||||
| – | ||||||||||
| R2 | = | 0.89 h = 0.63 | SEE = 1.18 | |||||||
| PIIN | = | Inflows of portfolio investment. | ||||||||
| WGDP | = | World GDP. | ||||||||
| EXCHRATE | = | Exchange rate of the Rupee (Rs per US dollar). | ||||||||
| VBSESEN | = | Variability of the BSE Sensitive Index over variability of the Dow Jones Index. | ||||||||
| DUMPIIN | = | Dummy variable to highlight the policy changes with respect to portfolio investment since 1992. | ||||||||
| PIOUT | = | Portfolio investment outflows. | ||||||||
| INTDIFF | = | Interest rate differential between rate on Government securities in India and rate on medium term US Government bonds. | ||||||||
| GFDRATIO | = | Ratio of GFD to GDP. | ||||||||
| DUMPIOUT | = | Dummy variable with value one from 1993-94 to 2002-03 and zero for previous period. | ||||||||
| Figures in brackets are t-values; ***, ** and * denote the 1, 5 and 10 per cent level of significance, respectively. | ||||||||||
REPORT ON CURRENCY AND FINANCE
India received cross-border portfolio investment to the tune of US $ 2.2 billion per year, on an average, between 1992-93 and 2002-03. The volatility of cross-border portfolio investment flows into India has been less than that in respect of other emerging market economies. Empirical estimates indicate that FII flows are positively related to returns on BSE Sensex. FII inflows to India display seasonality, with inflows being significantly higher in the first few months of the calendar year, particularly the month of February.
V. EXTERNAL COMMERCIAL BORROWINGS
6.71 External Commercial Borrowings (ECBs) provide an additional source of funds for corporates to finance the expansion of existing capacity as well as new investment, taking cognisance of interest rate differentials between domestic and international markets and the associated market risks. ECBs include commercial bank loans, buyers’ credit, suppliers’ credit, securitised instruments such as Floating Rate Notes and Fixed Rate Bonds and, commercial borrowings from the private sector window of multilateral financial institutions such as International Financial Corporation (IFC) and
Asian Development Bank (ADB). An important objective of ECB policy in India has been to provide flexibility in borrowings by Indian corporates, while maintaining prudent limits for total external borrowings.
6.72 The policy on ECBs has been made transparent in the 1990s. Procedures have also been streamlined to enable borrowers to improve access to international financial markets. The ECB policy favours long-term borrowings and maintains a strict control on short-term borrowings.
6.73 One of the guiding principles for ECB policy has been to encourage infrastructure financing since such facilities are crucial for the overall growth of the economy. A revised external commercial borrowings policy was announced in January 2004. A key feature of the revised policy is substantial increase in eligibility limits for automatic route (Box VI.6). As against the automatic route that was available for borrowings up to US $ 50 million, the new policy permits borrowings up to US $ 500 million under the automatic route, subject to specified maturity prescriptions. Prior approval of the Reserve Bank for short term credit i.e., Suppliers’ and Buyers’ credit for a period of less
Box VI.6
External Commercial Borrowings Policy
To enhance investment activity in the real sector, particularly in infrastructure, and to enable corporates to access resources from international markets at competitive rates, the policy of external commercial borrowings (ECBs) was reviewed in January 2004. The review was undertaken in view of the need to supplant the prevailing temporary restrictions on access to ECBs with more stable, transparent and simplified procedures and policies. The review was based on the current macroeconomic situation reflecting subdued investment activity, challenges faced in external sector management, the experience gained so far in administering the ECB policy and concerns expressed by borrowers in this regard. The comfortable level of key indicators of India’s external debt provide the necessary headroom for some increase in incremental debt in the form of ECBs to finance the real investment for higher growth.
The liberalised framework is expected to introduce stability in ECB policy by simplifying and rationalising procedures, while minimising discretionary elements and promoting greater transparency. Key features of the revised guidelines are set out below:
• Removal of End-use Restrictions: ECBs would be allowed for corporate investments in industrial sector especially infrastructure sector. Money has to be parked abroad unless actually required. Usual restriction on ECB for investment in capital market or in the real estate will, however, continue.
• Eligibility: All corporates except banks, NBFCs and financial institutions shall be eligible ECB borrowers. However, banks and financial institutions that have participated in the textile or steel sector restructuring package of the Government/Reserve Bank will be permitted to the extent of their investment in the package.
• Interest Rate Spreads: ECBs with average maturity of 3-5 years shall be subject to a maximum spread of 200 basis points over six month LIBOR of the respective currency in which the loan is being raised or the applicable benchmark(s). ECBs with more than 5 years of average maturity shall be subject to a maximum spread of 350 basis points.
• Guarantee: Banks, FIs and NBFCs will not be able to provide guarantee/letter of comfort etc.
• Procedure: All ECBs satisfying the above criteria will be under the automatic route up to US $ 20 million for ECBs between 3-5 years of average maturity and up to US $ 500 million for ECBs having average maturity of more than 5 years.
• The above relaxations will also be applicable to Foreign Currency Convertible Bonds (FCCBs).
All cases which fall outside the purview of the automatic route in the new liberalised ECB policy will be decided by an Empowered Committee of the Reserve Bank.
MANAGEMENT OF CAPITAL FLOWS
| Table 6.12: Gross International Bank Lending to Developing-Country Borrowers | ||||||||
| (US $ billion) | ||||||||
| Country | 1995 | 1996 | 1997 | 1998 | 1999 | 2000 | 2001 | 2002 |
| 1 | 2 | 3 | 4 | 5 | 6 | 7 | 8 | 9 |
| All developing countries | 105.4 | 115.4 | 166.6 | 105.2 | 85.7 | 113.2 | 85.7 | 82.8 |
| Argentina | 3.8 | 10.0 | 11.5 | 11.8 | 7.2 | 6.7 | 5.0 | 2.1 |
| Brazil | 2.2 | 3.2 | 14.9 | 11.4 | 6.9 | 13.7 | 10.6 | 6.4 |
| Chile | 1.8 | 4.3 | 7.2 | 4.3 | 7.6 | 6.5 | 5.6 | 2.1 |
| China | 12.7 | 9.8 | 11.1 | 7.0 | 3.4 | 5.8 | 1.2 | 9.6 |
| India | 4.1 | 5.0 | 7.5 | 3.9 | 2.8 | 3.5 | 2.0 | 1.8 |
| Indonesia | 13.6 | 17.3 | 14.7 | 0.7 | 1.6 | 1.0 | 0.5 | 0.3 |
| Malaysia | 7.0 | 7.8 | 8.3 | 3.2 | 4.6 | 5.5 | 3.2 | 5.6 |
| Mexico | 8.2 | 10.6 | 14.7 | 11.5 | 8.7 | 10.9 | 11.7 | 7.4 |
| Philippines | 1.8 | 1.2 | 4.4 | 3.4 | 2.6 | 4.7 | 3.1 | 1.5 |
| Russian Federation | 3.6 | 3.8 | 12.9 | 2.8 | 0.7 | 4.7 | 3.1 | 5.9 |
| Thailand | 9.8 | 8.8 | 6.5 | 4.3 | 1.2 | 4.3 | 2.0 | 3.6 |
| Turkey | 4.6 | 5.7 | 5.7 | 5.7 | 7.1 | 11.2 | 4.7 | 3.7 |
| Source: Global Development Finance, World Bank, 2003. | ||||||||
than three years and up to US $ 20 million per import transaction has been dispensed with, effective September 2002. Proposals for short-term credit above US $ 20 million are considered by the Reserve Bank. Over a period of time, the ECB policy has witnessed many changes:
The ECB proceeds can be utilised for any general corporate purposes except investment in stock market and real estate due to risk of speculative bubbles associated in these sectors. In the real estate sector, the ECB proceeds can be used for the purpose of development of integrated townships. Similarly, ECBs are permitted for the purpose of first stage acquisition of shares in PSU dis-investments and in mandatory second stage offer to the public;
Refinancing of ECBs, without any limit, has been placed under automatic route; and
In recent years, the Reserve Bank has simplified the norms for prepayments of ECB by the corporates by allowing prepayment without any limit out of the balances held in Exchange Earner’s Foreign Currency (EEFC) account as well as out of local resources/market purchases.
Trends in ECB Flows
6.74 After the recent financial crises, the access of the developing countries to commercial borrowings from international banks declined substantially, before rising again in 2000. In the following two years the lending of the international banks remained subdued (Table 6.12). Several factors could be ascribed to the decline in banks’ lending in the last two years, viz., continuing global slowdown, impact of Argentina’s default on its international bond obligations, generalised retrenchment of international banks from cross-border exposure to developing countries, Iraq conflict, sharp deterioration in corporate credit in major developed countries, emergence of a string of corporate accounting scandals in the US that undermined investor confidence and induced high volatility in credit markets and intense risk aversion (Global Development Finance, 2003).
6.75 In India, the total stock of securitised borrowings, increased during the period 1998-2003 mainly due to Resurgent India Bonds (RIBs) and India Millennium Deposits (IMDs) (Table 6.13). Total ECB outstanding has, however, declined since 2001, on account of weak demand for ECBs reflecting weakness in domestic investment demand and prepayments (Table 6.14).
6.76 An exercise was undertaken to model ECBs during the period 1970-71 to 2002-03. ECBs are hypothesised to depend upon rate of interest in India, debt service ratio and imports.8 As expected, imports were found to have a very significant and strong impact on inflows of ECBs with elasticity of ECBs with respect to imports at around 1.0. Debt service requirements have not played a major role in attracting ECBs, as indicated by significant but low elasticity, but the impact of the domestic rate of interest was found to be significant. ECB outflows were hypothesised as a function of imports which proxy for an activity variable and a one-period lagged exchange rate to capture the impact of expected movements in the exchange rate.9
| 8 | Ln ECBR | = | -5.46 + 0.04 DSR{-1} | + 1.05 Ln IMP + | 0.15 GSROI | - 1.15 DUMECBR | |
| (-8.79)*** (2.22)** | (12.34)*** | (2.44)** | (-2.78)*** | ||||
| – | |||||||
| R2 | = | 0.96 DW = 1.98 | SEE = 0.39 | ||||
| Where ECBR | = | External commercial borrowings inflows | |||||
| DSR | = | Debt service ratio | |||||
| GSROI | = | Domestic rate of interest on Government securities | |||||
| DUMECBR | = | Dummy variable for ECB inflows to account for sudden decline in ECB during 1993-94 | |||||
| Figures in brackets are t-values; ***, ** and * denote the 1, 5 and 10 per cent level of significance, respectively. | |||||||
REPORT ON CURRENCY AND FINANCE
| Table 6.13: India’s External Commercial Borrowings - Outstanding Stocks | |||||||
| (US $ million) | |||||||
| 1998 | 1999 | 2000 | 2001 | 2002 | 2003 | ||
| 1 | 2 | 3 | 4 | 5 | 6 | 7 | |
| External Commercial Borrowing | 16,986 | 20,978 | 19,943 | 24,215 | 23,248 | 22,371 | |
| a) | Commercial bank loans | 9,981 | 10,343 | 10,094 | 9899 | 9,976 | 9,899 |
| b) | Securitised borrowings (includes | ||||||
| IDBs, RIBs, IMDs and FCCBs) | 6,022 | 9,772 | 9,073 | 13694 | 12,758 | 11,966 | |
| c) | Loans/securitised borrowings, etc. | ||||||
| with multilateral/ bilateral guarantee | |||||||
| and IFC (W) | 874 | 808 | 750 | 622 | 514 | 506 | |
| d) | Self Liquidating Loans | 109 | 55 | 26 | 0 | 0 | 0 |
| Total External Debt | 93,531 | 96,886 | 98,263 | 1,01,132 | 98,761 | 1,04,699 | |
| ECB to total debt (%) | 18.2 | 21.7 | 20.3 | 23.9 | 23.5 | 21.4 | |
| Source : Reserve Bank of India and Government of India. | |||||||
| Table 6.14: Trends in External Commercial | |||||
| Borrowings in India | |||||
| (US $ million) | |||||
| Year Disburse- | Amorti- | Interest | Debt | Net Inflow | |
| ment | sation | Payment | Service | ||
| Payments | |||||
| 1 | 2 | 3 | 4 | 5 | 6 |
| 1990-91 | 1,700 | 1,191 | 1,042 | 2,233 | -533 |
| 1991-92 | 2,798 | 1,146 | 994 | 2,140 | 658 |
| 1992-93 | 1,001 | 1,357 | 917 | 2,274 | -1,273 |
| 1993-94 | 1,859 | 1,703 | 896 | 2,599 | -740 |
| 1994-95 | 2,670 | 2,513 | 1,091 | 3,604 | -934 |
| 1995-96 | 4,538 | 3,311 | 1,162 | 4,473 | 65 |
| 1996-97 | 7,018 | 4,032 | 1,177 | 5,209 | 1,809 |
| 1997-98 | 7,400 | 3,411 | 1,406 | 4,817 | 2,583 |
| 1998-99 | 6,927 | 3,153 | 1,575 | 4,728 | 2,199 |
| 1999-2000 | 2,289 | 3,460 | 1,635 | 5,095 | -2,806 |
| 2000-01 | 9,295 | 5,043 | 1,683 | 6,726 | 2,569 |
| 2001-02 | 2,909 | 4,012 | 1,444 | 5,456 | -2,547 |
| 2002-03 | 1,904 | 3,679 | 923 | 4,602 | -2,698 |
| Source: India’s External Debt : A Status Report, Government of India, 2003. | |||||
Relevance of Sovereign Credit Ratings
6.77 Credit ratings by major agencies play an important role in accessing commercial borrowings abroad. Sovereign credit ratings have been found to be significantly linked to economic fundamentals such as per capita GDP, inflation, external debt and indicators of default history and development (Cantor and Packer, 1996).
6.78 It is, however, argued that the fundamentals, which are taken into consideration by credit rating agencies need not necessarily be good indicators of financial crisis and default by the sovereign or entities from that economy. Studies indicate that rating agencies have attached little importance to indicators of liquidity, currency misalignment and assets price behaviour, all of which have close links with financial crisis and default (Reinhart, 2002). Studies on ex post performance of sovereign credit rating in terms of their ability to anticipate financial crisis are inconclusive. There is evidence that such ratings generally fail to anticipate banking crisis and even their predictive power regarding currency crisis is very limited (Goldstein, Kaminsky and Reinhart, 2000). Sovereign ratings, especially for EMEs, are reactive rather than anticipative of economic events. In fact, while the occurrence of currency crisis helps predicting sovereign rating downgrade for EMEs, there is no conclusive evidence that currency crisis affects sovereign ratings of industrialised countries in a systemic and significant way (Reinhart, 2002).
| 9 | Ln ECBP | = | - 2.46 + | 0.71 Ln ECBP{-1} + | 0.30 Ln IMP + | 0.64 Ln EXCHRATE{-1} | - | 0.53 DUMECBP | |
| (-1.68)* | (5.07)*** | (1.63)* | (1.25) | (-1.10) | |||||
| R2 | = | 0.98 | h = 0.53 | SEE = 0.30 | |||||
| ECBP | = | External Commercial Borrowings Outflows; IMP = Imports; | |||||||
| EXCHRATE | = | Exchange rate (rupees per US dollar); DUMECB = Dummy variable reflecting changes in the policy regime relating to | |||||||
| ECBs since 1992-93. | |||||||||
| Figures in brackets are t-values; ***, ** and * denote the 1, 5 and 10 per cent level of significance, respectively. | |||||||||
MANAGEMENT OF CAPITAL FLOWS
| Table 6.15: Long-Term Sovereign Ratings by Select Rating Agencies | |||||
| Year | Standard & Poor’s | Moody’s | Duff & Phelps | Japan Bond | |
| Research Institute | |||||
| 1 | 2 | 3 | 4 | 5 | |
| 1988 | Satisfactory | ||||
| (no formal rating) | A2 | – | – | ||
| 1989 | Satisfactory | ||||
| (no formal rating) | A2 | – | – | ||
| 1990 | BBB | Watch list | (August 1) | ||
| Baa1 | (October 4) | – | – | ||
| 1991 | BBB (March 7) | Baa3 | (March 26) | – | – |
| (Credit Watch) | Ba2 | (June 24) | |||
| BBB (September 25) | |||||
| (No credit Watch ) | |||||
| 1992 | BB+ (June 22) | Ba2 | (No Change) | – | – |
| 1993 | BB+ (No Change) | Ba2 | (No Change) | – | |
| 1994 | BB+ (No Change) | Baa3 | (December 2) | – | BBB+ (March 24) |
| 1995 | BB+ (Stable) | Baa3 | (October 2) | – | BBB+ |
| 1996 | BB+ (Positive, October 1) | Baa3 | (No Change) | – | BBB+ |
| 1997 | BB+ (Stable, October 6) | Baa3 | (Negative,February) | BBB- (Stable, August 18) | BBB+ |
| 1998 | BB+ (Negative, May) | ||||
| BB (Stable, October 22) | Ba2 | (Stable, June 19) | BBB- | (Negative, June 6) | |
| BB+ (Stable, August 10) | BBB | ||||
| 1999 | BB (Stable) | Ba2 | BB+ | BBB | |
| 2000 | BB (Positive, March 20) | ||||
| BB+ (Stable, October 11) | Ba2 | BBB | |||
| 2001 | BB (Negative, August 7) | Ba2 | (Negative) | BB (November 21) | BBB |
| 2002 | BB (Negative ) | Ba2 | (Negative) | BB | BBB |
| 2003 | BB (Stable, December 5) | Ba2 | (Negative) | BB | BBB (As on September) |
| Note | : Positive: Rating may be raised; Negative : Rating may be lowered; | Stable : Rating is not likely to change. | |||
| Rating Grades: Standard and Poor’s | Rating Grades: Duff and Phelps | ||||
| Investment Grade : AAA, AA+, AA, A+, A, BBB+, BBB, BBB- | Investment Grade : AAA, AA+, AA, AA-, | ||||
| Non-Investment Grade: BB+, BB, BB-, B+, B, B- | Non-Investment Grade: BB+, BB, BB-, CCC | ||||
| Default Grade : CCC+, CCC, CCC-, CC, C | Default Grade : DD, DP | ||||
| Rating Grades: Moody’s | Rating Grades: Japan Bond Research Institute (JBRI) | ||||
| Investment Grade : Aaa, Aa1,Aa2, Aa3,A1, A2, A3, Baa1, Baa2, Baa3 | Investment Grade : AAA, AA+, AA, AA-, | ||||
| Non-Investment Grade: Ba1, Ba2, Ba3, B1, B2, B3 | Non-Investment Grade: BB+, BB, BB-, B+, B, B- | ||||
| Default Grade : Caa, Ca, C | Default Grade : CCC, CC, C | ||||
6.79 India has so far not issued any sovereign bond. Over time, India’s sovereign credit rating has ranged between low investment grade and high non-investment grade (Table 6.15).
6.80 Notwithstanding the generally subdued perception of international credit rating agencies regarding the Indian economy, Indian corporates have been able to mobilise funds in the international capital market at rates which are generally more favourable than those accessed by corporates from many other developing countries with similar credit ratings. This may have been due to the more favourable perception of investors about the Indian economy as compared to that of the credit rating agencies, as well as India’s unblemished record in honouring external obligations (Reddy, 1997). Even on the basis of factors and weights used by credit rating agencies, there are
indications that India should have been assigned credit rating one or two notches above what has been actually assigned in recent years (Afonso, 2003).
Role of Special Purpose Commercial Borrowing by India
6.81 Since 1991, India has resorted, on three occasions, to special types of ECBs through banking channels with exchange rate guarantees. These borrowings provide interesting examples of management of capital account in adverse situations. Instruments which were used for such purposes were India Development Bonds (IDBs), 1991; Resurgent India Bonds (RIBs), 1998; and, India Millennium Deposits (IMDs), 2000. In each of these three cases, India had to resort to external borrowing in response to certain unfavourable external developments. The possibility of
REPORT ON CURRENCY AND FINANCE
direct sovereign borrowing to meet the actual or potential funding needs was also explored. It was, however, felt that raising resources through such route might be time consuming. Moreover, given the lack of any precedence of direct sovereign borrowing in post-Independence India, it was felt that such an approach under adverse conditions might not be appropriate (Reddy, 1998).
6.82 In the aftermath of the balance of payments crisis, the State Bank of India floated IDBs in October 1991 of 5-years maturity. An aggregate amount of US $ 1.6 billion was mobilised through these bonds. The IDBs were redeemed in foreign currency to the nonresidents and in rupees to the resident holders of the bonds. The issue of RIBs was contemplated in view of extraordinary developments in 1998-99, when a shortfall in capital flows consequent upon imposition of sanctions, especially debt flows, in relation to current account deficit was anticipated. Instead of drawing down foreign exchange reserves which could have adversely affected market sentiments, or reducing the current account deficit through drastic import cuts which would have affected real economic activity, it was felt that RIBs would enhance the debt flows at the least possible cost. It was envisaged that such borrowings could offset the adverse market sentiment created in international capital markets in the light of the downgrading of India’s sovereign rating to non-investment grade. This could have been done by demonstrably raising debt resources at a cost lower than that any organised financial intermediary was prepared to provide in the context of the rating downgrade (Reddy, 1998). At the same time, it was necessary to ensure that amounts so obtained were restricted quantitatively to meet essential needs as a replacement for normal debt flows, by keeping an option for premature closure. Furthermore, by keeping the maturity of RIBs to five years, it was ensured that the borrowing had an appropriate medium-term maturity. The success of RIBs could be gauged from the substantial amount of funds mobilised (US $ 4.2 billion) in the international market at a competitive rate. The RIBs were redeemed on October 1, 2003 without any pressure on the exchange rate and liquidity conditions. External financing through IMDs (US $ 5.5 billion) was again resorted in 2000 as a pre-emptive step in the face of hardening of world petroleum prices and the possible consequent depletion of India’s foreign exchange reserves.
6.83 Unlike most bonds, these bonds/deposits could not be traded in the secondary market, nor could be encashed prematurely in foreign exchange. Therefore, IDBs, RIBs and IMDs provided assured access to long-term foreign currency funds unlike foreign currency NRI deposits, most of which have much shorter minimum maturity periods and premature withdrawal options. The extent of substitution between these funds and foreign currency deposit schemes for NRIs was found to be limited. Moreover, these instruments resulted in elongation of India’s external debt profile. The interest spread offered on such instruments was generally favourable compared to spreads offered by other developing countries on similar instruments issued during those specific periods. In fact, there are indications that spreads offered on these instruments were much lower than what countries with much higher international credit ratings could offer (Reddy, 1998 and GoI, 2001) (Table 6.16).
| Table 6.16: Special Borrowings by India since 1991 | ||||
| Currency Denomination | Amount Collected | Interest Rate* | 5-year | Spread |
| (US $ million) | (per cent per annum) | Government Bond Yield # | (Col 3-4) | |
| 1 | 2 | 3 | 4 | 5 |
| India Millennium Deposits, 2000 | 5,520 | |||
| Mobilisation in US Dollar | 5,182 | 8.50 | 5.57 | 2.93 |
| Mobilisation in Pound Sterling | 258 | 7.85 | 4.63 | 3.22 |
| Mobilisation in Euro | 80 | 6.85 | ||
| Resurgent India Bonds, 1998 | 4,230 | |||
| Mobilisation in US Dollar | 3,987 | 7.75 | 5.26 | 2.49 |
| Mobilisation in Pound Sterling | 180 | 8.00 | 5.45 | 2.55 |
| Mobilisation in Euro | 63 | 6.25 | ||
| India Development Bonds, 1991 | 1,627 | |||
| Mobilisation in US Dollar | 1,307 | 9.50 | 7.86 | 1.64 |
| Mobilisation in Pound Sterling | 320 | 13.25 | 9.92 | 3.33 |
| * Interest payments are half-yearly and carried both cumulative and non-cumulative options. | ||||
| # Average yields to maturity in per cent per annum. | ||||
| Source: India’s External Debt: A Status Report, Government of India, October 2001. | ||||
MANAGEMENT OF CAPITAL FLOWS
6.84 Thus, the policy on ECBs has been made transparent with gradual phasing out of end-use restrictions, except in respect of investments in real estate and stock market. A new, more liberal policy for ECBs has been announced with a view to promote investment activity in industry. As expected, imports were found to have a significant and strong impact on inflows of ECBs, although debt service requirements have not been that important in this regard.
VI. NON-RESIDENT DEPOSITS
6.85 A number of developing economies mobilise a part of their external capital requirements through special deposit schemes designed for non-residents. These schemes have been especially popular and successful in countries with large expatriate population such as Turkey, Israel, Egypt, Lebanon, Greece, Spain, Pakistan, Sri Lanka, Thailand and some East European countries e.g., Czech Republic. Most of these countries have instituted deposit schemes denominated in both foreign currency as well as their local currency. In most cases, the principal of the deposit along with the accrued interest are freely repatriable without an exchange rate guarantee provided by the central bank.
6.86 In the 1970s, the two oil shocks shifted substantial resources towards oil exporting countries which provided investment and employment opportunities in the oil-rich countries. The Reserve Bank devised specific deposit schemes to tap the savings of non-resident Indians employed in these countries. Non-Resident Indians/Overseas Corporate Bodies were allowed to open and maintain bank accounts in India under special deposit schemes –both rupee and foreign currency denominated. Special schemes for Non-Resident Indians were initiated in February 1970 with the introduction of the NonResident External Rupee Account [NR(E)RA]. This was followed by the Foreign Currency Non-Resident (Account) [FCNR(A)] scheme in November 1975. In the 1980s, investor preferences clearly shifted in favour of foreign currency denominated deposits, partly due to interest rate differential over the prevailing international interest rates as also the foreign exchange guarantee provided by the Reserve Bank. Accordingly, at end-March 1991, foreign currency deposits formed 72 per cent of total NRI deposits. Such a high propor tion with easier repatriability provided an in-built incentive to the holders to liquidate their deposits in the event of a crisis. The external payments difficulties of 1990-91 demonstrated the vulnerability associated with these deposits.
6.87 The provision of exchange guarantee in respect of the FCNR(A) was a major policy concern in the early 1990s. Under FCNR(A) scheme, scheduled commercial banks in India were permitted to accept freely repatriable term deposits in varying maturities ranging from 6 months to 3 years from NRIs in four designated currencies, viz., US Dollar, Pound Sterling, Deutsche Mark and Japanese Yen. The Reserve Bank prescribed interest rates that the banks could offer to depositors corresponding to varying maturities. The exchange risk in this scheme was borne by the Reserve Bank although the liabilities incumbent in the acceptance of deposits under the scheme rested with the banks themselves. The exchange guarantee had quasi-fiscal costs and implications for the central bank’s balance sheet. Given the increasing size of these losses in a market determined exchange rate system, the Government of India agreed to take over the liabilities relating to exchange loss on FCNR(A) deposits with effect from July 1, 1993. Nonetheless, the Reserve Bank transferred additional profits to the Government to meet these liabilities to the extent the Reserve Bank earned adequate profits, which were, in fact, more or less sufficient to meet the losses without impacting the Union Budget. Thus, notwithstanding the closure of the scheme in August 1994, the maturing deposits continued to be a burden on the Reserve Bank’s balance sheet till August 1997.
6.88 Since the 1990s, the policy with respect to the non-resident deposit schemes has been to retain the attractiveness of these schemes to maintain capital flows from abroad, while at the same time, reducing the effective cost of borrowing in terms of interest outgo and the cost to macroeconomic management. In line with these objectives, while the interest rates on these deposits have been gradually deregulated, the reserve requirements and, in recent period, interest rate ceilings have been fine-tuned in relation to capital flow cycles in order to modulate these flows consistent with the overall macroeconomic management. The exchange guarantee was withdrawn by phasing out the FCNR(A) scheme. In order to provide depositors with an alternative to FCNR(A), a new scheme, i.e., Foreign Currency Nonresident (Banks) (FCNR(B)) was introduced under which the foreign exchange risk was borne by banks on the basis of their risk perception. The interest rate differential between FCNR(B) and international rates was kept very low to discourage arbitrage. A new rupee denominated scheme, Non-resident Non-repatriable Rupee Deposit (NR(NR)RD), was devised, which was initially non-repatriable but later provided
REPORT ON CURRENCY AND FINANCE
| Table 6.17: Outstanding Balances Under Various NRI Deposit Schemes | ||||||
| (US $ million) | ||||||
| End-March | NR(E)RA | FCNR(A)* | FCNR(B) | NR(NR)RD** | FC(O)N | Total |
| 1 | 2 | 3 | 4 | 5 | 6 | 7 |
| 1975 | 40 | – | – | – | – | 40 |
| 1980 | 856 | 188 | – | – | – | 1,044 |
| 1985 | 2,304 | 770 | – | – | – | 3,074 |
| 1990 | 3,777 | 8,638 | – | – | – | 12,415 |
| 1995 | 4,556 | 7,051 | 3,063 | 2,486 | 10 | 17,166 |
| 1996 | 3,916 | 4,255 | 5,720 | 3,542 | 13 | 17,446 |
| 1997 | 4,983 | 2,306 | 7,496 | 5,604 | 4 | 20,393 |
| 1998 | 5,637 | 1 | 8,467 | 6,262 | 2 | 20,369 |
| 1999 | 6,045 | – | 7,835 | 6,618 | – | 20,498 |
| 2000 | 6,758 | – | 8,172 | 6,754 | – | 21,684 |
| 2001 | 7,147 | – | 9,076 | 6,849 | – | 23,072 |
| 2002 | 8,449 | – | 9,673 | 7,052 | – | 25,174 |
| 2003 | 14,923 | – | 10,199 | 3,407 | – | 28,529 |
| * | Withdrawn effective August 1994. | – : Nil | ||||
| ** | Withdrawn effective April 2002. | |||||
| Note | : Balances are inclusive of accrued interest (in case of FCNR(A) from 1989 onwards). | |||||
| Source : Reserve Bank of India. | ||||||
for repatriation of only interest income. Deposits under this scheme, given their non-repatriability, were promoted by exempting them from SLR and CRR over most of the period. The scheme was withdrawn in April 2002.
6.89 Reflecting these policy initiatives and the overall management of the exchange rate, flows under NRI deposits have been relatively stable since 1991-92. A positive development has been the decline in the proportion of foreign currency denominated deposits from a high of 78 per cent at end-March 1992 to less than 40 per cent of total NRI deposits at end-March 2003 (Table 6.17). The composition of FCNR(B) deposits indicates that investors prefer to hold these deposits in US dollar (almost 60-70 per cent of total FCNR(B) deposits) followed by pound sterling (almost a quarter).
6.90 An empirical exercise was undertaken to assess the determinants of NRI deposits. The explanatory variables for non-resident deposits (NRIDEP) included exports of the Gulf countries (since a large proportion of these deposits are from the Gulf countries), and the interest rate differential (INTDIFF) between India and abroad. The results indicated that all the variables were significant with expected signs.10
NRI Deposits and Monetary Management
6.91 While NRI deposits have been an important source of external finance, the acceptance of these deposits form a liability of the banking system and also impact on monetary aggregates. NRI deposits were, therefore, subject to monetary regulation in the form of reserve requirements and interest rate stipulations, taking into account the trends in external financing requirements and external capital flows. While the cash reserve ratio (CRR) on NR(E)RA deposits over the 1970s and in the early 1980s was the same as on domestic deposits, the 1980s witnessed a preferential treatment to these deposits in the form of a significantly lower CRR, reflecting the need to mobilise more deposits in view of the then widening current account deficit. A similar preferential treatment to FCNR(A) was also provided. The CRR was, however, increased and brought more or less at par with domestic deposits from late 1980s onwards. While FCNR(B) and NR(NR)RD, which were introduced in early 1990s, were initially exempted from CRR, reserve requirements were imposed in late 1994 and early 1995 to make these deposits relatively unattractive so as to counter the monetary impact of
| 10 | Ln NRIDEP | = | -2.48 + | 0.67 Ln NRIDEP{-1} + | 0.12 INTDIFF + | 0.97 Ln GULFEXP | - | 2.19 DUMNRI | ||
| (-1.85)* | (7.12)*** | (2.41)** | (2.74)*** | (-2.69)*** | ||||||
| R2 | = | 0.93 | h = -0.03 SEE = 0.79 | |||||||
| Where | NRIDEP | = | Net inflows under NRI deposits; | INTDIFF | = | Interest rate Differential; | ||||
| GULFEXP | = | Exports from GULF countries; | DUMNRI | = | Dummy variable for 1995-96. | |||||
| Figures in brackets are t-values; ***, ** and * denote the 1, 5 and 10 per cent level of significance, respectively. | ||||||||||
MANAGEMENT OF CAPITAL FLOWS
higher inflows. In late 1995 and early 1996, in view of the volatility in the foreign exchange market, the CRR was reduced to make these deposits more attractive. The variability in the use of SLR on these deposits has been rather limited. A survey of 17 EMEs by the Bank for International Settlements (BIS, 1999) on monetary policy operating procedures found that the authorities usually apply such reserve requirements uniformly to all types of deposits. Nonetheless, differential ratios are applied at times to serve specific objectives. For instance, higher reserve requirements were sometimes imposed on foreign currency deposits compared with domestic currency deposits in Peru and Thailand on prudential and liquidity grounds; in Poland, on the other hand, the statutory ratio for foreign currency deposits was lower than that for domestic currency denominated deposits, although the intention was to have a uniform rate for all type of deposits.
6.92 In line with the regulation of deposit rates in the period prior to the 1990s, the interest rates on various NRI schemes were also regulated. While prior to August 1985, interest rate on both NR(E)RA and FCNR(A), the schemes in vogue at that time, was two percentage points higher than that prescribed for domestic term deposits, interest rates on FCNR(A) in the subsequent period were revised taking into account trends in international interest rates. The differential, however, widened in the early 1990s reflecting efforts to attract these deposits in view of the external payments crisis of 1991. As a first step towards more flexibility, the detailed maturity-wise prescriptions were rationalised in case of NR(E)RA deposits, on the lines of flexibility provided in case of domestic deposits, by allowing banks to determine their own term structure, subject to a single prescription of ‘not more than 13 per cent’ (effective October 1992) and ‘not more than 12 per cent’ (effective April 8, 1993). The banks were given full freedom for all maturities effective September 13, 1997. Similarly, in the case of FCNR(B) deposits, banks were initially permitted, effective April 16, 1997, to determine interest rates subject to ceilings prescribed by the Reserve Bank. Subsequently, effective October 21, 1997, the banks were provided more freedom, by linking these rates to LIBOR. In the case of NR(NR)RD scheme, the banks were allowed the flexibility to fix the interest rates from the inception of the scheme (June 1992), i.e., even before the freedom was granted to domestic deposits.
6.93 Some adjustments have been made in the recent past regarding policies relating to interest rates on non-resident deposits in response to changing conditions in the financial markets. A ceiling of 250
basis points above the corresponding US dollar LIBOR/ Swap rates was placed on the interest rates on fresh NR(E)RA deposits effective July 17, 2003. The ceiling was reduced to 100 basis points on September 15, 2003 and further to 25 basis points on October 18, 2003. In addition, after a review of the investment activities of Overseas Corporate Bodies (OCBs), in consultation with Government of India, they were derecognised as a distinct eligible class of investors in India with effect from September 16, 2003. They will now be treated on par with any other foreign investors.
6.94 In sum, the policy since the 1990s has focused on attracting stable non-resident deposits. Over time, the Reserve Bank has aligned the interest rates on these deposits with international rates, fine-tuned the reserve requirements, end-use specifications and other concomitant factors influencing these deposits in order to modulate these flows consistent with the overall macroeconomic management.
VII. EXTERNAL AID
6.95 A number of studies have shown that foreign aid can facilitate economic and social transformation by overcoming temporary shortages in specific human and material resources, promoting strategic activities, inducing and facilitating critical government policies and providing certain amount of working capital for carrying out programmes involving a transformation of the structure of the economy (Mikesell, 1968). A time series analysis of several countries in Asia, including India, Pakistan and China, suggests that aid contributed to growth both in poor and middle income countries (Islam, 1972 and Krueger, 1978). There is no evidence to suggest that countries that received a large amount of external aid have performed poorly (apart from countries suffering from civil or external conflicts), and the empirical evidence that high aid levels exert an independent negative impact on governance is unconvincing (World Bank, 2003). It is often argued that governments of the aid-receiving countries divert foreign aid from intended purposes to various unproductive uses and/or to support general government expenditure. Various studies have indeed found fungibility of foreign aid. In view of this, it has been argued that rather than targeting aid to specific sectors or activities, it is more efficient to link aid to overall public expenditure programme in the recipient country (Feyzioglu et al., 1998). As effectiveness of aid depends on the policy framework of the recipient economy, it is argued that such flows should be concentrated in countries with sound policy frameworks (World Bank, 1998).

Share this page:


Install the RBI mobile application and get quick access to the latest news!
Scan the QR code to install our app


Page Last Updated on:


