VI.1 Headline inflation moderated in major economies since July/August 2008 on account of the marked decline in international energy and commodity prices as well as slowdown in aggregate demand emerging from the persistence of financial market turmoil following the US sub-prime crisis. The accommodative monetary policy pursued by most central banks since September 2008 aimed at mitigating the adverse implications of the recent financial market crisis on economic growth and employment. Amongst developed countries, central banks in the US, the UK, Euro area, Canada and Australia further reduced their policy rates during the third quarter of 2008-09. Most central banks in emerging market economies, which were continuing with pre-emptive monetary tightening to contain inflation and inflationary expectations till the second quarter of 2008-09, reversed their policy stance and reduced their policy rates as the spillover of the US sub-prime crisis led to increasing downward risks to economic growth.
VI.2 In India, inflation measured as year-on-year variation in the wholesale price index (WPI), declined sharply from an intra-year peak of 12.9 per cent on August 2, 2008 to 5.6 per cent as on January 10, 2009 led by the reductions in the prices of administered prices of petroleum products as well as decline in the prices of freely priced petroleum products, oilseeds/edible oils/oil cakes, raw cotton, cotton textiles and iron & steel. The decline in prices of most of these commodities was in line with the decline in international commodity prices since July 2008. Various measures of consumer price inflation were still seen to be at elevated levels in the range of 10.4-11.1 per cent during November/December 2008 as compared with 7.3-8.8 per cent in June 2008 and 5.1-6.2 per cent in November 2007.
Global Inflation
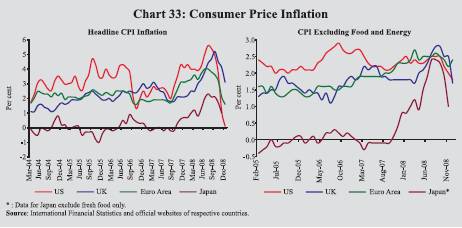
VI.3 Headline inflation in major advanced economies, which firmed up till the second quarter of 2008-09 on account of higher energy and food prices, eased subsequently. Inflation in OECD countries declined to 2.3 per cent in November 2008 from the peak of 4.9 per cent in July 2008. The recent decline in inflation in OECD countries was led by a decline in inflation of energy and food articles. Amongst major economies, headline inflation in the US declined to 0.1 per cent in December 2008 from 5.6 per cent in July 2008. In the UK, inflation declined to 3.1 per cent in December 2008 from 5.2 per cent in September 2008 while in the Euro area inflation came down to 1.6 per cent in December 2008 from 4.0 per cent in July 2008 (Chart 33). Core inflation also moderated in major economies. In OECD countries, CPI, excluding food and energy, came down to 2.2 per cent in November 2008 from 2.4 per cent in September 2008. Producer price index (PPI) inflation also moderated in both advanced and emerging market economies (EMEs). PPI inflation in the OECD countries declined to 2.8 per cent in November 2008 from 9.9 per cent in July 2008.
VI.4 In the US, headline inflation firmed up till July 2008 driven by higher food, energy and transportation prices. However, inflation declined subsequently on account of decline in energy and transportation index. According to the latest assessment of the US Federal Open Market Committee (FOMC) on December 16, 2008, inflationary pressures in the US economy have diminished appreciably and are expected to moderate further in coming quarters. However, the outlook for economic activity has weakened further with deteriorating labour market conditions, and decline in consumer spending, business investment, and industrial production. Financial markets remained quite strained and credit conditions were tight. Against this backdrop, the FOMC reduced the policy rate by 50 basis points each on October 8 and October 29, 2008 to 1.0 per cent. Furthermore, as the weak economic conditions warranted for exceptionally low levels of the federal funds rate (US policy rate) for some time, the FOMC reduced the policy rate to a target range of 0-0.25 per cent on December 16, 2008.
VI.5 In the UK, CPI inflation increased sharply up to September 2008, mainly reflecting upward contributions from prices of housing and household services, clothing and transport costs. Subsequently, CPI inflation declined on account of reduction in transport costs and downward pressure from housing and household services. According to the latest assessment of the Monetary Policy Committee (MPC), inflation is expected to fall further, reflecting waning contributions from retail energy and food prices and the direct impact of the temporary reduction in value added tax. The Committee’s projection for inflation showed a substantial risk of undershooting the 2 per cent CPI inflation target in the medium term at the existing bank rate while the outlook on economic activity remained weak. Accordingly, after keeping the policy rate unchanged since April 2008, the Bank of England cut the policy rate by a total of 350 basis points to 1.5 per cent since October 2008 (Table 54).
Table 54: Global Inflation Indicators |
(Per cent) |
Country/ |
Key Policy |
Policy Rate |
Changes in |
CPI Inflation |
PPI Inflation |
Real GDP |
Region |
Rate |
(As on |
Policy Rates (basis points) |
(y-o-y) |
(y-o-y) |
Growth (y-o-y) |
|
|
January 22, 2009) |
2007-08(Apr- Mar) |
Since end- March2008 |
Dec. 2007 |
Dec. 2008 |
Nov.
2007 |
Nov.
2008 |
2007
(Q3) |
2008
(Q3) |
1 |
2 |
3 |
4 |
5 |
6 |
7 |
8 |
9 |
10 |
11 |
Developed Economies |
Australia |
Cash Rate |
4.25 |
(Dec. 2, 2008) |
100 |
(-) 300 |
1.9^ |
5.0^ |
2.4^ |
5.6^ |
4.5 |
1.9 |
Canada |
Overnight Rate |
1.00 |
(Jan.20, 2009) |
(-)75 |
(-) 250 |
2.5* |
2.0* |
-0.6 |
5.9 |
3.1 |
0.5 |
Euro area |
Interest Rate on Main |
2.00 |
(Jan. 15, 2009) |
25 |
(-) 200 |
3.1 |
1.6 |
4.3 |
3.3 |
2.6 |
0.6 |
|
Refinancing Operations |
|
|
|
|
|
|
|
|
|
|
Japan |
Uncollateralised |
0.10 |
(Dec.19, 2008) |
0 |
(-) 40 |
0.6* |
1.0* |
2.6 |
1.1 |
1.9 |
-0.5 |
|
Overnight Call Rate |
|
|
|
|
|
|
|
|
|
|
UK |
Official Bank Rate |
1.50 |
(Jan 8, 2009) |
0 |
(-) 375 |
2.1 |
3.1 |
5.0 |
4.7 |
3.3 |
0.3 |
US |
Federal Funds Rate |
0.00 to |
|
(-)300 |
(-) 200 |
4.1 |
0.1 |
6.3 |
-0.9 |
2.8 |
0.7 |
|
|
0.25 |
(Dec.16, 2008) |
|
|
|
|
|
|
|
|
Developing Economies |
Brazil |
Selic Rate |
12.75 |
(Jan. 21, 2009) |
(-)150 |
150 |
4.5 |
5.9 |
9.4 |
9.8 |
5.6 |
6.8 |
India |
Reverse Repo Rate |
4.00 |
(Jan 2, 2009) |
0 |
(-) 200 |
5.5* |
10.4* |
3.6 |
5.9 |
9.3 |
7.6 |
|
Repo Rate |
5.50 |
(Jan 2, 2009) |
0 |
-225 |
|
|
|
|
|
|
|
|
|
|
(150) |
(-250) |
|
|
|
|
|
|
China |
Benchmark 1-year |
5.31 |
(Dec 23, 2008) |
108 |
(-) 216 |
6.9* |
2.4* |
4.6 |
2.0 |
11.5 |
9.0 |
|
Lending Rate |
|
|
(550) |
(-300) |
|
|
|
|
|
|
Indonesia |
BI Rate |
8.75 |
(Jan 7, 2009) |
(-)100 |
75 |
4.9 |
11.1 |
20.6 |
20.3 |
6.5 |
6.1 |
Israel |
Key Rate |
1.75 |
(Dec. 29, 2008) |
(-)25 |
(-) 200 |
3.4 |
3.8 |
9.8 |
0.6 |
4.9 |
5.1 |
Korea |
Base Rate** |
2.50 |
(Jan 9, 2009) |
50 |
(-) 250 |
3.6 |
4.1 |
3.6 |
5.6 |
5.1 |
3.8 |
Philippines |
Reverse Repo Rate |
5.50 |
(Dec.18 2008) + |
(-)250 |
50 |
3.9 |
8.0 |
11.8# |
5.5# |
7.1 |
4.6 |
Russia |
Refinancing Rate |
13.00 |
(Dec.1, 2008) |
(-)25 |
275 |
11.9 |
13.3 |
15.2# |
17.5# |
7.6 |
6.2 |
South Africa |
Repo Rate |
11.50 |
(Dec.12, 2008) |
200 |
50 |
8.4* |
11.8* |
9.0 |
12.6 |
5.1 |
2.9 |
Thailand |
1-day Repurchase Rate |
2.00 |
(Jan 14, 2009) |
(-)125 |
(-)125 |
3.2 |
0.4 |
8.7 |
-1.7 |
4.8 |
4.0 |
^ : Q3. *: November. # : October.
+ : The tiering system on placement with the BSP was removed and interest rates were adjusted to 6.0 per cent for the reverse repo
rate and 8.0 per cent for the repo rate effective July 13, 2007.
** : Since March 2008, the policy rate has been changed from overnight call rate to “the Bank of Korea Rate or (Base Rate)” and fixed at the same level as the current call rate target of 5.0 per cent on March 7, 2008.
Note :
1. For India, data on inflation pertain to CPI for Industrial Workers. Data on GDP growth for 2007 pertain to fiscal year 2007-08.
2. Figures in parentheses in column (3) indicate the dates when the policy rates were last revised.
3. Figures in parentheses in columns (5) and (6) indicate the variation in the cash reserve ratios during the period.
Source: International Monetary Fund, websites of respective central banks and The Economist. |
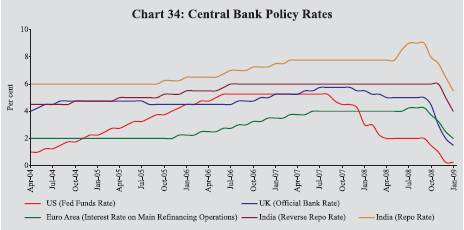
VI.6 In the Euro area, inflation based on Harmonised Index of Consumer Prices (HICP) declined significantly since July 2008 due to sharp fall in global commodity prices and major slowdown in economic activity. According to the Governing Council of the ECB, inflation is expected to be in line with price stability over the policy-relevant horizon. The Council also assessed that both global demand and Euro area demand are likely to be dampened for a protracted period of time due to the effects of intensification of financial turmoil. Accordingly, the ECB reduced the policy rate thrice by a total of 225 basis points between October and December 2008 to 2.0 per cent. It had earlier raised policy rate by 25 basis points effective July 9, 2008 (Chart 34).
VI.7 Bank of Japan (BoJ) expected the CPI inflation in Japan to moderate further reflecting the declines in prices of petroleum products and stabilisation in the prices of food. However, economic conditions have been deteriorating and are likely to increase in severity for the immediate future as domestic demand had become weaker against the background of the declining corporate profits and the worsening employment and income situation in the household sector. Accordingly, BoJ reduced its policy rate by 20 basis points each on October 31, 2008 and December 19, 2008 to 0.1 per cent.
VI.8 Amongst the central banks in other major advanced economies, the policy rates were reduced in the third quarter of 2008-09 by the Reserve Bank of Australia by a total of 300 basis points to 4.25 per cent (lowest since December 2001) since September 2008, Bank of Canada by a total of 200 basis points since October 2008 to 1.00 per cent, Sveriges Riksbank (Sweden) by 275 basis points to 2.0 per cent and Swiss National Bank by 250 basis points to 0.0 to 1.0 per cent since October 2008.
VI.9 Inflation firmed up in most emerging market economies (EMEs) during the first half of 2008-09 on the back of strong growth and ample liquidity as well as upward pressures from increasing international commodity prices. Subsequently, inflation in EMEs started easing on account of decline in international commodity prices and general slowdown in economic activity emerging from the spillover of the global financial crisis. The monetary policy responses of most central banks in EMEs during the first half of 2008-09 were oriented towards containing inflation and inflationary expectations using pre-emptive tightening of the monetary policy. As the inflationary pressures subsided and adverse impact of the global financial crisis led to a slowdown in economic activity in most developing economies, the focus of monetary policy shifted towards easing monetary conditions to support the recovery of economic activity.
VI.10 Among the major emerging economies, consumer price inflation in China eased to 2.4 per cent in November 2008 from 8.3 per cent in March 2008 (Chart 35). Accordingly, the Peoples Bank of China (PBC) reduced the benchmark 1-year lending rate by a total of 216 basis
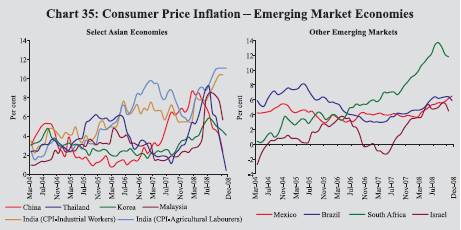
points to 5.31 per cent and cash reserve ratio (CRR) by a total of 300 basis points (400 basis points for small and medium-sized depositary financial institutions) since September 2008 to facilitate continued stable and fast development of the national economy. The PBC had earlier increased the benchmark 1-year lending rate by a total of 189 basis points beginning April 2006 to 7.47 per cent on December 21, 2007 and the CRR by a total of 1000 basis points to 17.5 per cent between July 2006 and June 2008.
VI.11 In Korea, consumer price inflation declined to 4.1 per cent in December 2008 from 5.9 per cent in July 2008. As the consumer price inflation has been decelerating steadily and domestic economy was slackening at a rapid pace, the Monetary Policy Committee of the Bank of Korea reduced the policy rate by a total of 275 basis points since October 2008 to 2.5 per cent. In Thailand, as the risks to inflation declined while the economic activity has slowed down notably, the Bank of Thailand reduced the policy rate by 100 basis points on December 3, 2008 and further by 75 basis points on January 14, 2009 to 2.0 per cent to help the economic recovery as the economy faced numerous negative risks, both on domestic and external fronts. In Indonesia, as domestic inflationary pressures have eased steadily in recent months, Bank Indonesia reduced its policy rate by 25 basis points on December 4, 2008 and further by 50 basis points to 8.75 per cent on January 7, 2009 to promote economic growth while continuing to safeguard medium term inflation and financial sector stability.
Table 55: Key Macroeconomic Indicators: Emerging Markets |
(Per cent) |
Country |
|
Consumer Price Inflation |
Current Account Balance (per cent to GDP) |
Real Effective Exchange Rate (REER) |
Central Govt. Fiscal Balance(per cent of GDP) |
Rate
Real Policy |
Real GDP
Growth |
|
Dec. 2007 |
Dec.
2008 |
2006 |
2007 |
Dec. 2007 |
Dec.2008 |
2007 |
2008 |
Dec. 2007 |
Dec. 2008 |
2007 |
2008P |
1 |
2 |
3 |
4 |
5 |
6 |
7 |
8 |
9 |
10 |
11 |
12 |
13 |
Brazil |
4.5 |
5.9 |
1.3 |
0.1 |
15.8 |
-18.4 |
-2.3 |
-1.5 |
6.8 |
7.9 |
5.4 |
5.2 |
China |
6.9* |
2.4* |
9.4 |
11.3 |
4.9 |
12.7 |
1.0 |
0.8 |
0.6 |
2.9 |
11.9 |
9.7 |
India |
5.5* |
10.4* |
-1.1 |
-1.5 |
7.5 |
-12.6 |
-2.8^ |
-2.5 @ |
2.3 |
-3.9 |
9.0 |
7.8 |
|
(3.8) |
(5.9) |
(-6.8) |
(-7.8) |
|
|
(61.5) |
(57.7) |
(4.0) |
(0.6) |
|
|
Indonesia |
4.9 |
11.1 |
3.0 |
2.5 |
-6.3 |
-8.3 |
-1.6 |
-1.1 |
3.1 |
-1.9 |
6.3 |
6.1 |
Israel |
3.4 |
3.8 |
5.9 |
3.2 |
1.2 |
10.7 |
-0.8 |
-1.9 |
0.6 |
-1.3 |
5.4 |
4.3 |
Korea |
3.6 |
4.1 |
0.6 |
0.6 |
-5.8 |
-30.6 |
-1.5 |
-1.1 |
1.4 |
-1.1 |
5.0 |
4.1 |
Philippines |
3.9 |
8.0 |
4.5 |
4.4 |
14.9 |
-7.6 |
-0.2 |
-1.0 |
1.4 |
-2.5 |
7.2 |
4.4 |
Russia |
11.9 |
13.3 |
9.5 |
5.9 |
7.1 |
3.8 |
6.2 |
6.1 |
-1.9 |
-0.3 |
8.1 |
6.8 |
South Africa |
8.4* |
11.8* |
-6.5 |
-7.3 |
2.0 |
-19.3 |
0.9 |
0.8 |
2.6 |
-0.3 |
5.1 |
3.8 |
Thailand |
3.2 |
0.4 |
1.1 |
6.4 |
1.0 |
-5.0 |
-1.7 |
-1.8 |
-0.5 |
3.4 |
4.8 |
4.7 |
^ : Provisional Accounts. * : November. P : Projected. @ : Budget estimates.
Note:
1. For India, data pertain to fiscal years 2007-08 and 2008-09.
2. Consumer price inflation data are on a year-on-year basis. Data for India are for CPI-Industrial Workers.
3. Real policy rate is the policy rate less year-on-year consumer price inflation. For India, repo rate is used.
4. Figures in parentheses in columns (2) and (3) refer to wholesale price inflation.
5. Figures in parentheses in columns (4) and (5) refer to trade balance/GDP ratio.
6. Data on fiscal balance for Israel pertain to general government balance.
7. Figures in parentheses in columns (8) and (9) refer to central government debt/GDP ratio.
8. Figures in parentheses in columns (10) and (11) for India are based on wholesale price inflation.
9. Data on REER refer to year-on-year variation in broad indices (CPI-based) compiled by the Bank for International Settlements. A positive figure indicates appreciation while a negative figure indicates depreciation. For India, data are based on movements in 6-currency indices.
Source: International Monetary Fund; Asian Development Bank; Bank for International Settlements; World Bank, The Economist and official websites of respective central banks. |
VI.12 An assessment of key macroeconomic indicators in select EMEs shows that consumer price inflation was in the range of 0.4-13.3 per cent in December 2008. Real policy rates ranged between (-)3.9 and 7.9 per cent in December 2008 (Table 55). Current account in major EMEs, except India and South Africa, was in surplus during 2006-07. The real effective exchange rate (REER) for the select EMEs, barring the currencies in China, Israel and Russia underwent real depreciation, on a year-on-year basis, in December 2008. Although the Central Government’s fiscal deficit as per cent of GDP in India declined during 2007-08, it remained higher than that in most EMEs.
Global Commodity Prices
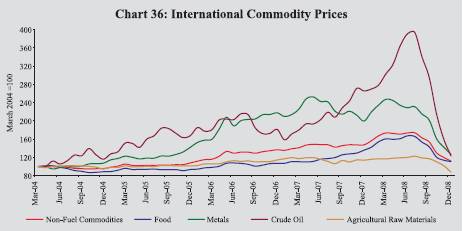
VI.13 After remaining at elevated levels for an extended period, global commodity prices declined sharply since the second quarter of 2008-09 led by decline in the prices of crude oil, metals and food (Table 56 and Chart 36).
Table 56: International Commodity Prices |
Commodity |
Unit |
2004 Market |
Index (2004=100) |
Variation (Per cent) |
|
|
Price |
2005 |
2006 |
2007 |
2008 |
Dec. 08/ |
Dec. 08/ |
|
|
|
|
|
|
Mar. |
Jun. |
Sep. |
Dec. |
Mar. 08 |
Dec. 07 |
1 |
2 |
3 |
4 |
5 |
6 |
7 |
8 |
9 |
10 |
11 |
12 |
Energy |
Coal |
$/mt |
53.0 |
90 |
93 |
124 |
223 |
302 |
283 |
149 |
-33.5 |
-13.6 |
Crude oil (Average) |
$/bbl |
37.7 |
142 |
170 |
188 |
270 |
349 |
264 |
110 |
-59.4 |
-53.8 |
Non-Energy Commodities |
Palm oil |
$/mt |
471.3 |
90 |
101 |
165 |
265 |
257 |
164 |
107 |
-59.7 |
-47.1 |
Soybean oil |
$/mt |
616.0 |
88 |
97 |
143 |
240 |
250 |
199 |
120 |
-50.0 |
-36.6 |
Soybeans |
$/mt |
306.5 |
90 |
88 |
125 |
188 |
203 |
166 |
117 |
-37.4 |
-30.1 |
Rice |
$/mt |
237.7 |
120 |
128 |
137 |
250 |
318 |
288 |
224 |
-10.6 |
47.3 |
Wheat |
$/mt |
156.9 |
97 |
122 |
163 |
280 |
222 |
188 |
140 |
-49.9 |
-40.3 |
Maize |
$/mt |
111.8 |
88 |
109 |
146 |
210 |
257 |
209 |
142 |
-32.5 |
-12.2 |
Sugar |
c/kg |
15.8 |
138 |
206 |
141 |
184 |
169 |
189 |
164 |
-11.0 |
10.1 |
Cotton A Index |
c/kg |
136.6 |
89 |
93 |
102 |
129 |
124 |
119 |
90 |
-30.8 |
-20.2 |
Aluminium |
$/mt |
1716.0 |
111 |
150 |
154 |
175 |
172 |
147 |
87 |
-50.4 |
-37.4 |
Copper |
$/mt |
2866.0 |
128 |
235 |
248 |
294 |
288 |
244 |
107 |
-63.6 |
-53.4 |
Gold |
$/toz |
409.2 |
109 |
148 |
170 |
237 |
217 |
203 |
199 |
-15.7 |
1.6 |
Silver |
c/toz |
669.0 |
110 |
173 |
200 |
287 |
255 |
182 |
154 |
-46.3 |
-27.9 |
Steel cold-rolled coilsheet |
$/mt |
607.1 |
121 |
114 |
107 |
132 |
181 |
181 |
181 |
37.5 |
69.2 |
Steel hot-rolled coilsheet |
$/mt |
502.5 |
126 |
119 |
109 |
149 |
199 |
199 |
199 |
33.3 |
81.8 |
Tin |
c/kg |
851.3 |
87 |
103 |
171 |
233 |
261 |
216 |
132 |
-43.2 |
-30.9 |
Zinc |
c/kg |
104.8 |
132 |
313 |
309 |
240 |
181 |
166 |
105 |
-56.2 |
-53.2 |
$: US dollar. c: US cent. bbl: barrel. mt: metric tonne. kg: Kilogram. toz: troy oz.
Source: Based on World Bank’s actual commodity price data. The year 2004 has been taken as the base to better exhibit price trends over the relevant period. |
VI.14 International crude oil prices, represented by the West Texas Intermediate (WTI), which had risen sharply up to early July 2008 reflecting tight supply-demand balance, geopolitical tensions, weakening of the US dollar against major currencies and increased interest from investors and financial market participants, eased subsequently (Table 57). The WTI crude oil prices have eased from its historical
high of US $ 145.3 a barrel level on July 3, 2008 to US $ 42.3 a barrel as on January 22, 2009 reflecting falling demand in the Organisation for Economic Co-operation and Development (OECD) countries as well as some developing countries, notably in Asia, following the economic slowdown.
Table 57: International Crude Oil Prices |
(US dollars per barrel) |
Year/Month |
Dubai Crude |
UK Brent |
US WTI |
Average
Crude Price |
Indian
Basket Price |
1 |
2 |
3 |
4 |
5 |
6 |
2004-05 |
36.4 |
42.2 |
45.0 |
41.3 |
38.9 |
2005-06 |
53.4 |
58.0 |
59.9 |
57.1 |
55.4 |
2006-07 |
60.9 |
64.4 |
64.7 |
63.3 |
62.4 |
2007-08 |
77.3 |
82.4 |
82.3 |
80.7 |
79.2 |
March 2008 |
96.8 |
103.3 |
105.5 |
101.8 |
99.4 |
June 2008 |
127.6 |
133.1 |
133.9 |
131.5 |
129.8 |
July 2008 |
131.2 |
133.9 |
133.4 |
132.8 |
132.3 |
August 2008 |
113.2 |
113.9 |
116.6 |
114.6 |
113.5 |
September 2008 |
96.0 |
99.1 |
103.9 |
99.7 |
97.1 |
October 2008 |
68.6 |
72.8 |
76.6 |
72.7 |
70.2 |
November 2008 |
51.4 |
53.2 |
57.3 |
54.0 |
52.1 |
December 2008 |
41.0 |
41.6 |
41.4 |
41.3 |
41.2 |
Source : International Monetary Fund and the World Bank. |
VI.15 The slower consumption growth in advanced economies in the wake of significant slowdown in these economies is expected to keep oil prices low. In view of the relatively tight demand supply-balance, the long term outlook for oil, however, remains highly uncertain (Table 58). According to the US Energy Information
Table 58: World Supply-Demand Balance of Oil |
(Million barrels per day) |
Item |
2007 |
2008 |
2009 (P) |
2009 (P) |
|
|
|
|
Q1 |
Q2 |
Q3 |
Q4 |
1 |
2 |
3 |
4 |
5 |
6 |
7 |
8 |
Demand |
1. |
OECD |
49.1 |
47.7 |
46.4 |
47.2 |
45.2 |
45.8 |
47.5 |
2. |
Non-OECD |
36.8 |
38.2 |
38.7 |
38.2 |
38.6 |
38.8 |
39.2 |
|
of which: China |
7.6 |
8.0 |
8.3 |
8.0 |
8.3 |
8.3 |
8.5 |
3. |
Total (1+2) |
85.9 |
85.9 |
85.1 |
85.4 |
83.8 |
84.6 |
86.7 |
Supply |
4. |
OPEC |
34.4 |
35.8 |
35.0 |
34.1 |
34.3 |
35.6 |
36.1 |
5. |
Non-OPEC |
50.0 |
49.7 |
49.9 |
49.5 |
50.1 |
49.9 |
50.0 |
6. |
Total (4+5) |
84.4 |
85.5 |
84.9 |
83.6 |
84.4 |
85.5 |
86.1 |
Stock Changes |
-1.5 |
-0.4 |
-0.2 |
-1.8 |
0.6 |
0.9 |
0.6 |
P: Projections.
Source: US Energy Information Administration, January 2009. |
Administration (EIA), the global economic downturn pointed to declining oil consumption in 2009, while additional production capacity from both OPEC and non-OPEC nations is expected to boost surplus production capacity, reducing the likelihood of a renewed strong upward pressure on prices. Assuming no major crude oil supply disruptions, average WTI prices are expected to be US$ 43.3 per barrel in 2009 which is 57 per cent lower than the average price for the year 2008 (US$ 99.6 per barrel). The depth and duration of the global economic downturn, the pace and timing of the recovery, and actual OPEC production are expected to be the crucial factors driving world oil prices.
VI.16 Metal prices eased further during the third quarter of 2008-09, reflecting weak construction demand in OECD countries and some improvement in supply, especially in China. Between March and December 2008, the IMF metals price index (which includes copper, aluminum, iron ore, tin, nickel, zinc, lead, and uranium price indices) declined by 48 per cent. International steel prices (represented by World Bank steel products index) declined by about 17 per cent during August-December 2008. After increasing by about 66 per cent in January 2008, international iron ore prices remained flat thereafter up to December 2008.
VI.17 Food prices, which had increased sharply up to the first quarter of 2008-09 reflecting higher demand and low stocks, eased significantly since the second quarter of the year on the back of improved supply prospects, particularly for oilseeds and grains in major producing countries. The World Bank’s food price index declined by about 38 per cent during July-December 2008, led by edible oils, rice, maize and wheat (Chart 37). Notwithstanding the recent easing,
]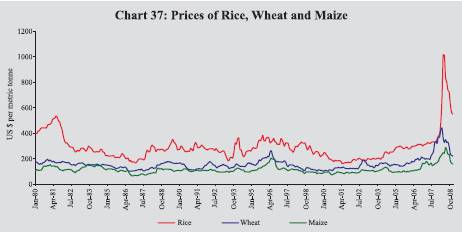
however, on a year-on-year basis, international prices of rice were 47 per cent higher in December 2008. Notwithstanding the recent decline in food prices since June 2008, the IMF food price index in December 2008 was still above the level which was last seen in 1981. According to the US Department of Agriculture, global wheat and rice production are projected to increase by about 12 per cent and 2 per cent, respectively, during 2008-09 to 683 million metric tonnes and 439 million metric tonnes. Similarly, global supplies of oilseeds and vegetables oils are also expected to increase by about 3 per cent and 4 per cent, respectively, during 2008-09.
VI.18 International sugar prices, which had declined somewhat during the first quarter of 2008-09, have increased thereafter by about 21 per cent during June-August 2008, declined again by 20 per cent during September-December 2008. Global cotton prices, which had declined during the first quarter of 2008- 09, increased subsequently before declining since September 2008. Accordingly, cotton prices represented by the ‘Cotton A Index’ were lower by about 20 per cent, year-on-year, in December 2008. According to the International Cotton Advisory Committee (ICAC), world cotton production and consumption were expected to decline by 8 per cent and 7 per cent respectively in 2008-09 and the shortage is expected to be met by a fall in world cotton stocks. Accordingly, ICAC expects prices to go down by about 7 per cent in 2008-09.
Inflation Conditions in India
VI.19 The Annual Policy Statement for 2008-09 (April 2008) of the Reserve Bank reaffirmed its resolve to bring down inflation to around 5.5 per cent in 2008-09 with a preference for bringing it as close to 5.0 per cent as soon as possible, recognising the evolving complexities in globally transmitted inflation. As the potential inflationary pressures from international food and energy prices had amplified, the policy focused on conditioning perceptions for inflation in the range of 4.0-4.5 per cent so that an inflation rate of around 3.0 per cent became a medium-term objective consistent with India’s broader integration into the global economy and with the goal of maintaining self-accelerating growth over the medium-term.
VI.20 With the inflation rate, based on wholesale price index hardening, following on adjustment of overall aggregate demand on an economy-wide basis was warranted to ensure that generalised instability did not develop and erode the hard-earned gains in terms of both outcomes of and positive sentiments on India’s growth momentum. The priority for monetary policy was identified to be eschewing any further intensification of inflationary pressures and to firmly anchor inflation expectations. Accordingly, the Reserve Bank increased the cash reserve ratio (CRR) by a total of 100 basis points between May and July 2008 to 8.75 per cent. Furthermore, the repo rate under the Liquidity Adjustment Facility (LAF) was increased by a total of 75 basis points to 8.50 per cent in June 2008. The First Quarter Review of the Annual Statement on Monetary Policy for 2008-09 expected that inflation would moderate from then prevailing high levels in the months to come. In view of the prevailing macroeconomic, liquidity and overall monetary conditions, the First Quarter Review announced an increase in the fixed repo rate under the LAF by 50 basis points from 8.5 per cent to 9.0 per cent with effect from July 30, 2008 and an increase in the CRR by 25 basis points to 9.0 per cent with effect from August 30, 2008 (Table 59). These measures were aimed at bringing down inflation from the then prevailing level to a level close to 7.0 per cent by end March 2009.
VI.21 As the WPI inflation started ebbing since August 2008, mainly on account of decline in prices of freely priced petroleum products, edible oils and textiles, the Mid-Term Review of Annual Policy for the Year 2008-09 observed that in the absence of further shocks, generalised inflation cannot be sustained, especially with money supply contained at the average rate of 2003-08, a period when inflation was low and stable. Also just as the elevation of international commodity prices were not fully passed on to domestic prices, the effect of softening international commodity prices on inflation in India could be similarly muted. The challenge for the setting of monetary policy was identified to be balancing the costs of lowering inflation in terms of output volatility, particularly in the context of the moderation in industrial and service sector activity, against the risk of the then prevailing levels of inflation persisting and getting embedded in inflation expectations. While there were considerable uncertainties associated with this judgment, the review highlighted the importance of remaining focused on bringing inflation down to levels that are compatible with a high but stable momentum of growth in the economy and financial stability.
VI.22 The extraordinary global developments triggered by the bankruptcy/ sellout/ restructuring of some of the world’s largest financial institutions since
Table 59: Movement in Key Policy Rates in India |
(Per cent) |
Effective since |
Reverse Repo Rate |
Repo Rate |
Cash Reserve |
WPI Inflation |
1 |
2 |
3 |
4 |
5 |
June 9, 2006 |
5.75 (+0.25) |
6.75 (+0.25) |
5.00 |
4.9 |
July 25, 2006 |
6.00 (+0.25) |
7.00 (+0.25) |
5.00 |
4.7 |
October 31, 2006 |
6.00 |
7.25 (+0.25) |
5.00 |
5.4 |
December 23, 2006 |
6.00 |
7.25 |
5.25 (+0.25) |
5.8 |
January 6, 2007 |
6.00 |
7.25 |
5.50 (+0.25) |
6.4 |
January 31, 2007 |
6.00 |
7.50 (+0.25) |
5.50 |
6.7 |
February 17, 2007 |
6.00 |
7.50 |
5.75 (+0.25) |
6.0 |
March 3, 2007 |
6.00 |
7.50 |
6.00 (+0.25) |
6.5 |
March 31, 2007 |
6.00 |
7.75 (+0.25) |
6.00 |
5.9 |
April 14, 2007 |
6.00 |
7.75 |
6.25 (+0.25) |
6.3 |
April 28, 2007 |
6.00 |
7.75 |
6.50 (+0.25) |
6.0 |
August 4, 2007 |
6.00 |
7.75 |
7.00 (+0.50) |
4.4 |
November 10, 2007 |
6.00 |
7.75 |
7.50 (+0.50) |
3.2 |
April 26, 2008 |
6.00 |
7.75 |
7.75 (+0.25) |
8.3 |
May 10,2008 |
6.00 |
7.75 |
8.00 (+0.25) |
8.6 |
May 24,2008 |
6.00 |
7.75 |
8.25 (+0.25) |
8.9 |
June 12, 2008 |
6.00 |
8.00 (+0.25) |
8.25 |
11.7 |
June 25, 2008 |
6.00 |
8.50 (+0.50) |
8.25 |
11.9 |
July 5, 2008 |
6.00 |
8.50 |
8.50 (+0.25) |
12.2 |
July 19, 2008 |
6.00 |
8.50 |
8.75 (+0.25) |
12.5 |
July 30, 2008 |
6.00 |
9.00 (+0.50) |
8.75 |
12.5 |
August 30, 2008 |
6.00 |
9.00 |
9.00 (+0.25) |
12.4 |
October 11, 2008 |
6.00 |
9.00 |
6.50 (–2.50) |
11.3 |
October 20, 2008 |
6.00 |
8.00 (–1.00) |
6.50 |
10.8 |
October 25, 2008 |
6.00 |
8.00 |
6.00 (–0.50) |
10.7 |
November 3, 2008 |
6.00 |
7.50 (–0.50) |
6.00 |
8.7 |
November 8, 2008 |
6.00 |
7.50 |
5.50 (–0.50) |
8.7 |
December 8, 2008 |
5.00 (–1.00) |
6.50 (–1.00) |
5.50 |
6.8 |
January 5, 2009 |
4.00 (–1.00) |
5.50 (–1.00) |
5.50 |
5.2 |
January 17, 2009 |
4.00 |
5.50 |
5.00 (–0.50) |
— |
Note:
1. With effect from October 29, 2004, the nomenclature of repo and reverse repo was changed in keeping with international usage. Now, reverse repo indicates absorption of liquidity and repo signifies injection of liquidity. Prior to October 29, 2004, repo indicated absorption of liquidity, while reverse repo meant injection of liquidity.
2. Figures in parentheses indicate change in policy rates. |
September 2008 resulted in a sharp deterioration in the global financial environment and recession in major advanced economies. India’s growth trajectory has also been impacted both by the financial crisis and the follow-on global economic downturn. Reflecting these developments, the Reserve Bank adjusted its policy stance from demand management to arresting the moderation in growth. Accordingly, since mid-September 2008, the Reserve Bank has reduced the repo rate under the LAF from 9.0 per cent to 5.5 per cent, the reverse repo rate under the LAF from 6.0 per cent to 4.0 per cent and the CRR from 9.0 per cent to 5.0 per cent. The aim of these measures was to augment domestic liquidity and to ensure that credit continues to flow to productive sectors of the economy.
Wholesale Price Inflation
VI.23 In India, inflation based on the wholesale price index (WPI) increased to an intra-year peak of 12.9 per cent on August 2, 2008 from 7.7 per cent at end-March 2008. This mainly reflected the impact of some
Table 60: Key Commodity Prices – Global vis-à-vis Domestic |
(year-on-year) |
Per cent |
Item |
Annual Inflation |
Recent trends |
|
Global |
India |
Global |
India |
|
Dec. 2008 over Dec. 2007 |
Inflation* |
Weighted contribution |
Dec. 2008 over July
2008 |
Jan. 10, 2009
over
Aug. 2,
2008 |
Weighted contribution |
1 |
2 |
3 |
4 |
5 |
6 |
7 |
1. |
Rice |
47.3 |
12.8 |
5.0 |
-27.4 |
8.3 |
3.6 |
2. |
Wheat |
-40.3 |
5.8 |
1.5 |
-32.9 |
1.9 |
0.6 |
3. |
Milk |
.. |
7.1 |
5.5 |
.. |
2.9 |
2.5 |
4. |
Raw Cotton |
-20.2 |
19.1 |
3.9 |
-28.2 |
-10.4 |
-3.0 |
5. |
Oilseeds |
-30.1 |
7.2 |
3.6 |
-43.2 |
-6.4 |
-3.9 |
6. |
Iron Ore |
66.0 |
40.1 |
5.7 |
0.0 |
-9.1 |
-2.1 |
7. |
Coal mining |
-13.6 |
1.0 |
0.4 |
-56.3 |
0.0 |
0.0 |
8. |
Minerals Oil |
-53.8 |
-3.1 |
-7.0 |
-68.9 |
-20.9 |
-63.2 |
9. |
Edible Oils |
-(37-47) |
-0.2 |
-0.1 |
-(55- 51) |
-8.6 |
-4.1 |
10. |
Oil Cakes |
-19.0 |
0.2 |
0.1 |
-32.1 |
-18.8 |
-8.4 |
11. |
Basic Heavy Inorganic Chemicals |
.. |
-8.1 |
-2.0 |
.. |
-18.6 |
-5.7 |
12. |
Basic Metals, Alloys and Products |
-36.4# |
11.5 |
19.6 |
-45.0# |
-7.8 |
-17.1 |
|
- Iron and Steel |
54.6 |
14.1 |
11.8 |
-15.1 |
-11.9 |
-13.8 |
*: Based on WPI as on January 10, 2009.
#: Represented by IMF metals price index, which covers copper, aluminium, iron ore, tin, nickel, zinc, lead and uranium.
Note: Global price increases are based on the World Bank and IMF primary commodity prices data. |
pass-through of international crude oil prices to domestic prices as well as elevated levels of prices of iron and steel, basic heavy inorganic chemicals, machinery and machine tools, oilseeds/oil cakes, raw cotton and textiles on account of strong demand as well as international commodity price pressures. Subsequently, inflation declined sharply to 5.6 per cent as on January 10, 2009. The decline in WPI index by 4.7 per cent over the same period was driven by the decline in prices of minerals oil, iron and steel, oilseeds, edible oils, oil cakes and raw cotton (Table 60).
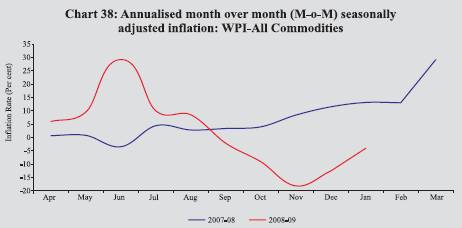
VI.24 Inflation momentum, as indicated by the movement of the annualised month-over-month (M-o-M) seasonally adjusted WPI inflation, has shown considerable volatility during 2007-08 as also 2008-09 so far. While annualised M-o-M seasonally adjusted inflation reached a peak in March 2008, it entered negative territory since September 2008 (Chart 38). VI.25 The y-o-y inflation, excluding fuel, was at 7.5 per cent as on January 10,
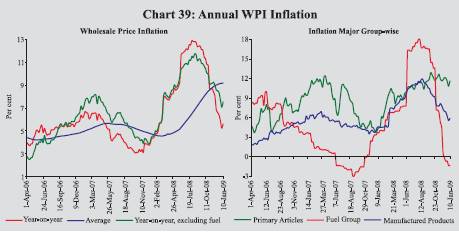
2009 as compared with 4.5 per cent a year ago. The annual average WPI inflation rate (average of 52 weeks) increased to 9.2 per cent as on January 10, 2009 from 5.8 per cent at end-June 2008 and 4.7 per cent at end-March 2008 (4.7 per cent a year ago) (Chart 39).
VI.26 Amongst major groups, primary articles inflation, y-o-y, increased to 11.6 per cent on January 10, 2009 from 4.5 per cent a year ago and (it was 9.7 per cent at end-March 2008). This mainly reflected increase in the prices of food articles, especially of wheat, fruits, milk, and eggs, fish and meat as well as non-food articles such as oilseeds and raw cotton. The higher annual inflation in prices of oilseeds could be attributed to higher demand as well as elevated global prices. Notwithstanding higher domestic production during 2007-08, raw cotton prices have increased by 11.5 per cent over end-March 2008 reflecting estimated lower domestic production under the current kharif crop (down by 7.4 per cent as per the First Advance Estimates for 2008-09) as well as higher exports on the back of firm international prices. Minerals prices increased sharply as iron ore prices increased by 40.1 per cent, y-o-y, as compared with 6.2 per cent a year ago.
VI.27 Fuel group inflation, increased to an intra-year peak of 18.0 per cent on August 2, 2008 from 6.8 per cent at end-March 2008 mainly due to increase in the prices of minerals oils reflecting the effect of the hikes in the prices of petrol (Rs.5 per litre), diesel (Rs.3 per litre) and LPG (Rs.50 per cylinder) on June 4, 2008 as well as increase in the prices of freely priced petroleum products.
VI.28 In response to easing in international crude oil prices, domestic prices of freely priced petroleum products declined by about 65 per cent in case of naphtha (beginning the first week of August 2008), about 61 per cent in case of aviation turbine fuel (beginning the first week of September 2008), about 58 per cent in case of furnace oil (beginning mid-August 2008), about 30 per cent in the case of bitumen (beginning mid-November 2008) and about 3 per cent in the case of lubricants (beginning first week of December 2008). An analysis of price variation from February 2007 (when the fuel price was cut) reveals that international crude (Indian Basket) prices have come down to US $ 41.2 a barrel in December 2008 from US $ 56.6 a barrel in February 2007 after increasing up to US
$ 132.2 in July 2008. Against this backdrop, the Government cut the price of petrol by Rs. 5 per litre and diesel by Rs. 2 per litre effective December 6, 2008. Consequently, the fuel group inflation turned negative (-1.3 per cent) as on January 10, 2009.
VI.29 Manufactured products inflation, year-on-year, also moderated to 5.9 per cent on January 10, 2009 as compared with the peak of 11.9 per cent in mid-August 2008 but remained higher than 4.6 per cent a year ago (Table 61). The year-on-year increase in manufactured products prices was mainly driven by sugar, edible oils/oil cakes, textiles, chemicals, iron and steel and machinery and machine tools.
VI.30 Oilseeds and edible oils/oil cakes prices declined recently reflecting the effect of fiscal measures as well as easing international prices on the back of projected increase in global production (Chart 40). However, according to the First Advance Estimates for 2008-09, domestic kharif oilseeds crop is expected to be down by 9.6 per cent. Moreover, the Government has imposed 20 per cent customs duty on import of crude soybean
Table 61: Wholesale Price Inflation in India |
(year-on-year) |
(Per cent) |
Commodity |
Weight |
2007-08
(March 29) |
2007-08
(January 12) |
2008-09 P
(January 10) |
|
|
Inflation |
WC |
Inflation |
WC |
Inflation |
WC |
1 |
2 |
3 |
4 |
5 |
6 |
7 |
8 |
All Commodities |
100.0 |
7.7 100.0 |
4.4 100.0 |
5.6 |
100.0 |
1. |
Primary Articles |
22.0 |
9.7 |
28.2 |
4.5 |
23.2 |
11.6 |
46.9 |
|
Food Articles |
15.4 |
6.5 |
13.2 |
2.0 |
7.1 |
11.6 |
32.2 |
|
i. Rice |
2.4 |
9.1 |
2.5 |
7.6 |
3.7 |
12.8 |
5.0 |
|
ii. Wheat |
1.4 |
5.1 |
1.0 |
-1.7 |
-0.6 |
5.8 |
1.5 |
|
iii. Pulses |
0.6 |
-1.9 |
-0.2 |
-10.9 |
-1.9 |
13.4 |
1.5 |
|
iv. Vegetables |
1.5 |
14.2 |
2.3 |
0.9 |
0.3 |
27.9 |
6.1 |
|
v. Fruits |
1.5 |
4.1 |
1.0 |
-8.6 |
-3.8 |
19.5 |
5.9 |
|
vi. Milk |
4.4 |
8.7 |
4.7 |
9.5 |
9.0 |
7.1 |
5.5 |
|
vii. Eggs, Fish and Meat |
2.2 |
2.4 |
0.8 |
-0.5 |
-0.3 |
7.5 |
3.2 |
|
Non-Food Articles |
6.1 |
11.4 |
8.8 |
11.8 |
15.5 |
7.1 |
7.8 |
|
i. Raw Cotton |
1.4 |
14.0 |
2.0 |
24.4 |
5.3 |
19.1 |
3.9 |
|
ii. Oilseeds |
2.7 |
20.3 |
6.7 |
17.6 |
10.0 |
7.2 |
3.6 |
|
iii. Sugarcane |
1.3 |
-0.4 |
-0.1 |
-0.4 |
-0.1 |
0.0 |
0.0 |
|
Minerals |
0.5 |
49.9 |
6.2 |
3.3 |
0.7 |
41.0 |
7.0 |
2. |
Fuel, Power, Light and Lubricants |
14.2 |
6.8 |
18.9 |
3.7 |
18.6 |
-1.3 |
-5.1 |
|
i. Minerals Oil |
7.0 |
9.3 |
15.1 |
5.4 |
15.8 |
-3.1 |
-7.0 |
|
ii. Electricity |
5.5 |
1.5 |
1.4 |
-0.7 |
-1.1 |
1.3 |
1.6 |
|
iii. Coal Mining |
1.8 |
9.8 |
2.5 |
8.8 |
3.9 |
1.0 |
0.4 |
3. |
Manufactured Products |
63.8 |
7.3 |
52.8 |
4.6 |
58.1 |
5.9 |
58.5 |
|
i. Food Products |
11.5 |
9.4 |
12.4 |
6.3 |
14.7 |
4.5 |
8.3 |
|
of which: Sugar |
3.6 |
1.1 |
0.4 |
-7.8 |
-4.8 |
13.5 |
5.7 |
|
Edible Oils |
2.8 |
20.0 |
5.5 |
11.1 |
5.5 |
-0.2 |
-0.1 |
|
ii. Cotton Textiles |
4.2 |
-6.8 |
-2.8 |
-6.4 |
-4.7 |
16.0 |
8.3 |
|
iii. Man -made Fibres |
4.4 |
2.8 |
0.7 |
1.4 |
0.6 |
1.1 |
0.4 |
|
iv. Chemicals and Products |
11.9 |
6.0 |
8.7 |
7.4 |
18.9 |
2.9 |
5.9 |
|
of which : Fertilisers |
3.7 |
5.1 |
2.0 |
1.9 |
1.3 |
8.1 |
4.4 |
|
v. Basic Metals, Alloys and Metal Products |
8.3 |
20.3 |
25.2 |
2.9 |
6.3 |
11.5 |
19.6 |
|
of which: Iron and Steel |
3.6 |
34.2 |
20.1 |
7.6 |
7.9 |
14.1 |
11.8 |
|
vi. Non-Metallic Mineral Products |
2.5 |
6.4 |
2.0 |
9.4 |
5.0 |
1.9 |
0.8 |
|
of which:Cement |
1.7 |
5.1 |
1.1 |
11.6 |
4.4 |
0.0 |
0.0 |
|
vii. Machinery and Machine Tools |
8.4 |
3.5 |
2.9 |
5.2 |
7.6 |
5.1 |
5.8 |
|
of which: Electrical Machinery |
5.0 |
4.8 |
2.0 |
8.0 |
5.9 |
5.2 |
3.1 |
|
viii. Transport Equipment and Parts |
4.3 |
3.9 |
1.7 |
4.9 |
3.8 |
3.4 |
2.0 |
Memo: |
|
|
|
|
|
|
|
|
Food Items (Composite) |
26.9 |
7.7 |
25.6 |
3.6 |
21.8 |
8.8 |
40.5 |
|
WPI Excluding Food |
73.1 |
7.8 |
74.4 |
4.6 |
78.2 |
4.5 |
59.5 |
|
WPI Excluding Fuel |
85.8 |
8.0 |
81.1 |
4.5 |
81.4 |
7.5 |
105.1 |
WC: Weighted Contribution.
P: Provisional. |
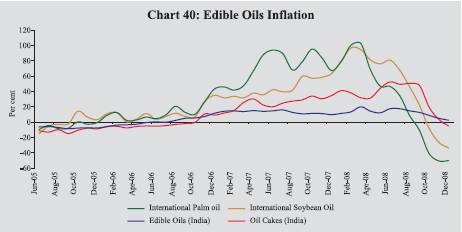
oil to safeguard the interest of domestic producers on November 18, 2008. Reflecting hardening of raw cotton prices, cotton textile prices in India also increased by 16.9 per cent over end-March 2008 as on January 10, 2009.
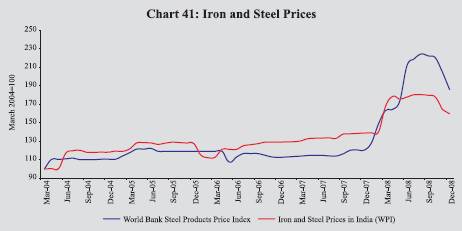
VI.31 Domestic metal prices have gone up by 11.5 per cent, y-o-y, on January 10, 2009 (reflecting 14.1 per cent increase in iron and steel prices and 4.3 per cent decline in non-ferrous metals prices). Recently, iron and steel prices have shown a decline since end-August 2008 by 12.1 per cent (Chart 41). This decline in domestic iron and steel prices could be attributed to declining global prices, expected deceleration in demand, both domestic and external, as well as various fiscal measures in the form of reductions in customs duties and imposition of export duties on various steel items announced by the Government of India since April 2008.
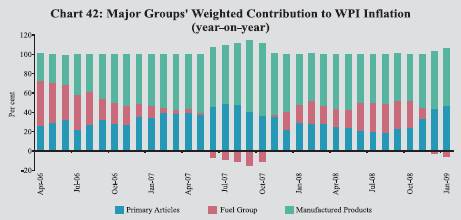
VI.32 Overall, ‘manufactured products’ group was the major driver of y-o-y WPI inflation as on January 10, 2009 with weighted contribution of 58.5 per cent (58.1 per cent a year ago), followed by ‘primary articles’ group at 46.9 per cent (23.2 per cent) while the contribution of the ‘fuel, power, light and lubricants’ group was negative 5.1 per cent as against a positive contribution of 18.6 per cent a year ago. The recent declining phase of WPI inflation is marked by a sharp decline in contribution of fuel group to overall WPI inflation while that of primary articles increased substantially (Chart 42).
Consumer Price Inflation
VI.33 Inflation, based on y-o-y variation in consumer price indices (CPIs), increased further during November 2008 mainly due to increase in the prices of food, fuel and services (represented by the ‘miscellaneous’ group). Various measures of consumer price inflation were placed in the range of 10.4-11.1 per cent during November/December 2008 as compared with 7.3-8.8 per cent in June 2008 and 5.1-6.2 per cent in November 2007 (Table 62). The higher order increase in consumer price inflation as compared to WPI inflation in recent months could be attributed to higher weight of food articles in CPIs and higher prices of food articles.
Asset Prices
VI.34 Domestic equity prices witnessed further corrections during the third quarter of 2008-09 in line with trends in major international financial markets, which fell due to the persistence of financial market turmoil following the US sub-prime crisis, and concerns about
Table 62: Consumer Price Inflation - Major Groups |
(Year-on-year variation in per cent) |
CPI Measure |
Weight |
Mar-06 |
Mar-07 |
Jun-07 |
Sep-07 |
Dec-07 |
Mar-08 |
Jun-08 |
Sep-08 |
Oct-08 |
Nov-08 |
Dec-08 |
1 |
2 |
3 |
4 |
5 |
6 |
7 |
8 |
9 |
10 |
11 |
12 |
13 |
CPI-IW (Base: 2001=100)# |
General |
100.0 |
4.9 |
6.7 |
5.7 |
6.4 |
5.5 |
7.9 |
7.7 |
9.8 |
10.4 |
10.4 |
– |
Food Group |
46.2 |
4.9 |
12.2 |
8.1 |
8.7 |
6.2 |
9.3 |
10.5 |
13.1 |
14.4 |
– |
– |
Pan, Supari etc. |
2.3 |
3.1 |
4.4 |
9.6 |
10.3 |
10.3 |
10.9 |
7.1 |
7.8 |
9.4 |
– |
– |
Fuel and Light |
6.4 |
-2.9 |
3.2 |
1.6 |
2.3 |
2.3 |
4.6 |
8.4 |
9.1 |
9.8 |
– |
– |
Housing |
15.3 |
6.6 |
4.1 |
4.1 |
4.0 |
4.0 |
4.7 |
4.7 |
3.8 |
3.8 |
– |
– |
Clothing, Bedding etc. |
6.6 |
3.0 |
3.7 |
4.4 |
5.3 |
3.5 |
2.6 |
2.5 |
2.5 |
3.4 |
– |
– |
Miscellaneous |
23.3 |
4.6 |
3.3 |
4.0 |
4.0 |
4.7 |
6.3 |
6.2 |
7.6 |
8.3 |
– |
– |
CPI-UNME (Base: 1984-85=100) |
General |
100.0 |
5.0 |
7.6 |
6.1 |
5.7 |
5.1 |
6.0 |
7.3 |
9.5 |
10.4 |
10.8 |
– |
Food Group |
47.1 |
5.3 |
10.9 |
7.7 |
7.7 |
6.2 |
7.8 |
9.6 |
13.2 |
15.2 |
15.7 |
– |
Fuel and Light |
5.5 |
1.9 |
6.4 |
7.2 |
7.0 |
5.4 |
4.6 |
5.3 |
6.2 |
6.8 |
6.7 |
– |
Housing |
16.4 |
5.5 |
5.6 |
5.6 |
4.9 |
4.7 |
4.0 |
3.8 |
3.5 |
3.5 |
3.5 |
– |
Clothing, Bedding etc. |
7.0 |
2.9 |
3.6 |
4.3 |
4.0 |
4.1 |
4.3 |
3.4 |
3.1 |
2.7 |
3.1 |
– |
Miscellaneous |
24.0 |
5.1 |
4.4 |
3.7 |
3.2 |
3.8 |
4.8 |
6.6 |
8.4 |
9.4 |
10.1 |
– |
CPI-AL (Base: 1986-87=100) |
General |
100.0 |
5.3 |
9.5 |
7.8 |
7.9 |
5.9 |
7.9 |
8.8 |
11.0 |
11.1 |
11.1 |
11.1 |
Food Group |
69.2 |
5.5 |
11.8 |
8.8 |
8.8 |
6.2 |
8.5 |
9.6 |
12.0 |
12.1 |
12.1 |
11.9 |
Pan, Supari etc. |
3.8 |
6.6 |
5.7 |
9.1 |
11.1 |
11.3 |
10.4 |
11.2 |
12.8 |
13.1 |
14.1 |
13.7 |
Fuel and Light |
8.4 |
4.3 |
6.9 |
7.4 |
7.2 |
6.3 |
8.0 |
8.9 |
10.2 |
10.9 |
11.1 |
11.3 |
Clothing, Bedding etc. |
7.0 |
2.2 |
3.5 |
2.7 |
1.9 |
1.3 |
1.8 |
3.1 |
6.0 |
6.8 |
7.0 |
7.0 |
Miscellaneous |
11.7 |
5.5 |
6.8 |
6.7 |
5.5 |
5.2 |
6.1 |
6.5 |
7.1 |
7.1 |
7.3 |
7.0 |
CPI-RL (Base: 1986-87=100) |
General |
100.0 |
5.3 |
9.2 |
7.5 |
7.6 |
5.6 |
7.6 |
8.7 |
11.0 |
11.1 |
11.1 |
11.1 |
Food Group |
66.8 |
5.8 |
11.5 |
8.5 |
8.8 |
6.2 |
8.2 |
9.6 |
12.0 |
12.4 |
12.4 |
11.9 |
Pan, Supari etc. |
3.7 |
6.3 |
5.7 |
9.3 |
11.6 |
11.5 |
10.6 |
10.9 |
12.5 |
13.0 |
13.8 |
13.4 |
Fuel and Light |
7.9 |
4.0 |
6.9 |
7.4 |
7.2 |
6.3 |
8.0 |
8.9 |
10.5 |
10.7 |
11.1 |
11.3 |
Clothing, Bedding etc. |
9.8 |
2.7 |
3.1 |
2.6 |
2.1 |
2.6 |
2.8 |
4.1 |
6.5 |
6.8 |
7.0 |
7.3 |
Miscellaneous |
11.9 |
5.2 |
6.3 |
6.2 |
5.3 |
5.0 |
6.2 |
6.8 |
7.4 |
7.4 |
7.6 |
7.5 |
Memo: |
|
|
|
|
|
|
|
|
|
|
|
|
WPI Inflation (End of period) |
|
4.1 |
5.9 |
4.4 |
3.4 |
3.8 |
7.7 |
12.0 |
12.1 |
10.7 |
8.0 |
5.9 |
GDP Deflator based Inflation* |
|
4.9 |
5.5 |
5.4 |
3.9 |
2.7 |
4.2 |
7.2 |
10.3 |
– |
– |
– |
#: Data prior to January 2006 are based on the old series (Base: 1982=100).
*: Data for March pertain to full year.
IW : Industrial Workers.
UNME : Urban Non-Manual Employees.
AL : Agricultural Labourers. RL : Rural Labourers. |
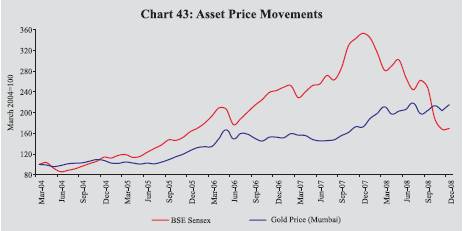
slowdown in the domestic economy (see Chapter V). Domestic gold prices, which had eased somewhat during the second quarter of 2008-09 mirroring movements in international prices, hardened subsequently to around Rs.12,897 per 10 grams in December 2008 in line with movements in international prices. International prices increased by over 7 per cent to around US $ 817 per ounce during November-December 2008 (Chart 43).
|
 IST,
IST,


