After reaching an intra-year peak of 12.9 per cent on August 02, 2008, inflation, as measured by year-on-year variations in WPI, fell sharply to 0.3 per cent on March 28, 2009. This large order of volatility in the inflation outcome in just one year is unprecedented. The sharp volatility in international commodity prices contributed significantly to the spiralling inflation in the first half, and then to the subsequent decline from a higher base at fast pace in the second half. When external and supply side factors condition the inflation trend along with demand pressures, demand management policy measures have to be employed in a calibrated manner. The surge that was witnessed in oil, food and commodity prices in the first half of 2008 had created testing conditions for the conduct of monetary policy. The sharp fall in inflation in the second half, however, has facilitated aggressive monetary easing, which aim at arresting the economic slowdown. Unlike the WPI based inflation, CPI based inflation in India, however, remains high, with recent evidence of very modest moderation, and the transmission process of lower inflation at the wholesale level to inflation at the retail level has emerged as an important issue in the conduct of Reserve Bank’s monetary policy.
VI.1 During the first half of 2008-09, headline inflation increased in major economies, reflecting the combined impact of higher food and fuel prices as well as strong demand conditions, especially in emerging markets. Subsequently, inflation decelerated sharply as international energy and commodity prices declined substantially and demand pressures eased following the impact of global financial crisis. The monetary policy stance pursued by most central banks in advanced economies during 2008-09 was largely expansionary, aimed at mitigating the adverse implications of the financial crisis. The central banks in emerging market economies were engaged in pre-emptive monetary tightening till September 2008 to contain inflation and inflationary expectations. Subsequently, they reversed their policy stance and reduced their policy rates as the spillover of the US subprime crisis turned out to be much wider and deeper, severely affecting growth prospects.
VI.2 In India, inflation as measured by year-on-year variations in the wholesale price index (WPI), increased sharply from 7.7 per cent at end-March 2008 to an intra-year peak of 12.9 per cent on August 2, 2008, reflecting the impact of some pass-through of higher international crude oil prices to domestic prices as well as continued increase in the prices of metals, chemicals, machinery and machinery tools, oilseeds/edible oils/oil cakes and raw cotton. Subsequently, WPI inflation declined sharply to 0.3 per cent as on March 28, 2009, led by the reductions in the administered prices of petroleum products and electricity as well as decline in the prices of freely priced petroleum products, oilseeds/edible oils/oil cakes, raw cotton, cotton textiles and iron & steel. The decline in prices of most of these commodities was in line with the decline in international commodity prices since July 2008. Consumer price inflation as reflected in various consumer price indices continued to remain high in the range of 9.6-10.8 per cent during January/February 2009 as compared with 7.3-8.8 per cent in June 2008 and 5.2-6.4 per cent in February 2008.
Global Inflation
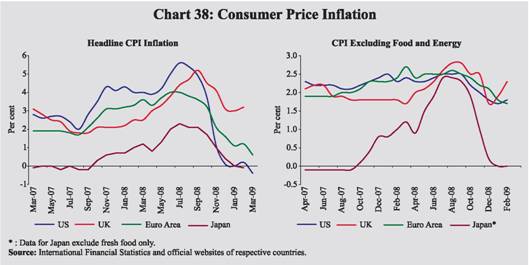
VI.3 Headline inflation in major advanced economies firmed up till the second quarter of 2008-09 on account of higher energy and food prices and declined subsequently. Consumer price index (CPI) inflation in OECD countries increased from 3.6 per cent in March 2008 to 4.9 per cent in July 2008 but declined sharply to 1.3 per cent by February 2009. The recent decline in inflation in OECD countries was led by a decline in inflation of energy and food articles. Amongst major economies, headline inflation in the US declined to (-) 0.4 per cent in March 2009 from 5.6 per cent in July 2008. In the UK, inflation declined to 3.2 per cent in February 2009 from 5.2 per cent in September 2008. In the Euro area, inflation came down to 0.6 per cent in March 2009 from 4.0 per cent in July 2008 (Chart 38). Core inflation also moderated, though modestly in major economies. In OECD countries, inflation, excluding food and energy, came down to 1.9 per cent in February 2009 from 2.4 per cent in September 2008 (2.1 per cent at March 2008). Producer price index (PPI) inflation also moderated in both advanced and emerging market economies (EMEs). PPI inflation in the OECD countries, which firmed up from 6.3 per cent in March 2008 to 9.8 per cent in July 2008 declined sharply to (-)1.0 per cent in February 2009. VI.4 According to the latest assessment of the US Federal Open Market Committee
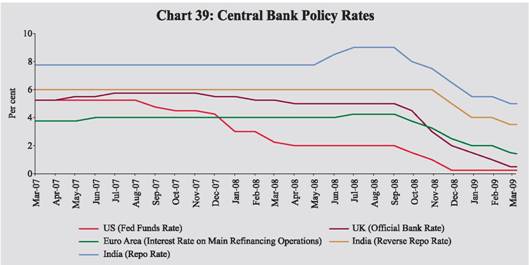
(FOMC) on March 18, 2009, in the light of increasing economic slackness in domestic and world economy, it was expected that inflation would remain subdued. Moreover, the Committee saw some risk that inflation rates could persist for a time below the levels that best foster economic growth and price stability in the longer term. However, the economy continued to contract. Furthermore, job losses, declining equity and housing wealth, and tight credit conditions weighed on consumer sentiment and spending. Against this backdrop, as the weak economic conditions warranted for exceptionally low levels of the federal funds rate (US policy rate), the FOMC kept the policy rate unchanged at a target range of 0.0-0.25 per cent since December 16, 2008. During 2008-09, the policy rate was reduced by a total of 200 basis points.
VI.5 According to the latest assessment of Monetary Policy Committee of the Bank of England, inflation is likely to fall below the 2 per cent target by the second half of 2009, reflecting diminishing contributions from retail energy and food prices and the impact of the temporary reduction in Value Added Tax. The committee viewed that there remains a substantial risk of undershooting the 2 per cent CPI inflation target in the medium term and that a further easing in monetary policy was warranted. Accordingly, the policy rate was reduced by 50 basis points to 0.5 per cent on March 5, 2009, taking the cumulative reduction to 475 basis points during 2008-09 (Table 61).
VI.6 According to the Governing Council of the ECB, inflation rates have decreased significantly and are expected to remain well below 2 per cent over 2009 and 2010 reflecting ongoing sluggish demand in Euro area and other countries. Accordingly, the ECB reduced the policy rate by 25 basis points to 1.25 per cent, effective April 8, 2009. Earlier, the ECB had cut the policy rate thrice by a total of 275 basis points since October 2008 to 1.50 per cent after raising it by 25 basis points in July 2008 (Chart 39).
VI.7 The Bank of Japan (BoJ), in its latest assessment on April 7, 2009, assessed that economic conditions have deteriorated significantly in Japan and are likely to continue deteriorating for the time being. Meanwhile, CPI inflation (excluding fresh food) has recently moderated reflecting the decline in the prices of petroleum products and the stabilisation of food prices. Furthermore, with increasing slackness evident in supply and demand conditions, CPI inflation rates are likely to become negative. Accordingly, the BoJ reduced its policy rate by 20 basis points each on October 31, 2008 and December 19, 2008 to 0.1 per cent. VI.8 The policy rates were also reduced by the Reserve Bank of Australia by a total of 400 basis points to 3.00 per cent; Bank of Canada by a total of 250 basis points 0.50 per cent; Sveriges Riksbank (Sweden) by 375 basis points to 1.0 per cent and Swiss National Bank by 275 basis points to 0.0-0.75 per cent since October 2008.
Table 61: Global Inflation Indicators |
(Per cent) |
Country/ Region |
Key Policy Rate |
Policy Rate
(As on
April 16, 2009) |
Changes in Policy Rates (basis points) |
CPI Inflation
(y-o-y) |
PPI Inflation (y-o-y) |
Real GDP Growth (y-o-y) |
2007-08 (Apr-Mar) |
Since end-March 2008 |
Mar. 2008 |
Mar. 2009 |
Feb. 2008 |
Feb. 2009 |
2007 (Q4) |
2008 (Q4) |
1 |
2 |
3 |
4 |
5 |
6 |
7 |
8 |
9 |
10 |
11 |
Developed Economies |
|
|
|
|
|
|
|
|
|
Australia |
Cash Rate |
3.00 (Apr.8, 2009) |
100 |
(-) 425 |
3.0^ |
3.7^ |
2.8^ |
6.4^ |
3.9 |
0.3 |
Canada |
Overnight Rate |
0.50 (Mar. 3, 2009) |
(-)75 |
(-) 300 |
1.8 * |
1.4 * |
-0.4 |
1.6 |
2.9 |
-0.7 |
Euro area |
Interest Rate on Main Refinancing Operations |
1.25 (Apr. 8, 2009) |
25 |
(-) 275 |
3.6 |
0.6 |
5.3 |
-1.8 |
2.2 |
-1.3 |
Japan |
Uncollateralised Overnight Call Rate |
0.10 (Dec.19, 2008) |
0 |
(-) 40 |
1.0* |
-0.1* |
3.6 |
-1.1 |
2.0 |
-4.3 |
UK |
Official Bank Rate |
0.50 (Mar. 5, 2009) |
0 |
(-) 475 |
2.5* |
3.2* |
5.7 |
3.1 |
2.9 |
-2.0 |
US |
Federal Funds Rate |
0.00 to 0.25
(Dec.16, 2008) |
(-)300 |
(-) 200 |
4.0 |
-0.4 |
6.4 |
-1.3 |
2.3 |
-0.8 |
Developing Economies |
|
|
|
|
|
|
|
|
|
Brazil |
Selic Rate |
11.25 (Mar. 12, 2009) |
(-)150 |
0 |
4.7 |
5.6 |
10.6 |
7.4 |
6.2 |
1.3 |
India |
Reverse Repo Rate |
3.50 (Mar. 4, 2009) |
0 |
(-) 250 |
5.5* |
9.6* |
7.7# |
0.3# |
8.9 |
5.3 |
| |
Repo Rate |
5.00 (Mar. 4, 2009) |
0 |
(-) 275 |
|
|
|
|
|
|
| |
|
|
(150) |
(-250) |
|
|
|
|
|
|
China |
Benchmark 1-year |
5.31 (Dec. 23, 2008) |
108 |
(-) 216 |
8.7* |
-1.6* |
6.6 |
-4.5 |
11.2 |
6.8 |
| |
Lending Rate |
|
(550) |
(- 300) |
|
|
|
|
|
|
Indonesia |
Bank Indonesia Rate |
7.50 (Apr.3, 2009) |
(-) 100 |
(-) 50 |
6.3 |
7.9 |
23.8 |
7.9 |
6.3 |
5.2 |
Israel |
Key Rate |
0.50 (Apr.1, 2009) |
(-) 25 |
(-) 325 |
3.7 |
3.6 |
10.7 |
-4.5 |
6.8 |
1.2 |
Korea |
Base Rate** |
2.00 (Feb 12, 2009) |
50 |
(-) 300 |
3.9 |
3.9 |
6.6 |
5.2 |
5.5 |
-3.4 |
Philippines |
Reverse Repo Rate |
4.50 (Apr. 16, 2009) |
(-) 250 |
(-) 50 |
6.4 |
6.4 |
-0.8 |
2.7 |
7.3 |
4.5 |
Russia |
Refinancing Rate |
13.00 (Dec.1, 2008) |
(-) 25 |
275 |
13.3 |
14.0 |
25.7 |
-8.2 |
7.7 |
1.1 |
South Africa |
Repo Rate |
9.50 (Mar. 25, 2009) |
200 |
(-) 150 |
9.8* |
8.6* |
11.3 |
7.3 |
4.6 |
1.0 |
Thailand |
1-day Repurchase Rate |
1.25 (Apr. 8, 2009) |
(-) 125 |
(-) 200 |
5.3 |
-0.2 |
11.1# |
-4.0# |
5.7 |
-4.3 |
^ : Q4. *: February. # : March.
** : Since March 2008, the policy rate has been changed from overnight call rate to ‘the Bank of Korea Rate or (Base Rate)’ and
fixed at the same level as the current call rate target of 5.0 per cent on March 7, 2008.
Note : 1. For India, data on inflation pertain to CPI for Industrial Workers.
2. Figures in parentheses in column (3) indicate the dates when the policy rates were last revised.
3. Figures in parentheses in columns (5) and (6) indicate the variation in the cash reserve ratios during the period.
4. Data for India and Indonesia pertains to WPI in columns (8) and (9).
Source: International Monetary Fund, websites of respective central banks and The Economist. |
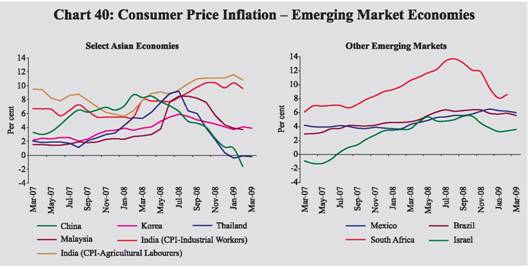
VI.9 Among the major emerging economies, consumer price inflation in China declined sharply from 8.3 per cent in March 2008 to a negative 1.6 per cent in February 2009 (Chart 40). The Peoples Bank of China (PBC) reduced the benchmark 1-year lending rate by a total of 216 basis points to 5.31 per cent and cash reserve ratio (CRR) by a total of 300 basis points (400 basis points for small and medium-sized depository financial institutions) since September 2008 to facilitate continued, stable and fast development of the national economy.
 VI.10 The Bank of Korea reduced its policy rate by a total of 325 basis points since October 2008 to 2.0 per cent. In Thailand, the monetary policy committee (MPC) viewed that risks to economic growth increased while inflation was expected to decline further. It has reduced the policy rate by a total of 250 basis points since December 2008 to 1.25 per cent. The Bank Indonesia reduced its policy rate by a total of 200 basis points since December 2008 to 7.50 per cent to reinforce the domestic economy, macroeconomic stability and financial system.
VI.11 Amongst the key macroeconomic indicators in select EMEs, consumer price inflation was in the range of (-)1.6 per cent to 14.0 per cent in February/March 2009. Real policy rates ranged between (-)4.6 and 6.9 per cent in March 2009 (Table 62). The real effective exchange rate (REER) for the select EMEs, barring the currency of China, underwent real depreciation, on a year-on-year basis, in March 2009.
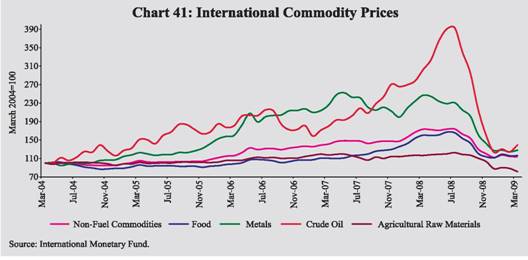
Global Commodity Prices VI.12 During 2008-09, international commodity prices recorded very high level of volatility. International commodity prices witnessed sharp increases up to July 2008 on account of substantial increases in oil, food and metal prices but declined significantly thereafter. The decline in global commodity prices have been led by sharp fall in price of crude oil, metals as well as agricultural commodities. The global commodity prices have, however, remained broadly stable since December 2008 (Table 63 and Chart 41).
Table 62: Key Macroeconomic Indicators: Emerging Markets |
(Per cent) |
Country |
Consumer Price Inflation |
Real Effective Exchange Rate (REER) |
Central Govt. Fiscal Balance (per cent of GDP) |
Real Policy Rate |
Real GDP Growth |
| |
Mar. 2008 |
Mar. 2009 |
Mar. 2008 |
Mar. 2009 |
2007 |
2008 |
Mar. 2008 |
Mar. 2009 |
2007 |
2008 |
1 |
2 |
3 |
4 |
5 |
6 |
7 |
8 |
9 |
10 |
11 |
Brazil |
4.7 |
5.6 |
12.9 |
-14.0 |
-2.3 |
-1.5 |
6.6 |
5.7 |
5.7 |
5.8 |
China |
8.7* |
-1.6 * |
4.7 |
14.5 |
1.0 |
0.8 |
-0.8 |
6.9 |
13.0 |
9.0 |
India |
5.5* |
9.6 * |
5.0 |
-11.5 |
-2.7 |
-6.0 @ |
-0.2 |
-4.6 |
9.0 |
7.1 |
| |
(7.7) |
(0.3) |
|
|
(60.1) |
(57.8) |
(0.0) |
(4.7) |
|
|
Indonesia |
6.3 |
7.9 |
-6.2 |
-9.7 |
-1.6 |
-1.1 |
1.7 |
-0.2 |
6.3 |
6.1 |
Israel |
3.7 |
3.6 |
9.0 |
-2.2 |
-0.8 |
-1.9 |
0.0 |
-2.9 |
5.4 |
4.3 |
Korea |
3.9 |
3.9 |
-13.7 |
-24.9 |
-1.5 |
-1.1 |
1.1 |
-1.9 |
5.0 |
4.1 |
Philippines |
6.4 |
6.4 |
10.0 |
-1.6 |
-0.2 |
-1.0 |
-1.4 |
-1.7 |
7.2 |
4.4 |
Russia |
13.3 |
14.0 |
5.5 |
-9.8 |
6.2 |
6.1 |
-3.1 |
-1.0 |
8.1 |
6.2 |
South Africa |
9.8 * |
8.6* |
-12.1 |
-1.1 |
2.0** |
2.8 ** |
0.4 |
1.9 |
5.1 |
3.1 |
Thailand |
5.3 |
-0.2 |
2.4 |
-4.8 |
-1.7 |
-1.8 |
-2.1 |
1.7 |
4.8 |
4.7 |
* : February. @ : Revised estimates. ** : Africa.
Note: 1. For India, data pertain to fiscal years 2007-08 and 2008-09.
2. Consumer price inflation data are on a year-on-year basis. Data for India are for CPI-Industrial Workers.
3. Real policy rate is the policy rate less year-on-year consumer price inflation. For India, repo rate is used.
4. Figures in parentheses in columns (2) and (3) refer to wholesale price inflation.
5. Data on fiscal balance for Israel pertain to general government balance.
6. Figures in parentheses in columns (6) and (7) refer to central government debt/GDP ratio.
7. Figures in parentheses in columns (8) and (9) for India are based on wholesale price inflation.
8. Data on REER refer to year-on-year variation in broad indices (CPI-based) compiled by the Bank for International
Settlements. A positive figure indicates appreciation while a negative figure indicates depreciation. For India,
data are based on movements in 6-currency indices and pertain to February.
Source: International Monetary Fund; Asian Development Bank; Bank for International Settlements; World Bank, The Economist and official websites of respective central banks. |
Table 63: International Commodity Prices |
Commodity |
Unit |
2004 Market Price |
Index (2004=100) |
Variation (Per cent) |
2005 |
2006 |
2007 |
Mar. 2008 |
Jun. 2008 |
Sep. 2008 |
Dec. 2008 |
Mar. 2009 |
Mar. 09/ Mar. 08 |
Mar. 09/ Jul. 08 |
1 |
2 |
3 |
4 |
5 |
6 |
7 |
8 |
9 |
10 |
11 |
12 |
13 |
Energy |
|
|
|
|
|
|
|
|
|
|
|
|
Coal |
$/mt |
53.0 |
90 |
93 |
124 |
223 |
302 |
283 |
149 |
115 |
-48.4 |
-66.1 |
Crude oil (Average) |
$/bbl |
37.7 |
142 |
170 |
188 |
270 |
349 |
264 |
110 |
124 |
-54.2 |
-64.9 |
Non-Energy Commodities |
|
|
|
|
|
|
|
|
|
|
|
|
Palm oil |
$/mt |
471.3 |
90 |
101 |
165 |
265 |
257 |
164 |
107 |
127 |
-52.2 |
-47.1 |
Soybean oil |
$/mt |
616.0 |
88 |
97 |
143 |
240 |
250 |
199 |
120 |
118 |
-50.9 |
-52.0 |
Soybeans |
$/mt |
306.5 |
90 |
88 |
125 |
188 |
203 |
166 |
117 |
123 |
-34.3 |
-40.4 |
Rice |
$/mt |
237.7 |
120 |
128 |
137 |
250 |
318 |
288 |
224 |
247 |
-1.0 |
-19.6 |
Wheat |
$/mt |
156.9 |
97 |
122 |
163 |
280 |
222 |
188 |
140 |
147 |
-47.5 |
-29.6 |
Maize |
$/mt |
111.8 |
88 |
109 |
146 |
210 |
257 |
209 |
142 |
147 |
-29.8 |
-38.0 |
Sugar |
c/kg |
15.8 |
138 |
206 |
141 |
184 |
169 |
189 |
164 |
187 |
1.5 |
-5.8 |
Cotton A Index |
c/kg |
136.6 |
89 |
93 |
102 |
129 |
124 |
119 |
90 |
83 |
-35.8 |
-33.4 |
Aluminium |
$/mt |
1716.0 |
111 |
150 |
154 |
175 |
172 |
147 |
87 |
78 |
-55.5 |
-56.5 |
Copper |
$/mt |
2866.0 |
128 |
235 |
248 |
294 |
288 |
244 |
107 |
131 |
-55.6 |
-55.4 |
Gold |
$/toz |
409.2 |
109 |
148 |
170 |
237 |
217 |
203 |
199 |
226 |
-4.6 |
-1.6 |
Silver |
c/toz |
669.0 |
110 |
173 |
200 |
287 |
255 |
182 |
154 |
196 |
-31.8 |
-27.4 |
Steel cold-rolled coilsheet |
$/mt |
607.1 |
121 |
114 |
107 |
132 |
181 |
181 |
181 |
148 |
12.5 |
-18.2 |
Steel hot-rolled coilsheet |
$/mt |
502.5 |
126 |
119 |
109 |
149 |
199 |
199 |
199 |
159 |
6.7 |
-20.0 |
Tin |
c/kg |
851.3 |
87 |
103 |
171 |
233 |
261 |
216 |
132 |
125 |
-46.1 |
-53.9 |
Zinc |
c/kg |
104.8 |
132 |
313 |
309 |
240 |
181 |
166 |
105 |
116 |
-51.5 |
-34.3 |
$: US dollar. c: US cent. bbl: barrel. mt: metric tonne. kg: Kilogram. toz: troy oz. Source: Based on World Bank’s actual commodity price data. The year 2004 has been taken as the base to better exhibit price trends over the relevant period. |
VI.13 International crude oil prices, represented by the West Texas Intermediate (WTI), increased sharply and reached a historical peak of US $ 145.3 per barrel on July 3, 2008, reflecting tight supply-demand balance, geopolitical tensions, weakening of the US dollar against major currencies and increased interest from investors and financial market participants. Subsequently, the WTI crude oil prices declined precipitously to US $ 39.2 per barrel in February 2009, reflecting falling demand in the Organisation for Economic Co-operation and Development (OECD) countries as well as some developing countries, notably in Asia, following the economic slowdown (Table 64). Subsequently, WTI crude oil prices firmed up to US$ 50.0 per barrel on April 16, 2009.
VI.14 The latest meeting of OPEC on March 15, 2009 projected a decline in world demand for oil by 1 million barrel per day during 2009, indicating that the prices would remain stable at the current level. According to the US Energy Information Administration (EIA), sustainability of recent increase in world oil prices will largely depend upon the timing and pace of the recovery of the global economy. If global economic recovery begins earlier and is stronger, there is an upside risk of even higher oil prices from the current level. Assuming no major crude oil supply disruptions, average WTI prices are expected to be US$ 52.6 per barrel in 2009, which is 47 per cent lower than the average price for the year 2008 (US$ 99.6 per barrel). In view of the relatively tight demand supply-balance over the long run, the long term outlook for oil, however, remains highly uncertain (Table 65).
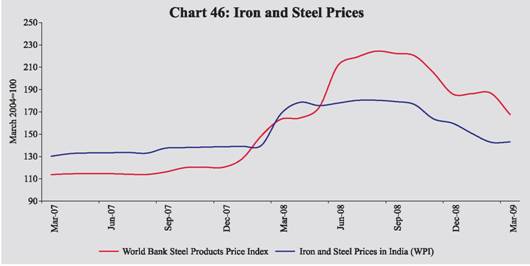
VI.15 Iron and steel prices increased sharply up to August 2008, reflecting increasing demand from emerging economies, especially China. Between March and August 2008, the World Bank steel price product index increased by 37 per cent. International steel prices, however, declined by about 25 per cent since August 2008 as global economic downturn has led to lower prospects for construction activity and investment in capital equipment. Non-ferrous metal prices eased in 2008-09, reflecting weak demand in OECD countries and some improvement in supply. The IMF metals price index (which includes copper, aluminum, iron ore, tin, nickel, zinc, lead, and uranium price indices) declined by 48.2 per cent year-on-year, in March 2009.
Table 64: International Crude Oil Prices |
(US dollars per barrel) |
Year/Month |
Dubai Crude |
UK Brent |
US WTI |
Average Crude Price |
Indian Basket Price |
1 |
2 |
3 |
4 |
5 |
6 |
2004-05 |
36.4 |
42.2 |
45.0 |
41.3 |
38.9 |
2005-06 |
53.4 |
58.0 |
59.9 |
57.1 |
55.4 |
2006-07 |
60.9 |
64.4 |
64.7 |
63.3 |
62.4 |
2007-08 |
77.3 |
82.4 |
82.3 |
80.7 |
79.2 |
March 2008 |
96.8 |
103.3 |
105.5 |
101.8 |
99.4 |
June 2008 |
127.6 |
133.1 |
133.9 |
131.5 |
129.8 |
July 2008 |
131.2 |
133.9 |
133.4 |
132.8 |
132.3 |
August 2008 |
113.2 |
113.9 |
116.6 |
114.6 |
113.5 |
September 2008 |
96.0 |
99.1 |
103.9 |
99.7 |
97.1 |
December 2008 |
41.0 |
41.6 |
41.4 |
41.3 |
41.2 |
January 2009 |
45.0 |
44.9 |
41.7 |
43.9 |
44.9 |
February 2009 |
43.1 |
43.2 |
39.2 |
41.8 |
43.2 |
March 2009 |
45.6 |
46.8 |
47.5 |
46.6 |
46.1 |
Source : International Monetary Fund and the World Bank. |
Table 65: World Supply-Demand Balance of Oil |
(Million barrels per day) |
Item |
2007 |
2008 |
2009 (P) |
2009 |
Q1 |
Q2(P) |
Q3(P) |
Q4(P) |
1 |
2 |
3 |
4 |
5 |
6 |
7 |
8 |
Demand |
|
|
|
|
|
|
|
1. OECD |
49.1 |
47.3 |
45.7 |
46.4 |
44.7 |
45.2 |
46.7 |
2. Non-OECD |
36.8 |
38.1 |
38.4 |
37.3 |
38.4 |
38.6 |
39.1 |
of which: China |
7.6 |
7.9 |
8.0 |
7.5 |
8.0 |
8.2 |
8.4 |
3. Total (1+2) |
85.9 |
85.4 |
84.1 |
83.7 |
83.1 |
83.8 |
85.8 |
Supply |
|
|
|
|
|
|
|
4. OPEC |
34.4 |
35.7 |
33.7 |
33.0 |
33.4 |
33.8 |
34.4 |
5. Non-OPEC |
50.0 |
49.8 |
49.8 |
49.6 |
49.9 |
49.8 |
49.8 |
6. Total (4+5) |
84.4 |
85.5 |
83.4 |
82.6 |
83.3 |
83.6 |
84.1 |
Stock Changes |
-1.5 |
0.1 |
-0.7 |
-1.0 |
0.2 |
-0.2 |
-1.7 |
P: Projections.
Source: US Energy Information Administration. |
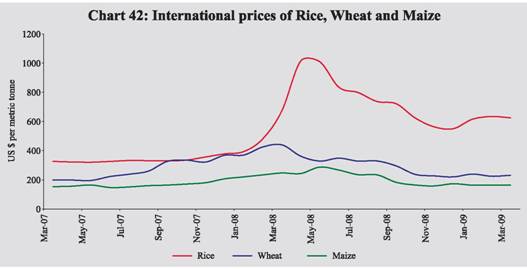
VI.16 Food prices continued to increase sharply in the first quarter of 2008-09 led by rice, maize and oilseeds/edible oils prices, reflecting surging demand (both consumption demand and demand for nonfood uses such as bio-fuels production) and low stocks of major crops. Food prices, however, eased significantly since the second quarter of the year on the back of improved supply prospects, particularly for oilseeds and grains in major producing countries. The World Bank’s food price index declined by about 32 per cent year-on-year by March 2009, led by edible oils, rice, maize and wheat (Chart 42). According to the March 2009 projections of US Department of Agriculture, global wheat and rice production are projected to increase by about 12 per cent and 2 per cent, respectively, during 2008-09 crop season to 682 million metric tonnes and 441 million metric tonnes. Similarly, global supplies of oilseeds are also expected to increase by about 3 per cent during 2008-09 crop season. However, according to the Food and Agriculture Organisation (FAO), early indications for the year 2009 point to a reduction in cereal output.
 VI.17 International sugar prices have remained volatile during 2008-09 and the price level in February 2009 was almost the same as at end-March 2008. Since December 2008, international sugar prices rose by 14 per cent on expectations that India will become a net importer due to downward revision in its crop size and expectations of lower crops in the EU, US, China and Australia. Global cotton prices, have also been volatile during August 2008. World cotton prices (represented by the ‘Cotton A Index’) have declined by 34 per cent since August 2008. However, according to the International Cotton Advisory Committee (ICAC), world cotton production is expected to decline for the third consecutive season during 2009-10 and prices are projected to increase by 5 per cent.
Inflation Conditions in India
VI.18 The Annual Policy Statement for 2008-09 (April 2008) of the Reserve Bank was announced on the background of elevated inflation levels, and the Policy Statement reaffirmed its resolve to bring down inflation to around 5.5 per cent in 2008-09 with a preference for bringing it as close to 5.0 per cent as soon as possible, recognising the evolving complexities in globally transmitted inflation. As the potential inflationary pressures from international food and energy prices had amplified, the policy focused on conditioning perceptions for inflation in the range of 4.0-4.5 per cent so that an inflation rate of around 3.0 per cent became a medium-term objective consistent with India’s broader integration into the global economy and with the goal of maintaining self-accelerating growth over the medium-term.
VI.19 Inflation hardened during the first quarter of 2008-09 on account of strong demand and significant international commodity price pressures. Therefore, it was recognised that an adjustment of overall aggregate demand on an economy-wide basis was warranted to ensure that generalised instability did not develop and erode the hard-earned gains in terms of both outcomes of and positive sentiments on India’s growth momentum. The priority for monetary policy was identified to be eschewing any further intensification of inflationary pressures and to firmly anchor inflation expectations. Accordingly, the Reserve Bank increased the cash reserve ratio (CRR) by a total of 100 basis points between May and July 2008 to 8.75 per cent. Furthermore, the repo rate under the Liquidity Adjustment Facility (LAF) was increased by a total of 75 basis points to 8.50 per cent in June 2008. The First Quarter Review of the Annual Statement on Monetary Policy for 2008-09 expected that inflation would moderate from then prevailing high levels in the months to come. In view of the prevailing macroeconomic, liquidity and overall monetary conditions, the First Quarter Review announced an increase in the fixed repo rate under the LAF by 50 basis points from 8.5 per cent to 9.0 per cent with effect from July 30, 2008 and an increase in the CRR by 25 basis points to 9.0 per cent with effect from August 30, 2008 (Table 66).
VI.20 WPI inflation started to decline since August 2008, mainly on account of decline in prices of freely priced petroleum products, edible oils and textiles. The MidTerm Review of Annual Policy for the Year 2008-09 observed that in the absence of further shocks, generalised inflation could not be sustained, especially with money supply contained at the average rate of 2003-08, a period when inflation was low and stable. The Review also noted that the effect of softening international commodity prices on inflation in India could be muted just as the elevation of international commodity prices was not fully passed on to domestic prices. The challenge for the setting of monetary policy was identified to be balancing the costs of lowering inflation in terms of output volatility (particularly in the context of the moderation in industrial and services sector activity) against the risk of then prevailing levels of inflation persisting and getting embedded in inflation expectations. The review highlighted the importance of remaining focused on bringing inflation down to levels that are compatible with a strong but stable momentum of growth in the economy and financial stability while recognising that there existed high level of uncertainty with this judgment. VI.21 Since September 2008, the Reserve Bank adjusted its policy stance from demand management to arresting the moderation in growth, as India’s growth trajectory has been impacted both by the financial crisis and the global economic downturn. Accordingly, between September 2008 and January 2009, the Reserve Bank reduced the repo rate under the LAF from 9.0 per cent to 5.5 per cent, the reverse repo rate under the LAF from 6.0 per cent to 4.0 per cent and the CRR from 9.0 per cent to 5.0 per cent. The aim of these measures was to augment domestic liquidity and to ensure that credit continues to flow to productive sectors of the economy. The Third Quarter Review of the Annual Statement on Monetary Policy for 2008-09 assessed that the
inflation rate was expected to moderate further in the last quarter of 2008-09. Keeping in view the global trend in commodity prices and the domestic demand-supply balance, WPI inflation was projected to decelerate to below 3.0 per cent by end-March 2009 from then prevailing level of 5.6 per cent. The review also noted that the consumer price inflation was yet to moderate and the decline in inflation expectations had not been commensurate with the sharp fall in WPI inflation. It recognised that the headline WPI inflation could fall below 3 per cent in the short-run partly because of statistical reason of high base since early 2008 mainly caused by exceptionally high global oil and commodity prices. It affirmed that with the policy endeavour of ensuring price stability with well-anchored inflation expectations, the Reserve Bank would take into account the behaviour of all the price indices and their components.
Table 66: Movements in Key Policy Rates in India |
(Per cent) |
Effective since |
Reverse Repo Rate |
Repo Rate |
Cash Reserve Ratio |
WPI Inflation |
CPI (IW) Inflation |
1 |
2 |
3 |
4 |
5 |
6 |
June 9, 2006 |
5.75 (+0.25) |
6.75 (+0.25) |
5.00 |
4.9 |
7.7 |
July 25, 2006 |
6.00 (+0.25) |
7.00 (+0.25) |
5.00 |
4.7 |
6.7 |
October 31, 2006 |
6.00 |
7.25 (+0.25) |
5.00 |
5.4 |
7.3 |
December 23, 2006 |
6.00 |
7.25 |
5.25 (+0.25) |
5.8 |
6.9 |
January 6, 2007 |
6.00 |
7.25 |
5.50 (+0.25) |
6.4 |
6.7 |
January 31, 2007 |
6.00 |
7.50 (+0.25) |
5.50 |
6.7 |
6.7 |
February 17, 2007 |
6.00 |
7.50 |
5.75 (+0.25) |
6.0 |
7.6 |
March 3, 2007 |
6.00 |
7.50 |
6.00 (+0.25) |
6.5 |
6.7 |
March 31, 2007 |
6.00 |
7.75 (+0.25) |
6.00 |
5.9 |
6.7 |
April 14, 2007 |
6.00 |
7.75 |
6.25 (+0.25) |
6.3 |
6.7 |
April 28, 2007 |
6.00 |
7.75 |
6.50 (+0.25) |
6.0 |
6.7 |
August 4, 2007 |
6.00 |
7.75 |
7.00 (+0.50) |
4.4 |
7.3 |
November 10, 2007 |
6.00 |
7.75 |
7.50 (+0.50) |
3.2 |
5.5 |
April 26, 2008 |
6.00 |
7.75 |
7.75 (+0.25) |
8.3 |
7.8 |
May 10,2008 |
6.00 |
7.75 |
8.00 (+0.25) |
8.6 |
7.8 |
May 24,2008 |
6.00 |
7.75 |
8.25 (+0.25) |
8.9 |
7.8 |
June 12, 2008 |
6.00 |
8.00 (+0.25) |
8.25 |
11.7 |
7.7 |
June 25, 2008 |
6.00 |
8.50 (+0.50) |
8.25 |
11.9 |
7.7 |
July 5, 2008 |
6.00 |
8.50 |
8.50 (+0.25) |
12.2 |
8.3 |
July 19, 2008 |
6.00 |
8.50 |
8.75 (+0.25) |
12.5 |
8.3 |
July 30, 2008 |
6.00 |
9.00 (+0.50) |
8.75 |
12.5 |
8.3 |
August 30, 2008 |
6.00 |
9.00 |
9.00 (+0.25) |
12.4 |
9.0 |
October 11, 2008 |
6.00 |
9.00 |
6.50 (-2.50) |
11.3 |
10.4 |
October 20, 2008 |
6.00 |
8.00 (-1.00) |
6.50 |
10.8 |
10.4 |
October 25, 2008 |
6.00 |
8.00 |
6.00 (-0.50) |
10.7 |
10.4 |
November 3, 2008 |
6.00 |
7.50 (-0.50) |
6.00 |
8.7 |
10.4 |
November 8, 2008 |
6.00 |
7.50 |
5.50 (-0.50) |
8.7 |
10.4 |
December 8, 2008 |
5.00 (-1.00) |
6.50 (-1.00) |
5.50 |
6.6 |
9.7 |
January 5, 2009 |
4.00 (-1.00) |
5.50 (-1.00) |
5.50 |
5.3 |
10.4 |
January 17, 2009 |
4.00 |
5.50 |
5.00 (-0.50) |
4.9 |
10.4 |
March 4, 2009 |
3.50 (-0.50) |
5.00 (-0.50) |
5.00 |
2.4 |
- |
Note: 1. With effect from October 29, 2004, the nomenclature of repo and reverse repo was changed in keeping with international usage. Now, reverse repo indicates absorption of liquidity and repo signifies injection of liquidity. Prior to October 29, 2004, repo indicated absorption of liquidity, while reverse repo meant injection of liquidity. 2. Figures in parentheses indicate change in policy rates. |
VI.22 As the global financial and economic conditions further deteriorated since the Third Quarter Review and the impact on India’s growth trajectory has turned out to be deeper and wider than anticipated earlier, the Reserve Bank further announced monetary stimulus measures in terms of reduction in the repo rate under the LAF from 5.5 per cent to 5.0 per cent, the reverse repo rate under the LAF from 4.0 per cent to 3.5 per cent on March 4, 2009.
Wholesale Price Inflation
VI.23 During 2008-09, inflation in India, based on the wholesale price index (WPI) firmed up to an intra-year peak of 12.9 per cent on August 2, 2008 from 7.7 per cent at end-March 2008. The increase in inflation during March-August 2008 was mainly on account of some pass-through of high international crude oil prices to domestic prices as well as elevated levels of prices of iron and steel, basic heavy inorganic chemicals, machinery and machine tools, oilseeds/oil cakes, raw cotton and textiles. The increase in inflation during this period reflected strong demand pressures as well as international commodity price pressures.
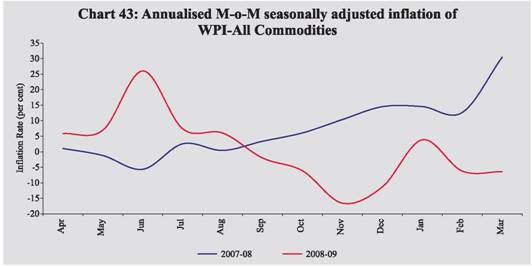
VI.24 WPI inflation exhibited strong downward trend since August 2008 and reached 0.3 per cent as on March 28, 2009. Between August 2, 2008 and March 28, 2009, WPI declined by 5.8 per cent driven by the reduction in the administered prices of petroleum products and electricity as well as decline in prices of freely priced minerals oil items, iron and steel, oilseeds, edible oils, oil cakes and raw cotton (Table 67). Significant part of the end year reduction in WPI inflation could also be attributed to the base effect reflecting the rapid increase in inflation recorded during the last quarter of 2007-08. VI.25 The inflation momentum, as indicated by the movement of the annualised month-over-month (M-o-M) seasonally adjusted WPI inflation, was declining since June 2008 and entered negative territory in September 2008 itself. Thereafter, it maintained a strong and secular disinflationary momentum till November 2008 and was reversed in January 2009. According to the latest data available, annualised WPI (seasonally adjusted) inflation for the month ended March 2009 remains in the negative territory (Chart 43). It may be noted that
though M-o-M seasonally adjusted inflation is a useful indicator of inflationary conditions, it tends to be volatile.
Table 67: Key Commodity Prices – Global vis-à-vis Domestic (year-on-year) |
(Per cent) |
Item |
Annual Inflation |
Recent trends |
Global |
India |
Global |
India |
Mar. 2009 over Mar. 2008 |
Inflation* |
Mar. 2009 over July 2008 |
Mar.28, 2009 over Aug. 2, 2008 |
1 |
2 |
3 |
4 |
5 |
1. |
Rice |
-1.0 |
12.8 |
-19.6 |
11.4 |
2. |
Wheat |
-47.5 |
5.2 |
-29.6 |
2.8 |
3. |
Milk |
.. |
6.1 |
.. |
3.9 |
4. |
Raw Cotton |
-35.8 |
2.5 |
-33.4 |
-17.6 |
5. |
Oilseeds |
-34.3 |
-2.3 |
-40.4 |
-8.7 |
6. |
Iron Ore |
0.0 |
-16.8 |
0.0 |
-17.1 |
7. |
Coal mining |
-48.4 |
-1.0 |
-66.1 |
-1.0 |
8. |
Minerals Oil |
-54.2 |
-8.7 |
-64.9 |
-23.3 |
9. |
Edible Oils |
-(51-52) |
-10.2 |
-(47-52) |
-11.5 |
10. |
Oil Cakes |
-22.6 |
19.4 |
-32.5 |
-0.3 |
11. |
Basic Heavy Inorganic Chemicals |
.. |
-13.7 |
.. |
-20.9 |
12. |
Basic Metals, Alloys and Products |
-48.2 # |
-12.2 |
-44.6 # |
-14.7 |
| |
- Iron and Steel |
2.7 |
-18.4 |
-23.5 |
-20.6 |
* :Based on WPI as on March 28, 2009.
# :Represented by IMF metals price index, which covers copper, aluminium, iron ore, tin, nickel, zinc, lead and uranium.
Note:1. Global price increases are based on the World Bank and IMF primary commodity prices data.
2. International edible oils prices are represented by palm oil and soybean oil. |
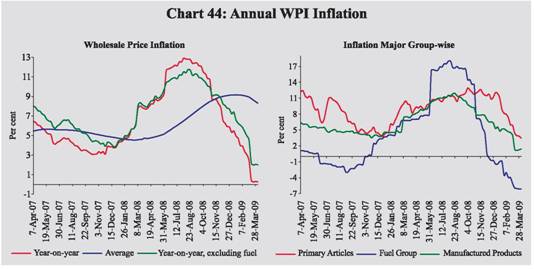
 VI.26 At a disaggregated level, the y-o-y inflation, excluding fuel, was at 2.0 per cent as on March 28, 2009 as compared with 8.0 per cent a year ago. It can be observed that during the period June-October 2008, when WPI inflation was at substantially high levels, overall inflation was higher than the WPI excluding fuel inflation. Since October 2008 the overall inflation has been lower than the inflation excluding fuel with some convergence being observed in recent months (Chart 44). The annual average WPI inflation rate (average of 52 weeks) increased to 8.3 per cent as on March 28, 2009 from 5.7 per cent at end-June 2008 and 4.7 per cent at end-March 2008.
VI.27 Amongst major groups, primary articles inflation, y-o-y, increased from 9.7 per cent at end-March 2008 to a peak of 12.7 per cent on November 15, 2008. This mainly reflected increase in the prices of food articles as well as non-food articles. The volatility in prices of food articles was of substantially lower magnitude in contrast with sharp increase in international prices of food during the first half of 2008. The y-o-y increase in primary food articles’ prices was 6.4 per cent in July 2008 as against 41.2 per cent increase in IMF food price index during the same period. This could be attributed to the various supply-side measures undertaken by the Government as well as improved domestic supply prospects. Some of the non-food articles such as oilseeds and raw cotton also witnessed increase in prices during this period largely on account of elevated global prices. Raw cotton prices increased by 24 per cent between March and September 2008 reflecting estimated lower domestic production (down by 14.3 per cent as per the Second Advance Estimates for 2008-09) as well as higher exports on the back of firm international prices. VI.28 Primary articles inflation, however, eased substantially since January 2009 and reached 3.5 per cent as on March 28, 2009 as prices declined in the case of food articles, especially vegetables and fruits and non-food articles like raw cotton, oilseeds and minerals. While the decline in prices of food articles partly reflected the improved rabi crops during 2008-09 as well as seasonal pattern, the decline in nonfood primary articles prices was largely driven by decline in international prices of cotton, oilseeds and minerals. Despite some recent easing, rice and pulses prices continue to be at elevated levels.
 VI.29 As international crude oil prices shot up during the first half of 2008-09, fuel group inflation, increased to an intra-year peak of 18.0 per cent on August 2, 2008 from 6.8 per cent at end-March 2008. This was driven by increase in the prices of mineral oils reflecting the effect of the hikes in the prices of petrol (Rs.5 per litre), diesel (Rs.3 per litre) and LPG (Rs.50 per cylinder) on June 4, 2008 as well as increase in the prices of freely priced petroleum products.
VI.30 International crude oil prices started to decline since July 2008, and domestic prices of freely priced petroleum products followed the trends in international prices and declined substantially. Among the various freely priced petroleum products, prices declined by about 66 per cent in case of aviation turbine fuel (beginning the first week of September 2008), about 55 per cent in case of naphtha (beginning the first week of August 2008), about 53 per cent in case of furnace oil (beginning mid-August 2008), about 41 per cent in the case of light diesel oil (beginning the first week of December 2008) and about 32 per cent in the case of bitumen (beginning mid-November 2008) as on March 28, 2009. The monthly average Indian basket price for crude oil came down from US $ 132.3 per barrel in July 2008 to US $ 41.2 per barrel in December 2008. Against this backdrop, the Government cut the price of petrol by Rs.5 per litre and diesel by Rs. 2 per litre effective December 6, 2008. As the international crude oil prices continued to remain around US $ 40 per barrel the Government again cut the price of petrol by Rs. 5 per litre, diesel by Rs. 2 per litre and LPG for domestic use by Rs.25 per cylinder effective January 29, 2009. Consequently, the fuel group inflation turned negative (-6.1 per cent) as on March 28, 2009.
VI.31 Manufactured products inflation, year-on-year, increased to a peak of 11.9 per cent in mid-August 2008 from 7.3 per cent at end-March 2008 (Table 68). This was mainly driven by sharp increase in prices of iron and steel, sugar, edible oils/ oil cakes, textiles, chemicals, and machinery and machine tools. Since September 2008, manufactured products inflation declined substantially and reached 1.4 per cent as on March 28, 2009.
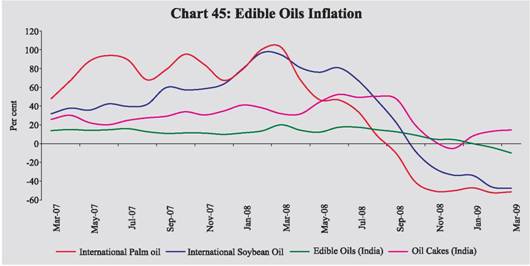
VI.32 The sharp increase in domestic edible oils and oil cake prices up to August 2008 reflected surge in demand, lower domestic rabi oilseeds production during 2007-08 as well as sharp increase in international prices. Thereafter, oilseeds and edible oils prices declined reflecting the effect of fiscal measures as well as easing international prices on the back of projected increase in global production (Chart 45). However, according to the Second Advance Estimates for 2008-09, domestic oilseeds crop is expected to be down by 12.8 per cent. Moreover, the Government has imposed 20 per cent customs duty on import of crude soybean oil to safeguard the interest of domestic producers on November 18, 2008. Reflecting the recent decline in raw cotton prices, cotton textile prices in India also declined since August 2008.
Table 68: Wholesale Price Inflation in India (year-on-year) |
(Per cent) |
Commodity |
Weight |
2007-08 (March 29) |
2008-09 P (March 28) |
Inflation |
WC |
Inflation |
WC |
1 |
2 |
3 |
4 |
5 |
6 |
All Commodities |
100.0 |
7.7 |
100.0 |
0.3 |
100.0 |
1. |
Primary Articles |
22.0 |
9.7 |
28.2 |
3.5 |
301.0 |
| |
Food Articles |
15.4 |
6.5 |
13.2 |
6.3 |
369.7 |
| |
i. |
Rice |
2.4 |
9.1 |
2.5 |
12.8 |
104.9 |
| |
ii. |
Wheat |
1.4 |
5.1 |
1.0 |
5.2 |
28.1 |
| |
iii. |
Pulses |
0.6 |
-1.9 |
-0.2 |
8.3 |
20.7 |
| |
iv. |
Vegetables |
1.5 |
14.2 |
2.3 |
-4.0 |
-20.2 |
| |
v. |
Fruits |
1.5 |
4.1 |
1.0 |
8.1 |
53.7 |
| |
vi. |
Milk |
4.4 |
8.7 |
4.7 |
6.1 |
97.5 |
| |
vii. |
Eggs, Fish and Meat |
2.2 |
2.4 |
0.8 |
3.1 |
27.2 |
| |
Non -Food Articles |
6.1 |
11.4 |
8.8 |
-0.1 |
-2.0 |
| |
i. |
Raw Cotton |
1.4 |
14.0 |
2.0 |
2.5 |
11.1 |
| |
ii. |
Oilseeds |
2.7 |
20.3 |
6.7 |
-2.3 |
-24.4 |
| |
iii. |
Sugarcane |
1.3 |
-0.4 |
-0.1 |
0.0 |
0.0 |
| |
Minerals |
0.5 |
49.9 |
6.2 |
-12.8 |
-65.4 |
2. |
Fuel, Power, Light and Lubricants |
14.2 |
6.8 |
18.9 |
-6.1 |
-495.5 |
| |
i. |
Minerals Oil |
7.0 |
9.3 |
15.1 |
-8.7 |
-422.9 |
| |
ii. |
Electricity |
5.5 |
1.5 |
1.4 |
-2.6 |
-66.7 |
| |
iii. |
Coal Mining |
1.8 |
9.8 |
2.5 |
-1.0 |
-7.6 |
3. |
Manufactured Products |
63.8 |
7.3 |
52.8 |
1.4 |
297.3 |
| |
i. |
Food Products |
11.5 |
9.4 |
12.4 |
7.5 |
294.2 |
| |
|
of which: Sugar |
3.6 |
1.1 |
0.4 |
17.6 |
159.8 |
| |
|
Edible Oils |
2.8 |
20.0 |
5.5 |
-10.2 |
-91.8 |
| |
ii. |
Cotton Textiles |
4.2 |
-6.8 |
-2.8 |
16.7 |
174.9 |
| |
iii. |
Man-made Fibres |
4.4 |
2.8 |
0.7 |
-2.0 |
-14.0 |
| |
iv. |
Chemicals and Products |
11.9 |
6.0 |
8.7 |
1.5 |
61.6 |
| |
|
of which : Fertilisers |
3.7 |
5.1 |
2.0 |
5.2 |
60.3 |
| |
v. |
Basic Metals, Alloys and Metal Products |
8.3 |
20.3 |
25.2 |
-12.2 |
-496.3 |
| |
|
of which: Iron and Steel |
3.6 |
34.2 |
20.1 |
-18.4 |
-394.0 |
| |
vi. |
Non-metallic Mineral Products |
2.5 |
6.4 |
2.0 |
1.9 |
17.2 |
| |
|
of which: Cement |
1.7 |
5.1 |
1.1 |
2.2 |
13.8 |
| |
vi. |
Machinery and Machine Tools |
8.4 |
3.5 |
2.9 |
2.7 |
64.1 |
| |
|
of which: Electrical Machinery |
5.0 |
4.8 |
2.0 |
1.2 |
15.0 |
| |
viii. |
Transport Equipment and Parts |
4.3 |
3.9 |
1.7 |
3.4 |
41.5 |
| |
Memo: |
| |
Food Items (Composite) |
26.9 |
7.7 |
25.6 |
6.8 |
663.9 |
| |
WPI Excluding Food |
73.1 |
7.8 |
74.4 |
-2.0 |
-563.9 |
| |
WPI Excluding Fuel |
85.8 |
8.0 |
81.1 |
2.0 |
595.5 |
WC: Weighted Contribution. P: Provisional. |
 VI.33 Domestic iron and steel prices inflation had reached 36 per cent, y-o-y, by end-August 2008 reflecting sharp increases in global prices. Since then, iron and steel prices have shown a decline and y-o-y change has turned negative (-18.4 per cent as on March 28, 2009) (Chart 46).
This decline in domestic iron and steel prices could be attributed to declining global prices, expected deceleration in demand, both domestic and external, as well as various fiscal measures in the form of reductions in customs duties and imposition of export duties on various steel items announced by the Government since April 2008.
VI.34 Overall, during 2008-09 the movement of WPI inflation was largely driven by fuel group and ‘manufactured products’ group. Since September 2008, the contribution of fuel group to WPI inflation has been declining sharply and entered negative territory by December 2008, leading to faster decline in overall inflation (Chart 47).
VI.35 As per the latest information available, WPI inflation further declined to 0.2 per cent as on April 4, 2009 from 0.3 per cent at end-March 2009.
Consumer Price Inflation
VI.36 Inflation, based on y-o-y variation in consumer price indices (CPIs), increased since June 2008 mainly due to increase in the prices of food, fuel and services (represented by the ‘miscellaneous’ group). Various measures of consumer price inflation, though started declining, still remained high in the range of 9.6-10.8 per cent during January/ February 2009 as compared with 7.3-8.8 per cent in June 2008 and 5.2-6.4 per cent in February 2008 (Table 69). The higher level of consumer price inflation as compared to WPI inflation in recent months could be attributed to higher prices of food articles which have higher weight in CPIs.
Asset Prices
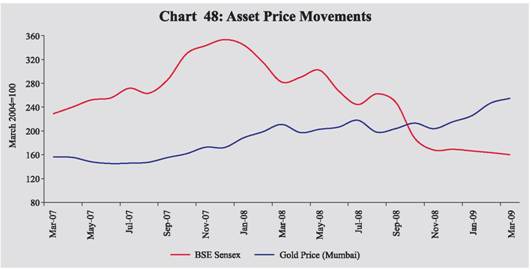
VI.37 Domestic equity prices underwent sharp corrections during 2008-09 in consonance with trends in major international financial markets, which plunged in the wake of deepening turmoil in international financial markets following the US subprime crisis, and concerns about slowdown in the domestic economy (see Chapter V). Domestic gold prices, which had eased somewhat during the second quarter of 2008-09 mirroring movements in international prices, hardened subsequently to aroundRs.15,255 per 10 grams in March 2009 as international prices recorded further increase (Chart 48). Domestic gold prices, however, eased to Rs.14,205 per 10 grams by April 09, 2009.
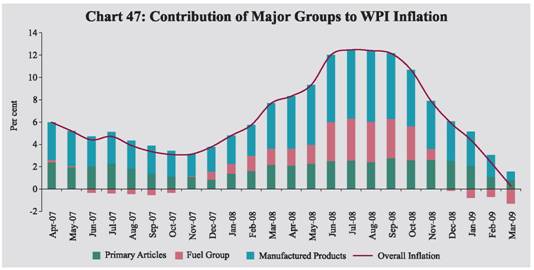
Table 69: Consumer Price Inflation - Major Groups |
(Year-on-year variation in per cent) |
CPI Measure |
Weight |
Mar-06 |
Mar-07 |
Jun-07 |
Sep-07 |
Dec-07 |
Mar-08 |
Jun-08 |
Sep-08 |
Dec-08 |
Jan-09 |
Feb-09 |
1 |
2 |
3 |
4 |
5 |
6 |
7 |
8 |
9 |
10 |
11 |
12 |
13 |
CPI-IW (Base: 2001=100) |
General |
100.0 |
4.9 |
6.7 |
5.7 |
6.4 |
5.5 |
7.9 |
7.7 |
9.8 |
9.7 |
10.4 |
9.6 |
Food Group |
46.2 |
4.9 |
12.2 |
8.1 |
8.7 |
6.2 |
9.3 |
10.5 |
13.1 |
13.1 |
13.9 |
- |
Pan, Supari etc. |
2.3 |
3.1 |
4.4 |
9.6 |
10.3 |
10.3 |
10.9 |
7.1 |
7.8 |
8.5 |
6.8 |
- |
Fuel and Light |
6.4 |
-2.9 |
3.2 |
1.6 |
2.3 |
2.3 |
4.6 |
8.4 |
9.1 |
9.7 |
9.6 |
- |
Housing |
15.3 |
6.6 |
4.1 |
4.1 |
4.0 |
4.0 |
4.7 |
4.7 |
3.8 |
3.8 |
6.0 |
- |
Clothing, Bedding etc. |
6.6 |
3.0 |
3.7 |
4.4 |
5.3 |
3.5 |
2.6 |
2.5 |
2.5 |
4.2 |
3.4 |
- |
Miscellaneous |
23.3 |
4.6 |
3.3 |
4.0 |
4.0 |
4.7 |
6.3 |
6.2 |
7.6 |
8.3 |
8.2 |
- |
CPI-UNME (Base: 1984-85=100) |
General |
100.0 |
5.0 |
7.6 |
6.1 |
5.7 |
5.1 |
6.0 |
7.3 |
9.5 |
9.8 |
10.4 |
- |
Food Group |
47.1 |
5.3 |
10.9 |
7.7 |
7.7 |
6.2 |
7.8 |
9.6 |
13.2 |
13.4 |
14.0 |
- |
Fuel and Light |
5.5 |
1.9 |
6.4 |
7.2 |
7.0 |
5.4 |
4.6 |
5.3 |
6.2 |
7.7 |
8.0 |
- |
Housing |
16.4 |
5.5 |
5.6 |
5.6 |
4.9 |
4.7 |
4.0 |
3.8 |
3.5 |
3.5 |
5.8 |
- |
Clothing, Bedding etc. |
7.0 |
2.9 |
3.6 |
4.3 |
4.0 |
4.1 |
4.3 |
3.4 |
3.1 |
2.7 |
2.4 |
- |
Miscellaneous |
24.0 |
5.1 |
4.4 |
3.7 |
3.2 |
3.8 |
4.8 |
6.6 |
8.4 |
9.3 |
9.7 |
- |
CPI-AL (Base: 1986-87=100) |
General |
100.0 |
5.3 |
9.5 |
7.8 |
7.9 |
5.9 |
7.9 |
8.8 |
11.0 |
11.1 |
11.6 |
10.8 |
Food Group |
69.2 |
5.5 |
11.8 |
8.8 |
8.8 |
6.2 |
8.5 |
9.6 |
12.0 |
11.9 |
12.7 |
11.6 |
Pan, Supari etc. |
3.8 |
6.6 |
5.7 |
9.1 |
11.1 |
11.3 |
10.4 |
11.2 |
12.8 |
13.7 |
14.8 |
14.8 |
Fuel and Light |
8.4 |
4.3 |
6.9 |
7.4 |
7.2 |
6.3 |
8.0 |
8.9 |
10.2 |
11.3 |
11.7 |
11.3 |
Clothing, Bedding etc. |
7.0 |
2.2 |
3.5 |
2.7 |
1.9 |
1.3 |
1.8 |
3.1 |
6.0 |
7.0 |
7.0 |
7.2 |
Miscellaneous |
11.7 |
5.5 |
6.8 |
6.7 |
5.5 |
5.2 |
6.1 |
6.5 |
7.1 |
7.0 |
6.8 |
6.5 |
CPI-RL (Base: 1986-87=100) |
General |
100.0 |
5.3 |
9.2 |
7.5 |
7.6 |
5.6 |
7.6 |
8.7 |
11.0 |
11.1 |
11.4 |
10.8 |
Food Group |
66.8 |
5.8 |
11.5 |
8.5 |
8.8 |
6.2 |
8.2 |
9.6 |
12.0 |
11.9 |
13.0 |
11.6 |
Pan, Supari etc. |
3.7 |
6.3 |
5.7 |
9.3 |
11.6 |
11.5 |
10.6 |
10.9 |
12.5 |
13.4 |
14.8 |
14.5 |
Fuel and Light |
7.9 |
4.0 |
6.9 |
7.4 |
7.2 |
6.3 |
8.0 |
8.9 |
10.5 |
11.3 |
11.2 |
11.0 |
Clothing, Bedding etc. |
9.8 |
2.7 |
3.1 |
2.6 |
2.1 |
2.6 |
2.8 |
4.1 |
6.5 |
7.3 |
7.7 |
7.7 |
Miscellaneous |
11.9 |
5.2 |
6.3 |
6.2 |
5.3 |
5.0 |
6.2 |
6.8 |
7.4 |
7.5 |
7.0 |
6.8 |
Memo: |
WPI Inflation (End of period) |
4.1 |
5.9 |
4.4 |
3.4 |
3.8 |
7.7 |
12.0 |
12.1 |
5.9 |
4.0 |
2.4 |
GDP Deflator based Inflation* |
4.9 |
5.5 |
5.4 |
3.9 |
2.7 |
4.9 |
8.0 |
10.6 |
8.3 |
- |
- |
*: Data for March pertain to full year |
|
|
|
|
|
|
|
|
|
|
|
IW : Industrial Workers. UNME : Urban Non-Manual Employees. AL : Agricultural Labourers. RL : Rural Labourers. |
 |
 IST,
IST,