 IST,
IST,
VI. Price Situation
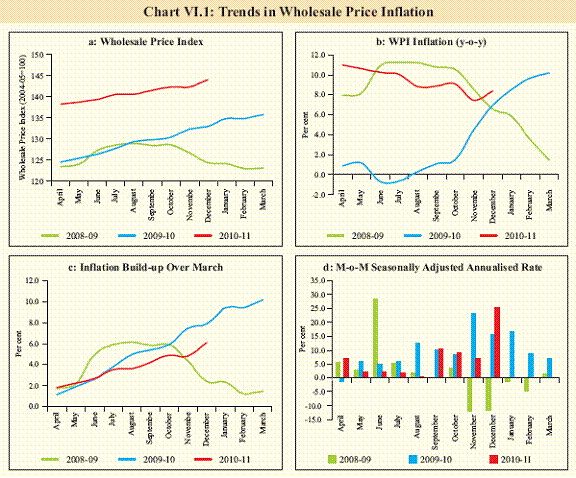
Reflecting favourable base effects and modest softening of manufactured products price pressures aided by past monetary tightening, headline inflation exhibited moderation during August- November 2010 relative to double digit levels experienced during March-July 2010. However, renewed inflationary pressures became evident in December 2010 as headline WPI inflation increased to 8.4 percent from 7.5 per cent in November 2010. New drivers are seen from fuel and non-fuel international commodity prices and demand-supply imbalances in some food items. Food inflation in particular has remained stubbornly in double digits for over two years now, which has welfare costs. The sources of price pressure in this segment, however, could be largely non-responsive to monetary policy actions. While inflation is likely to soften in coming months it is likely to stay elevated above the earlier anticipated path. The upside risks to inflation, particularly from the impact of supply rigidities and hardening commodity prices have increased, which could dampen the expected impact of monetary policy to some extent. Policy response ahead has to recognise these risks. Inflation rebound in December 2010 was largely driven by unanticipated factors VI.1 Inflation resurgence during December 2010 was mainly led by a sudden spurt in prices of primary food articles, especially vegetables, and fuels. These together accounted for nearly 60 per cent of the WPI increase during the month. Currently inflation remains above the Reserve Bank’s comfort level and the long-term average that was experienced during the precrisis high growth phase. Price expectations also remain elevated and price-level changes have not yet dampened (Chart VI.1a). Base effects have helped lower inflation on a year-on-year basis, but price pressures persist (Chart VI.1b). Food inflation moderated for a significant part of the year but still remains elevated and has witnessed renewed pressures in recent weeks. Though non-food manufactured products inflation remained range-bound during 2010- 11 so far, the price index has shown some uptick in recent months and the risks to more generalised inflation appear to have re-emerged. VI.2 Apart from food inflation, inflationary pressures have increased both from higher global commodity prices and domestic demand. Increasing trends in international commodity prices, especially crude oil and metals, entail the risk that rising international commodity prices will spill over into domestic inflation. Furthermore, significant price pressures in domestic non-food primary articles such as raw cotton, raw rubber and minerals may lead to increase in input costs for the manufacturing sector. The persistent price pressures are also evident from the high month-over-month seasonally adjusted annualised inflation in recent months (Chart VI.1d). Changing dynamics underlying the inflation rebound VI.3 Since the second quarter review of monetary policy in October 2010, there have been significant changes in the factors conditioning the inflation path. First, the primary food articles inflation declined to single digit after almost two years in November 2010 along the expected lines, but rose again on the back of significant rise in prices of vegetables like onion, tomato, okra, cabbage and brinjal owing to loss of output caused by unseasonal rains and supply chain rigidities. Some price pressures emerged in condiments and spices as well. Second, the global crude oil prices were averaging at about US$ 75 per barrel in the second quarter of 2010-11 with most forecasts and even futures prices indicating only gradual recovery going forward. Contrary to the expectations, crude oil prices have firmed up significantly and crossed US$90 per barrel now. This exerted upward pressure on prices of freely priced products under the fuel group and increased risks ahead for further pass-through. Third, the global commodity prices, especially food, primary commodities and metals have increased substantially and the pass-through of global increases to domestic prices have so far been limited, suggesting risks from imported inflation going forward. Finally, the sharp increase in prices of non-food primary articles and minerals, like raw cotton and iron ore could put pressure on input costs for the manufactured products. Therefore, a host of factors, both anticipated and unanticipated, contributed to the upside surprise on expected inflation trajectory.
VI.4 As a result of newer factors and increased risks, the inflation trajectory is likely to show some persistence and moderate only gradually. In the Second Quarter Review of Monetary Policy, the inflation projection for March 2011 was placed at 5.5 per cent. In the mid-Quarter review of December 16, 2010, it was indicated that the risks to this projection are on the upside. Some of these upside risks have since materialised. First, the seasonal decline in food prices has still not occurred as a result of persistent inflation in primary food items. Second, global commodity prices are again on the upswing. This occurred due to: (a) betterthan- anticipated growth outlook for certain key advanced economies, especially the US, (b) supply-disruptions in a number of primary commodities and (c) spillover effects of further quantitative easing (QE-2) in the US. The FAO food price index in December 2010 surpassed the peak it reached during the global food price shock of 2008, indicating significant price pressures. Crude oil prices have firmed up further, putting pressure on the prices of the freely priced petroleum products, even while pass-through remains incomplete for the administered items. Third, input cost pressures from high primary commodity prices are exerting further pressure on manufactured products prices, combined with robust growth and strong demand. Global inflation outlook suggests growing divergence and the associated asymmetry in the stance of monetary policy VI.5 The global inflation environment continues to remain moderate but a rising divergence in inflation trends between advanced and emerging economies is perceptible (Table VI.1). Some of the advanced economies like the US and Japan face the macroeconomic challenge of generating some inflation to stimulate economic activity. Others like the euro area and UK are witnessing acceptable level of core inflation but with rising headline inflation and high rates of unemployment. Among emerging economies, China recorded a two year high in CPI inflation in November 2010. With the exception of Malaysia, all major South East Asian economies are facing inflationary pressures, just as is the case with most Latin American and East European economies. VI.6 Subdued growth in advanced economies along with slack labour market conditions and well anchored inflation expectations provide room to sustain policy accommodation. However, advanced economies face enhanced risks of higher long-term inflation expectations, in the context of further fiscal stimulus being used in conjunction with enhanced monetary stimulus. Policy rates in advanced economies continue to remain near zero/very low as the concerns relating to sustainability of recovery still persist (Table VI.1). For EMEs, however, further quantitative easing by advanced economies and its potential impact on commodity prices could raise the upside risks to their domestic inflation. Several EMEs have started normalisation of their monetary policy stance, and the anti-inflationary monetary policy could become a more common response, going forward.
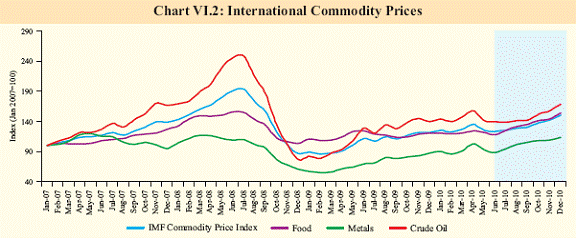
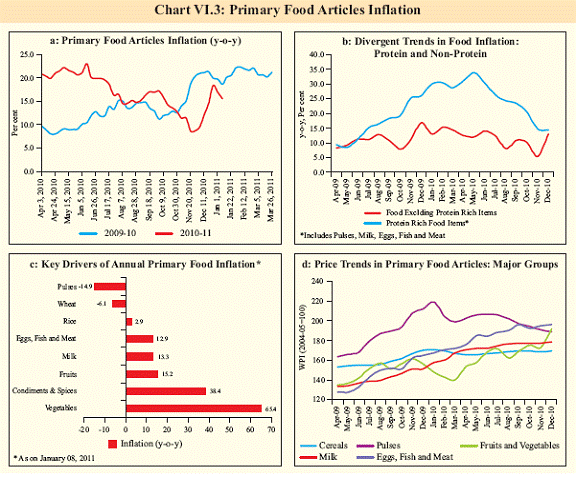
Risks of imported inflation from rising global commodity prices have amplified VI.7 Upside risks to domestic inflation emanate from further hardening of global commodity prices, which have already started to rise since mid-2010. Global non-fuel commodity prices, especially food and metals, have been firming up since July 2010. Supply disruptions in many commodities and indications of further quantitative easing by some advanced economies initiated these trends (Chart VI.2). Since October 2010, international commodity price pressures have been exacerbated by hardening of global crude oil prices. On the back of easy global liquidity and severe winters in Europe and US, global crude oil prices crossed US$90 per barrel, in spite of ample spare capacities with some OPEC members. Simultaneous increase in prices of a number of commodities poses the risk of higher imported inflation. VI.8 The magnitude of the spillover impact of rising prices of commodities in the world markets to India’s inflation path would depend upon four factors: (a) the extent of increase in world prices of imported items, (b) movements in the exchange rate of rupee, (c) share of imported items in India’s consumption basket, and (d) the degree of pass-through that may be suppressed by policy intervention in the domestic market. The pass-through from global prices to domestic prices has been particularly low in case of wheat, maize, sugar and edible oils (Table VI.2). These could be attributed to local supply conditions and administrative price measures in place. With significant increase in world prices of cotton, iron ore, gold and silver, domestic wholesale prices also rose significantly, though the pass-through was incomplete in many cases. Overall, domestic prices are now significantly impacted by the global commodity price movements, and hence, rising international prices is an important source of upward risk to domestic inflation. Persistence of high food inflation reflects both structural imbalances and supply chain rigidities VI.9 Persistence of food inflation has become a primary impediment to faster moderation of inflation. The expected degree of correction in food prices after a normal monsoon did not materialise. Primary food articles with a weight of 14.3 per cent in WPI, contributed 38.6 per cent to the increase in overall WPI during Q3 of 2010-11 (Table VI.3). The decomposition of food inflation indicates that during the recent period the key drivers of food inflation are non-cereals (Chart VI.3). These were, apart from vegetables, the protein rich items. The supply response to growing demand in some of these items has been weak, leading to growing imbalances. Medium-term supply augmenting measures would be critical to contain the persistent pressure of inflation from this source. Import option to deal with this challenge on a permanent basis remains limited, given the size of demand and high global food prices.
VI.10 Extended spells of South-West monsoon and unseasonal rains in certain parts of the country have led to loss of vegetables output. Given its perishable nature and also the lack of adequate warehousing and storage facilities, the prices of vegetables increased significantly in December 2010 (Table VI.4). This is in contrast to the trend witnessed in previous years as the prices of vegetables usually show some seasonal decline during December following the arrival of winter crop in the market.
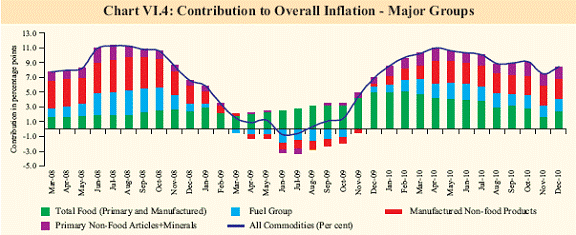
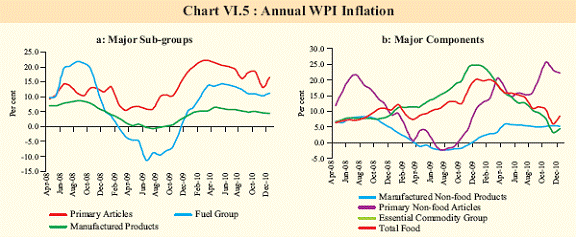
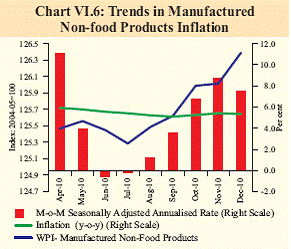
Contribution of non-food manufactured products inflation to headline inflation remains steady VI.11 On a year-on-year basis, the moderation in inflation witnessed up to November 2010 was largely on account of the decline in the contribution of food inflation to overall inflation (Chart VI.4). The contribution of manufactured non-food products increased marginally in November 2010 and remained unchanged in December 2010. Fuel group and non-food primary articles also continue to contribute significantly to overall inflation pointing towards persisting and generalised inflationary pressures. VI.12 Among the major sub-groups of WPI, inflation remains higher in primary articles and ‘fuel and power’ group relative to manufactured products (Chart VI.5.a). Manufactured products inflation moderated largely on account of decline in sugar prices. Currently, all segments of primary articles - food, non-food and minerals are showing double-digit inflation. Non-food primary articles inflation has been exacerbated by revision in sugarcane index by about 50 per cent in March 2010 and increase in iron ore and raw cotton prices. Iron ore prices have doubled since December 2009, while raw cotton prices increased by more than 42 per cent since September 2010. Inflation in essential commodities declined significantly, more on account of the high base recorded a year ago. Non-food manufactured products inflation remains range-bound, but some indication of price pressures visible VI.13 Manufactured non-food products, which account for 55 percent weight in the WPI basket and seen as a broad indicator of generalised inflationary pressures exhibited near stable inflation path during 2010-11 (Chart VI.6). The flattening of inflation in non-food manufactured items in past few months could be partly in response to the monetary tightening of the past, but upside risks to this segment persist. This is corroborated by both upward trend in the price index and high month-over-month seasonally adjusted annualised inflation. This could largely be on account of the significant input cost pressures emanating from high primary commodity prices translating to higher output prices in the wake of buoyant demand.
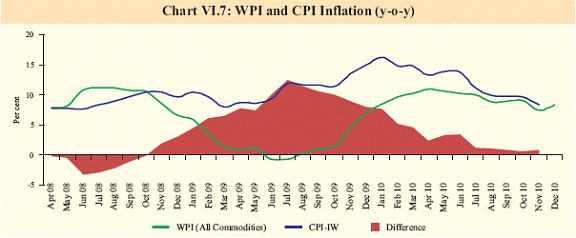
Divergence between CPI and WPI inflation narrows, but elevated levels point to persistence of welfare costs VI.14 Inflation, as measured by various consumer price indices, generally moderated during 2010-11, with some reversal witnessed in December 2010 (for CPI-Agricultural and Rural Labourers). Various measures of inflation remained in the range of 8.0-8.4 per cent in November/December 2010. While the extent of divergence between WPI and CPI inflation narrowed significantly, both remained elevated leading to significant welfare costs (Chart VI.7). Upside risks to inflation have increased, suggesting the need for sustained antiinflationary policy focus VI.15 The underlying inflation trends suggest that the return of inflation to a more acceptable level could at best be gradual. Some of the domestic supply-side pressures could be transient in nature, and administrative steps to curb the price spiral and seasonal correction could soften prices, going ahead. However, the expected moderation can get offset by rising risk of transmission from increasing global commodity prices. Hardening international commodity prices, particularly petroleum, minerals and metal prices have already begun to seep through to domestic prices. As a result, some price pressures could persist, even as inflation softens. Suppressed inflation in the near-term due to administrative price interventions to insulate domestic prices from global price surges, particularly in respect of some of the petroleum products, could also become more open at a later stage.
VI.16 Even if inflation softens in the near-term, sustaining a low inflation regime would require addressing structural issues at a micro level. In the near-term, closer monitoring of production, consumption and price patterns in specific commodities with a focus on supply-chain management to contain market pressures would be helpful. There is also a need to focus on supply augmentation in the short-run, inter alia, through timely imports, wherever feasible. VI.17 While inflation upsurge has largely come from supply-side elements, monetary policy would need to factor in near-term risks to inflation from high input cost pressures transmitting to output prices. The risks to generalised inflation cannot be overlooked as inflation expectations are currently ruling high. Anchoring inflationary expectations would be necessary to mute the second-round impact of supply-side shocks. |
||||||||||||||||||||||||||||||||||||||||||||||||||||||||||||||||||||||||||||||||||||||||||||||||||||||||||||||||||||||||||||||||||||||||||||||||||||||||||||||||||||||||||||||||||||||||||||||||||||||||||||||||||||||||||||||||||||||||||||||||||||||||||||||||||||||||||||||||||||||||||||||||||||||||||||||||||||||||||||||||||||||
Page Last Updated on:


