 IST,
IST,


VI. Price Situation
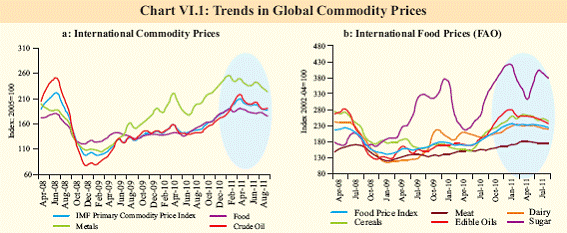
Inflation continued to be high, generalised and above the comfort level of the Reserve Bank in the first half of 2011-12. Upside risks to inflation path could result from exchange rate passthrough of recent rupee depreciation and incomplete transmission of earlier rise in global commodity prices. Persistent supply shocks in an environment of buoyant demand have contributed to both generalisation of the inflation process and the sticky inflation path. The impact of anti-inflationary monetary policy measures taken so far may moderate domestic demand thereby reducing the upside risks to inflation. Upside risks to global inflation persist despite weaker global growth outlook VI.1 The substantial increase in commodity prices witnessed since early 2009 has fed into domestic inflation of major economies and inflation exhibited uptrend across both developed and emerging economies. The recent moderation in commodity prices on the back of weakening global growth prospects is expected to have limited softening impact on inflationary pressures, especially in emerging and developing economies (EDEs). In September 2011, the IMF revised upwards the projection of inflation for EDEs to 7.5 per cent for 2011 (from 6.9 per cent earlier projected in June 2011), while for advanced economies (AEs) it was kept unchanged at 2.6 per cent. VI.2 AEs largely persist with their expansionary stance of monetary policy, with the US Fed providing clear guidance on the future stance of monetary policy up to 2013. Renewed concerns over the sluggishness of global recovery has led to most central banks of advanced economies keeping their policy rates at near zero/very low levels, while EDEs have gradually tightened monetary policy to contain inflationary pressures (Table VI.1).However, some of the EDEs which faced a surge in capital inflows due to higher interest rates responded by lowering policy rates as excessive capital inflows also entailed the risk of inflation. Global commodity prices ease but levels remain high VI.3 Global commodity prices have softened somewhat during 2011-12 from the high levels reached towards the end of 2010-11. This has been driven by concerns over sustainability of demand in the wake of sovereign debt concerns in the advanced economies as well as improved supply prospects in key agricultural products. Crude oil prices moderated on the back of International Energy Agency (IEA) member countries agreeing to release 60 million barrels of oil in July 2011 and projected moderation in demand growth (Chart VI.1). Global metal prices have also declined somewhat in recent months due to increasing worries about the impact of slowing economic growth on metal demand. VI.4 Global food prices reached their historical peak in early 2011 and have moderated somewhat during recent months as global supply prospects have improved in key agricultural commodities. However, the prices continue to rule at significantly high levels. Rising income, diversification of dietary patterns, attraction of bio-fuel as an alternative source of energy and weather disturbances impacting supply situation are the major factors that contribute to market tightness. VI.5 The World Bank projections on commodity prices for the 2011 and 2012 indicate that despite softening, prices could be significantly higher in 2011 and 2012 as compared to 2010 levels and the projected levels are almost closer to the peaks seen in 2008. This indicates that the pressure from global commodity prices may persist and the recent marginal softening of prices could only dampen the magnitude of price pressures.
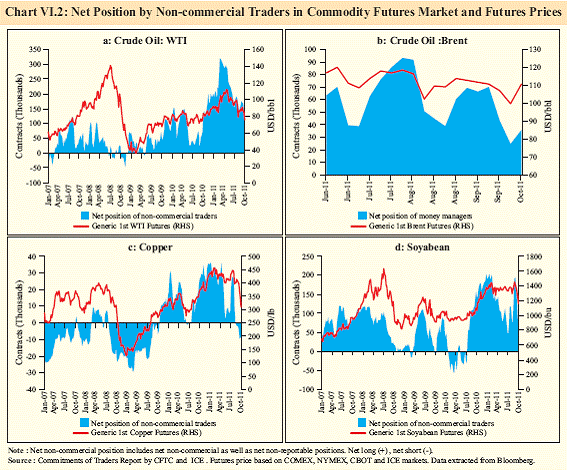
VI.6 As yet, incomplete pass through of past price increases is another important risk factor from imported inflation.A comparative position of the movement of different commodity prices since the trough they hit during early 2009 indicates that the domestic price increases in most commodities have been much lower than for the global price increases. This again limits the possibility of domestic prices falling in tandem with softening global prices. Financialisation of commodities adds to price volatility VI.7 There is growing evidence of financialisation of commodities, which has been seen in some quarters as a source of upward pressure on global commodity prices.Net non-commercial positions in commodity futures and the futures prices for several commodities have remained significantly volatile (Chart VI.2).Unwinding of positions have generally coincided with softening of commodity prices in the futures market.
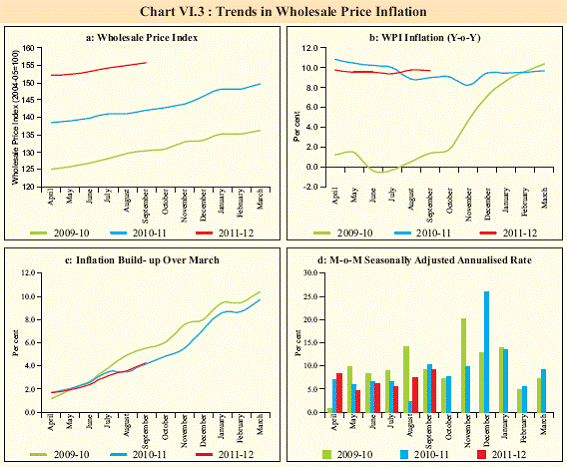
Generalised inflation persisted at much above the comfort level VI.8 Domestically, inflationary pressures still persist and Wholesale Price Index (WPI) y-o-y inflation was at 9.7 per cent (provisional) for the month of September 2011. Inflation remained at above 9 per cent over successive months in the first half of the year, and price pressures persisted across the range of commodities covered in the WPI. Inflation in non-food manufactured products remained at or above 7 per cent over eight successive months. While high food and fuel price inflation contributed to the persistence of headline inflation, the generalised nature of the inflation warranted monetary policy measures to soften the demand pressures. The antiinflationary thrust of monetary policy recognised the risk of near-term modest sacrifice of growth momentum, while emphasizing the critical importance of a low inflation environment as a pre-condition to sustainable and inclusive growth.
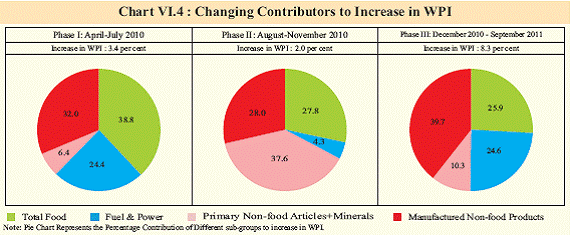
VI.9 The month over month (m-o-m) seasonally adjusted changes in the price level, though volatile, remained significantly positive (Chart VI.3). Since December 2010, the major contributor to price rise has been non-food manufactured products reflecting generalisation of the inflationary pressures (Chart VI.4). It may be noted that the second round and indirect impact of past increases in food, fuel and nonfood primary articles prices transmitted to nonfood manufactured products in an environment of buoyant demand conditions.
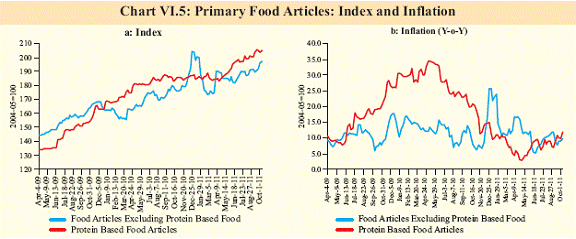
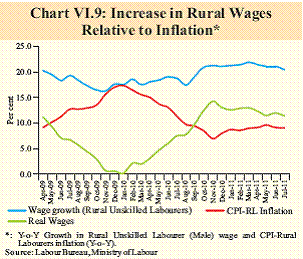
Food inflation remains elevated despite record food production VI.10 Though primary food articles inflation moderated from the levels of over 20 per cent witnessed in Q1 of 2010-11, it still remains high with the average inflation during 2011-12 so far (up to September) at 8.9 per cent.A decomposition of food articles inflation indicates that the price pressures have been moderate for cereals whereas increases have been significant in the case of protein-rich items (Chart VI.5). Demand has been growing in these items in recent years with rising income and changes in dietary pattern in favour of proteinrich items. Price pressures in these items could continue in the absence of supply response. Significant increase in nominal wages in rural areas (Chart VI.9) in recent years and successive increases in Minimum Support Prices (MSP) have weakened considerably the expected favourable impact of a normal monsoon this year and record food production. Non-food articles prices remain moderate VI.11 During 2011-12 (up to October 8, 2011), non-food articles prices have moderated somewhat, largely driven by decline in raw cotton prices in line with declining global prices. On the other hand, oilseeds prices have firmed up in recent months. As the area sown under both cotton and oilseeds have increased in the current year as compared with the previous year levels and also that the global prices have declined, non-food primary articles inflation may remain moderate in the near-term.
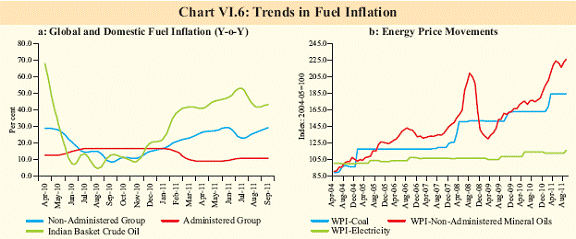
Increase in freely priced fuel products and revision in administered prices keep fuel inflation high VI.12 Increase in administered prices of fuel products effected in June 2011 led to firming up of fuel inflation. Since then, prices of freely priced mineral oil products have increased partly on account of the recent depreciation of the rupee. Notwithstanding recent increases, the pass-through of global inflation to domestic inflation remains incomplete (Chart VI.6a). VI.13 Domestic coal prices have remained unchanged in 2011-12 so far and given the incomplete pass-through of past increases in global coal prices, an upward revision in coal prices may become necessary going forward. Electricity prices increased by about 4 per cent in September 2011, partly reflecting the increase in input costs. The increase in electricity prices has been much less as compared with the increases in other energy prices as well as coal prices (Chart VI.6b).Given this, electricity prices are likely to be revised upwards in many states.
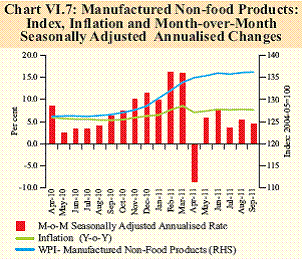
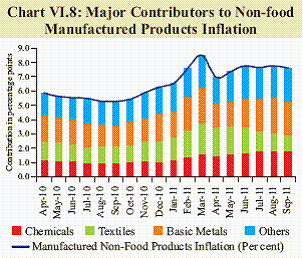
Depreciation of the Rupee emerges as a new source of price pressures VI.14 The rupee has depreciated by about 11 per cent against the US dollar during 2011-12 so far. India’s imports account for about 22 per cent of GDP, and depreciation of the rupee raises the risk of imported inflation. Many of the commodities having large combined weights in the WPI also constitute jointly a significant proportion of total imports (Table VI.2). This is particularly evident from the trends in the price of the Indian Basket Crude Oil during 2011-12 so far. While in dollar terms the Indian Basket Crude Oil has declined since July 2011, in rupee terms it has increased owing to the rupee depreciation (Table VI.3). Non-food manufactured products inflation remains significantly high. VI.15 Sustained high inflation in manufactured non-food products reflects a combination of high input costs and buoyant demand. Even with modest moderation in demand in response to past monetary policy actions and the weakening of global growth outlook, as long as growth in demand remains significantly positive, input cost pressures can still be passed on in the form of higher wholesale and retail prices.Monthover- month seasonally adjusted inflation indicates that the price pressures have been almost continuous in 2011-12 so far, though relatively moderate as compared to the Q4 of 2010-11(Chart VI.7). VI.16 Among non-food manufactured products, textiles, chemicals and metals continue to contribute the most to the increase in prices of manufactured non-food products (i.e., about 69 per cent in September 2011) (Chart VI.8). Input cost pressures have been significant for these products in the recent past. While the recent moderation in cotton prices could be reflected in textile prices with a lag, depreciation of the rupee would offset the impact of any softening of global commodity prices on the price outlook for metals and chemicals significantly. Inflation in non-food manufactured products is also driven by a few items with low weights in WPI relative to the high weighted contribution. 24 out of 498 items under the manufactured non-food products, with a combined weight of 14.4 per cent in overall WPI accounted for as high as 51.2 per cent of the inflation in manufactured non-food products in September 2011.
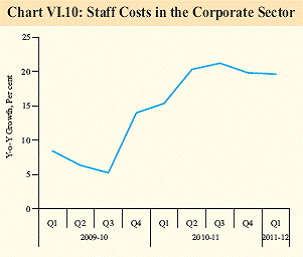
Input cost pressures alongside steady demand underpin the generalised inflation VI.17 While supply shocks are often presumed to be temporary, at times, they could be repeated and thereby cause high inflation over a sustained period. In the absence of demand, however, even repeated supply shocks cannot cause a generalised inflation. If prices of commodities experiencing supply shock go up, prices of other commodities must decline in the absence of demand. Thus, high inflation that is broad based across a whole range of items covered in the price index is only feasible with the support of buoyant demand. VI.18 Information on recent trends in expenditure patterns as available from the 66th round of NSSO consumption expenditure survey corroborates the role of demand. Growth in monthly per capita expenditure has been stronger in the second half of 2000s as compared with the first half (Table VI.4). VI.19 Wage growth has been significant both in the formal and informal sectors relative to the inflation facilitating generalisation of supply side induced inflation shocks. Increase in rural wages has been in excess of the level of inflation experienced in rural areas (Chart VI.9). In the formal sector, Reserve Bank’s company finance data suggest that the staff costs have risen at a faster rate since the middle of 2009-10 (Chart VI.10).
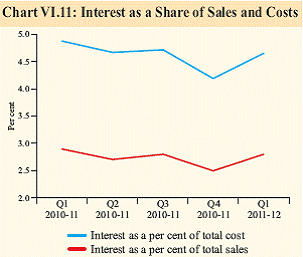
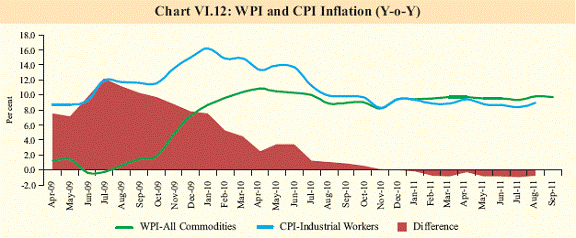
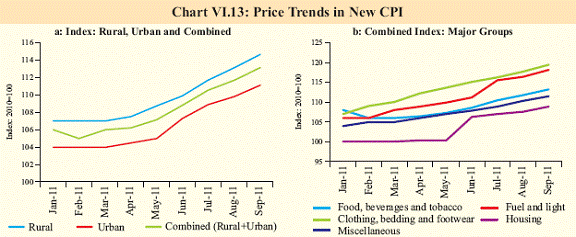
VI.20 Despite significant monetary tightening, inflation remains stubbornly high, reflecting partly the greater role of other input costs relative to interest costs in the corporate sector. The relative share of interest costs in total costs has remained largely unchanged over recent quarters, that too at a low level (Chart VI.11). CPI and WPI inflation converge reflecting broad based price pressures VI.21 Various measures of CPI inflation remained in the range of 9.0-9.4 per cent in August/September 2011. The convergence of various measures of CPI inflation with WPI inflation reflects broad based price pressures (Chart VI.12). VI.22 The new CPI introduced for urban and rural areas along with a composite All-India CPI also suggest the build-up in price pressures (Chart VI.13). Trends in these indices since inception in January 2011 indicate that the price pressures have been relatively more in rural areas as compared to the urban areas. Also among the major groups, price increases have been more significant in textiles and fuel.
Inflation softening expected in the later part of the year, but risks remain VI.23 The inflation path so far has been sticky and may remain so over the next few months. In the absence of significant anti-inflationary monetary policy actions, inflationary pressures could have been higher. Despite a normal monsoon this year and record production of foodgrains last year, food price inflation may not moderate much in an environment of increase in rural wages, significant increase in MSPs and persistent input cost pressures in the farm sector. Moderation in international crude prices may not translate into lower inflation in the fuel group, due to incomplete pass-through in the past as also the inflationary impact of rupee depreciation given the high import dependence in oil.
VI.24 Moderation in non-food manufactured products inflation in the second half could be conditioned by softening of demand resulting from past monetary policy actions as also the spillover from weaker global growth momentum. While softening of input cost pressures could imply weaker transmission to non-food manufactured products, exchange rate depreciation would partly offset the magnitude of softening. For the conduct of monetary policy the outlook for inflation as also private consumption and investment demand would be critical. Current assessment of drivers of inflation suggests moderation of inflation in the later part of 2011-12.
|
|||||||||||||||||||||||||||||||||||||||||||||||||||||||||||||||||||||||||||||||||||||||||||||||||||||||||||||||||||||||||||||||||||||||||||||||||||||||||||||||||||||||||||||||||||||||||||||||||||||||||||||||||||||||||||||||||||

Share this page:


Install the RBI mobile application and get quick access to the latest news!
Scan the QR code to install our app


Page Last Updated on:


