VI. The External Economy - RBI - Reserve Bank of India
VI. The External Economy
Recent international economic developments have brought about a revision in the global economic outlook. Weakening of domestic demand and output in the US and emerging Asia and the absence of any perceptible improvement in economic activity in the Euro area and Japan have raised fears of a global slowdown. A positive development, however, was the moderation in oil prices from the peak in September 2000, although it is unclear at this stage whether the downturn in oil prices would continue. Therefore, projections of world output growth at 4.8 per cent in 2000 and 3.4 per cent in 2001 have to be tempered with downside risks mainly in the form of macroeconomic and financial imbalances among the major reserve currency areas, inflationary consequences of the hike in oil prices, volatility in equity markets and developments relating to the US economy. World trade is projected to increase by 12.3 per cent in 2000 and 7.4 per cent in 2001 (as against 5.3 per cent in the previous year) while net capital flows to emerging market economies are projected to decline sharply reflecting sizeable debt repayments and a large reduction in banks' external exposure, particularly to Asia.
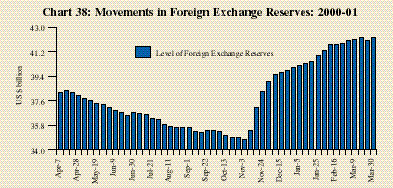
External sector developments in the Indian economy during 2000-01 were significantly influenced by high international crude prices and the global economic environment. Uncertainty surrounding the equity markets in India affected portfolio inflows. Therefore, despite a robust growth of merchandise exports, software and private remittances, the balance of payments (BoP) came under pressure during the first half of 2000-01. Funds mobilised by the State Bank of India (SBI) under India Millennium Deposits (IMDs) brought about a turnaround, rejuvenating capital inflows in general. Reserve losses during the first seven months of 2000-01 (US $ 3.1 billion) were more than offset by the accretion during November 2000-March 2001 resulting in an overall increase of US $ 4.2 billion in the level of international reserves during 2000-01 (Chart 38).
|
Merchandise Trade
According to the provisional data released by the Directorate General of Commercial Intelligence and Statistics (DGCI&S), the trade deficit during April 2000-February 2001 narrowed to US $ 5.8 billion from US $ 8.7 billion during the corresponding period of the previous year, driven by strong export growth which offset the higher oil import bill.
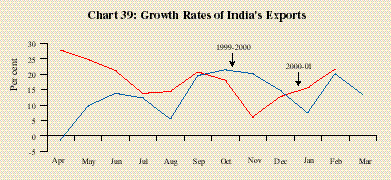
The export recovery that started during 1999-2000 gained further momentum during the year as exports recorded an increase of 18.7 per cent during the first eleven months of 2000-01 on top of an increase of 11.1 per cent during the corresponding period of the previous year. The expansion in exports gathered pace in July-September, 2000; although this was interrupted by some moderation in November, 2000 the upturn in export growth resumed in December, 2000 (Chart 39). The increase in India's exports during 2000-01 was mostly on account of manufactured products, mainly engineering goods, leather and manufactures, chemicals and allied products and petroleum products. Exports to the USA, Japan and the UAE rose significantly during 2000-01.
|
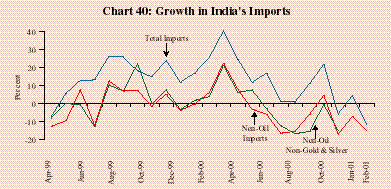
India's imports also increased significantly during 2000-01 (April-February) mainly due to oil imports which surged by 65.9 per cent (Chart 40). International crude oil prices increased by 38 per cent and 63 per cent during 1999 and 2000, respectively. Non-oil imports, on the other hand, declined by 7.4 per cent. The fall in non-oil imports was mainly on account of the decline in the imports of gold and silver, bulk consumption goods and fertilisers. Excluding these three categories, non-oil imports during 2000-01 (April-December) declined by 0.1 per cent over the corresponding period of the previous year.
|
Current Account
The merchandise trade deficit, on BoP basis, was higher at US $ 13.2 billion during the first three quarters of 2000-01 than that of US $ 11.4 billion during the corresponding period of the 1999-2000. Invisible earnings continued to be an important source of support to the BoP. The surplus on the invisibles account rose from US $ 8.3 billion during the first nine months of fiscal 1999-2000 to US $ 9.2 billion during the first three quarters of 2000-01. Major sources of invisible inflows were software exports (an increase of US $ 1.7 billion to US $ 4.6 billion) and private transfers (an increase of US $ 0.9 billion to US $ 9.8 billion). These were partly offset by higher outgoes on account of travel and transportation (an increase of US $ 0.9 billion to US $ 4.4 billion) and investment income payments (an increase of US $ 0.5 billion to US $ 4.5 billion). In the face of a sizeable widening of the trade deficit, the increase in the invisible surplus helped to contain the current account deficit at US $ 4 billion during April-December 2000 as against US $ 3.1 billion during April-December 1999. It is expected that sustained growth in exports and invisible receipts would keep the current account deficit for 2000-01 at close to 1 per cent of GDP.
Capital Account
In the capital account, the shortfall in normal capital flows was supplemented by inflows of US $ 5.5 billion under India Millennium Deposits (IMDs) launched by the State Bank of India (SBI) during October-November 2000.
Foreign investment inflows stood at US $ 3.3 billion during April 2000 -February 2001 as against US $ 4.4 billion during April 1999 - February 2000 on account of uneven movements in FII flows. Foreign direct investment (FDI) inflows were higher at US $ 2.4 billion than those of US $ 1.9 billion during the same period of the previous year. Amounts raised under ADRs/GDRs of US $ 0.7 billion were broadly the same as during April 1999-February 2000. There was an inflow of US $ 0.1 billion on account of FIIs during April-February 2001 as against an inflow of US $ 1.8 billion during the corresponding period of 1999-2000. Net inflows under non-resident Indian (NRI) deposits of US $ 1.5 billion were also lower than those of US $ 2.0 billion during April 1999-February 2000, reflecting some switching effects related to IMDs. To the extent that these switches were out of FCNR(B) deposits held abroad, there were inflows into the country.
There was a net outflow of US $ 1.1 billion under medium and long-term loans (external assistance and commercial borrowings (excluding IMDs)) during April-December 2000 as against an inflow of US $ 0.4 billion during the corresponding period of 1999. Net flows by way of short-term credits, on the other hand, increased from US $ 0.2 billion during April-December 1999 to US $ 0.5 billion during April-December 2000 reflecting the need to finance higher oil imports.
Reserves
The foreign exchange reserves comprising foreign currency assets, gold and special drawing rights (SDRs) declined by US $ 3.1 billion from US $ 38.0 billion at end-March 2000 to US $ 34.9 billion by end-October 2000. From November, 2000 onwards, the drawdown was fully recouped as the level of reserves rose by US $ 7.3 billion to US $ 42.3 billion as at end-March 2001. The increase in reserves was led by the proceeds under IMDs, merchandise exports, software exports, private transfers and FDI inflows.


