VI. The External Economy - RBI - Reserve Bank of India
VI. The External Economy
International Developments
Merchandise Trade
Invisibles and Current Account
Capital Account
Foreign Exchange Reserves
External Debt
The Indian economy posted significant gains in the external sector during the year despite an international environment characterised by hesitant recovery of global output and trade and heightened risk aversion in financial markets. India emerged as among the fastest growing exporting countries in the world in 2002. Driven by the robust merchandise export performance and the highest ever net invisible earnings in any year, the current account balance recorded a larger surplus in 2002-03 than in 2001-02, despite a reasonably well-distributed pickup in imports. Net capital flows remained stable, particularly non-resident deposits. There were net outflows under long and medium-term commercial debt, reflecting the consolidation of external debt. These salutary developments resulted in a record accretion to foreign exchange reserves, the third largest increase among the emerging market economies (EMEs) during 2002-03 (Chart 66). India is currently the sixth largest reserve holding country among the EMEs.
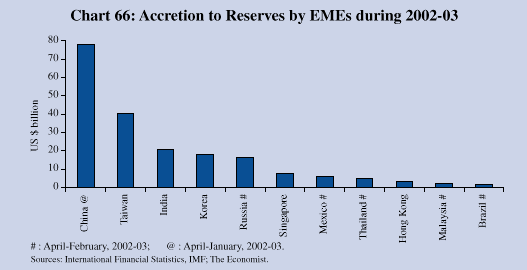
The large improvement in the external position is unprecedented in India’s own history. Available information on the balance of payments indicates that a substantial portion of the accretion to reserves was by way of merchandise and software exports, private remittances and non-debt creating capital including repatriation of past export proceeds as well as advance export receipts which entail no future contractual obligation to service and are mostly non-reversible. The accretion to reserves occurred without increasing external debt and at a relatively low cost.
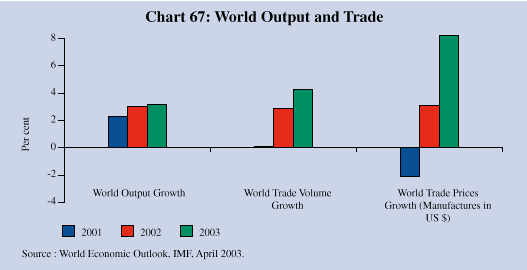
Global economic activity rose in 2002, though at a moderate pace as the strength of the growth observed in the first quarter could not be sustained towards the end of the year. Major equity markets declined for the third consecutive year in 2002 and equity prices fell by 40-60 per cent in relation to their early 2000 peaks. Bond yields and credit spreads generally reflected concerns relating to corporate earnings and undermining of investor confidence despite an accommodative monetary policy stance in major advanced countries. World output is estimated to have grown by 3.0 per cent during 2002, higher than that of 2.3 per cent during 2001. The emerging Asian economies exhibited strong growth at about 6.3 per cent in 2002, driven by improvement in both exports and domestic demand. World trade volume growth recovered from almost no increase in 2001 to 2.9 per cent in 2002. World trade prices also improved (Chart 67).
Private capital flows to EMEs recovered during 2002 (Chart 68). Region-wise, private capital flows to developing Asia increased to US $ 69.5 billion, which is the highest level achieved since 1996.
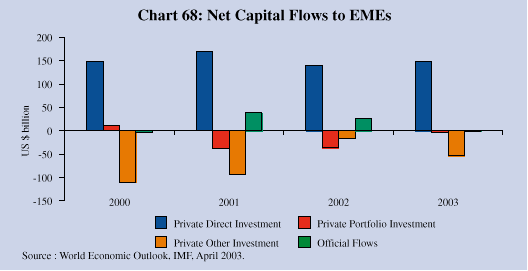
For 2003, the International Monetary Fund (IMF) projects world output growth to recover further to 3.2 per cent on the back of a turn in the inventory cycle, ebbing of the delayed effects of the bust in the equity markets and a continuation of the current monetary policy stance. International trade volumes and prices are expected to strengthen further in 2003. Downside risks to this outlook are the uncertainty in the aftermath of the war in Iraq, the volatility in international oil prices and a further decline in asset prices. IMF projections suggest that emerging Asia may maintain its growth performance in 2003, although the external environment may be less favourable for sustaining export growth. A moderation in the investor appetite for emerging market assets may affect the prospects of private capital flows to the emerging market economies in 2003; such flows to developing Asia are projected to decline to US $ 18.4 billion on account of outflows under portfolio and other investments.
Merchandise Trade (DGCI&S Data)
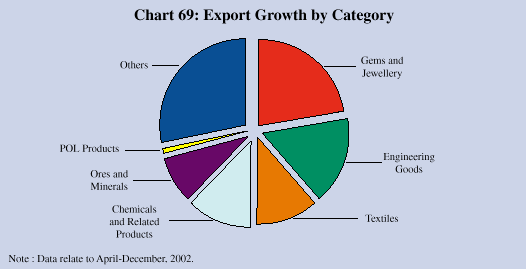
Provisional data of the Directorate General of Commercial Intelligence and Statistics (DGCI&S) indicate a vigorous recovery of merchandise exports from a slump in the preceding year. Export growth of 16.7 per cent during April-February 2002-03 was broad-based, led by ‘gems and jewellery’, engineering goods, ‘chemicals and related products’, textiles and ‘ores and minerals’ (Chart 69). In terms of markets, export growth was mainly to the USA, the Organisation of Petroleum Exporting Countries (OPEC), the European Union and Singapore.
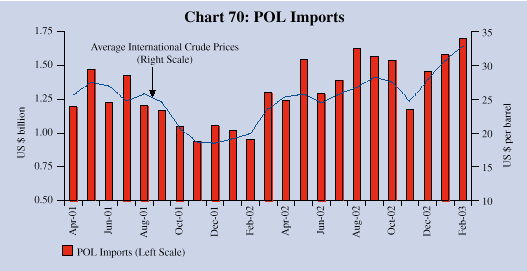
Merchandise imports increased by 16.3 per cent in 2002-03 (April-February) from a marginal increase of 0.8 per cent during the corresponding period of the previous year. Both oil and non-oil imports contributed to higher overall imports. POL imports increased by 26.5 per cent, largely on account of the hardening of international crude prices to an average of US $ 27.3 per barrel during 2002-03 (April-February) from US $ 22.9 per barrel during the corresponding period of 2001-02 (Chart 70).
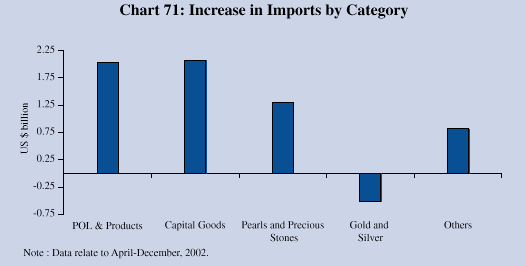
Non-oil import growth at 12.5 per cent reflected the pick-up in domestic industrial activity. Capital goods imports and export-related imports were the major elements in the expansion of non-oil imports (Chart 71). With gold and silver imports recording a decline of 13.3 per cent in response to the hardening of international prices, non-oil non-gold imports recorded an increase of 17.6 per cent during April-December 2002. Country-wise, major sources of non-oil import growth during April-December 2002 were the European Union (largely Belgium) followed by non-SAARC Asian developing countries and the USA.
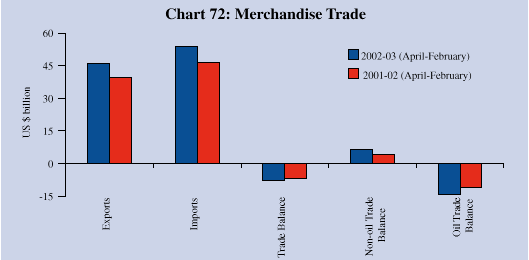
Reflecting higher imports, the merchandise trade deficit, on DGCI&S basis, increased to US $ 7.8 billion during 2002-03 (April-February) from US $ 6.8 billion during the corresponding period of 2001-02 (Chart 72).
Invisibles and Current Account
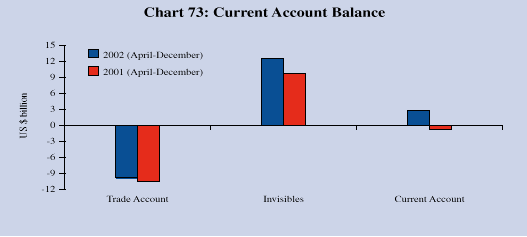
The buoyancy in the invisible account was sustained as the net invisible surplus (on account of transactions in services, transfers and income) increased to US $ 12.6 billion during April-December 2002. The higher surplus was mainly due to exports of business services, software and private transfers, partly offset by investment income payments for the servicing of external liabilities.
With the merchandise trade deficit (on balance of payments basis) contracting and the increased invisible surplus, the current account balance moved into a surplus of US $ 2.8 billion during April-December 2002 from a deficit of US $ 0.7 billion during the corresponding period of 2001 (Chart 73).
Net capital flows increased from US $ 5.9 billion during April-December 2001 to US $ 9.8 billion during April-December 2002. Positive exchange rate expectations, a freer trade and payments regime, burgeoning international reserves and improving fundamentals provided a congenial environment for larger inflows.
Amongst the major components, foreign investment flows, both direct and portfolio, were lower than in the previous year. Outflows under external commercial borrowings increased further as the appetite for external finance remained subdued, partly on account of ample domestic liquidity. Non-resident deposits were marginally higher than in the previous year (Chart 74). Short-term credits rose in line with the increase in POL imports.
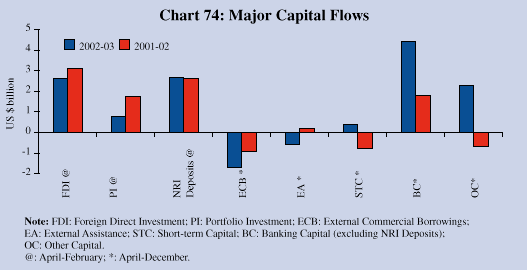
The surpluses in the current and capital accounts led to an overall balance of payments surplus of US $ 12.7 billion during April-December 2002, more than double that in the corresponding period of 2001.
The foreign exchange reserves increased by US $ 21.3 billion during 2002-03 on top of an increase of US $ 11.8 billion during 2001-02 (Chart 75). At US $ 75.4 billion, the level of reserves was equivalent to more than a year’s imports. The increase in reserves was almost entirely on account of foreign currency assets despite prepayment of the multilateral debt amounting to US $ 3.0 billion. Gold holdings of the Reserve Bank increased by US $ 0.5 billion. Currency valuation effects arising from the realignment of the US dollar with other major currencies accounted for US $ 3.9 billion of the nominal reserve accretion during 2002-03. Accretion to the reserves continued in April 2003 with their level reaching US $ 76.1 billion on April 18, 2003.
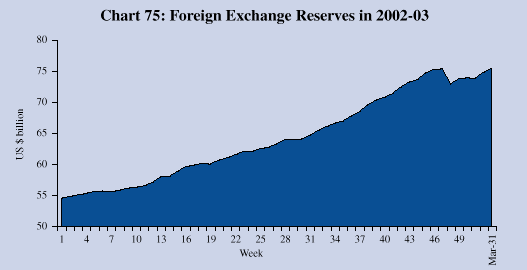
The sharp increases in the reserves in the recent period have raised issues about the costs and benefits of reserves. The financial cost of additional reserve accretion is estimated to be low. These costs are likely to be more than offset by the return on additional reserves. Furthermore, high reserves have provided important benefits in the form of precautionary lines of defence against unforeseen external shocks, the welfare gains from smoothing domestic consumption and investment, and the more visible benefits of ensuring financial stability despite an unsatisfactory international environment.
External debt increased by US $ 3.5 billion during April-September 2002 mainly on account of non-resident deposits and official aid (Chart 76).
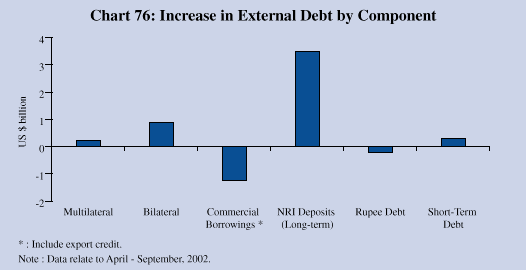
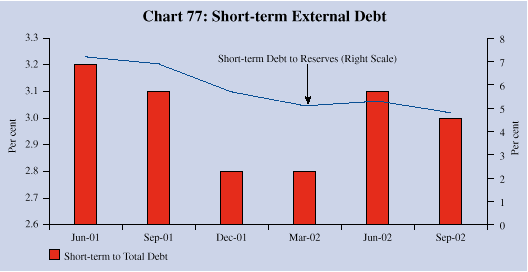
The external debt-GDP ratio is estimated to have declined from 20.9 per cent at end-March 2002 to 20.1 per cent at end-September 2002. The ratio of short-term debt to total debt as well as to total reserves continued to remain comfortable (3.0 per cent and 4.8 per cent, respectively) at end-September 2002 (Chart 77).
The strength of the foreign exchange reserves enabled the prepayment of foreign currency loans from the Asian Development Bank (ADB) and the World Bank amounting to US $ 3.0 billion in February 2003 by the Government of India. This would be reflected in a moderation of the ‘multilateral’ component in the stock of external debt at the end of March 2003.


