 IST,
IST,
VI. The External Economy
| International Developments |
| Merchandise Trade |
| Invisibles and Current Account |
| Capital Account |
| External Debt |
External sector developments were dominated by the dramatic escalation of international crude oil prices from the beginning of 2004-05 and their persistence at elevated levels with high volatility through the year. For India, as in many other parts of the world, the soaring crude oil prices translated into a massive increase of imports and an upsurge of inflationary pressures. Nervous sentiment pervading world oil markets fuelled considerable uncertainty about the prospects for global growth itself. Fortuitously, the global recovery, which has been underway since 2003, remained resilient and gathered momentum during 2004 undeterred by the oil price shock.
In this tumultuous environment, the innate strengths of India's external sector came to the fore, reflecting increasingly the robust macroeconomic fundamentals. India turned out to be one of the fastest growing merchandise exporters of the world with considerable support from buoyant invisible earnings . These current receipts enabled a comfortable absorption of the expansion in import payments on account of the oil price shock as well as the augmented input requirements of the domestic industrial recovery. India's strong macroeconomic performance in a period of generalised uncertainty invigorated international investor confidence and enhanced the attractiveness of the Indian economy as a preferred habitat for private capital flows.
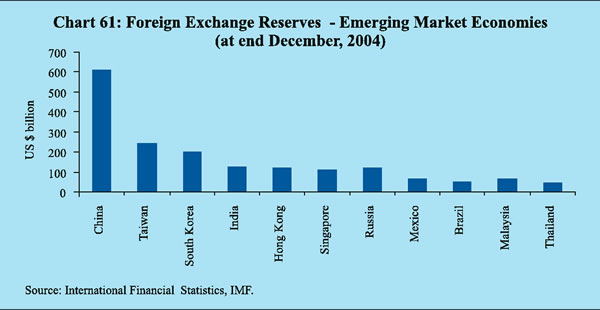
These developments produced significant shifts in India's balance of payments. The current account balance swung from a continuous run of surpluses between 2001-02 and 2003-04 into a modest deficit during 2004-05 . In the capital account, surges of portfolio flows occurred for the second successive year, taking India's share in global portfolio flows to emerging market economies (EMEs) to about 25 per cent in 2004, the second largest among EMEs. Direct investment flows also picked up to provide support to the balance of payments, with foreign exchange reserves rising to US $ 141. 5 billion on March 31, 2005. At the end of December 2004, India's foreign exchange reserves (excluding gold) were the fifth largest in the world and the fourth largest among EMEs (Chart 61) .
International Developments
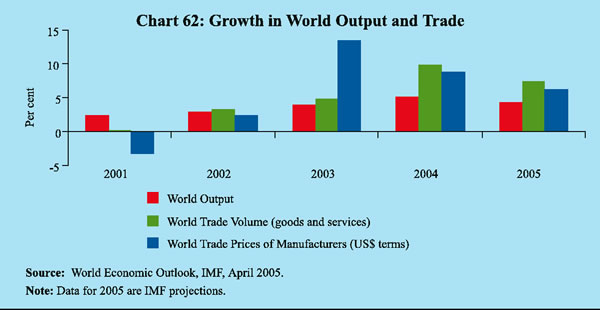
The global economy continued to expand at a robust pace during 2004, although the rate of growth moderated from the exceptionally high levels observed at the beginning of the year. Aided by strong growth in industrial countries and rapid expansion in emerging economies such as China and India, world output is projected to have risen by 5.1 per cent in 2004, the highest after 1976 (Chart 62).
Among the advanced economies, while economic activity in the United States turned robust, growth moderated in Japan and the UK. In the US, GDP growth was placed at 4.4 per cent in 2004, led by private investment and household consumption.
The US trade deficit widened to over US $ 617 billion in 2004 from around US $ 496 billion a year ago, mainly due to an increase in the volume of imports of oil products and a decline in external demand for US capital goods. The US fiscal deficit also climbed to 4.5 per cent of GDP in 2004; this exerted downward pressure on the US dollar which depreciated by 9.4 per cent against the Euro and 6.7 per cent against the Japanese Yen. Despite these constraints and the upward movement of long-term yields, the US has been successful so far in withdrawing its accommodative monetary policy stance through successive hikes in the target Federal Funds Rate at a measured pace.
By contrast, growth moderated in the Euro area and the UK dampened by subdued investor sentiment and limited household spending, with external demand embodied in rising export demand from developing countries providing the main sustenance to growth. The European Central Bank, in fact, downgraded its projection of economic growth during 2005 to 1.2-2.0 per cent in February 2005 from 1.4-2.4 per cent in December 2004 and 1.8-2.8 per cent in September 2004. In Japan, economic recovery lost momentum by the final quarter of 2004. Exports to developing countries provided the main stimulus to growth. The turnaround out of deflation was, however, fragile and real GDP growth was placed at 2.6 per cent for the full year 2004. Amongst the EMEs, the developing Asia group is projected to have grown by 8.2 per cent in 2004, over and above 8.1 per cent in the preceding year. Despite monetary tightening measures, Chinese economic growth continued to expand at 9.5 per cent in 2004, which was comparable to 9.3 per cent in the preceding year. Latin America saw broad-based economic growth driven by exports and domestic demand.
According to the World Bank, world trade volume recorded a growth of 10.2 per cent during 2004. The robust expansion in demand for raw materials in a number of developing countries led by China, the sustained demand expansion in the US and modest economic recovery in other major industrialised countries led to the expansion in trade volume. In US dollar terms, world merchandise exports recorded a growth of 20.3 per cent during the first ten months of 2004 as compared with 15.5 per cent in the same period of 2003. Exports from the Asian region, led by Korea, India and China grew faster than world trade (Table 25). Apart from volume growth, this also reflected the continued increase in commodity prices. Global commodity prices in US dollar terms increased by 17 per cent in 2004 (10.2 per cent in 2003).
|
Table 25 : Growth in Merchandise Exports – Global Scenario |
|||
|
Region/ Country |
2003 |
2003 |
2004 |
|
(January-October) |
|||
|
1 |
2 |
3 |
4 |
|
World |
1 6 . 2 |
1 5 . 5 |
2 0 . 3 |
|
Industrial Countries |
1 4 . 6 |
1 4 . 0 |
1 7 . 1 |
|
US |
4 . 6 |
3 . 3 |
1 3 . 4 |
|
Germany |
2 2 . 7 |
2 2 . 5 |
2 1 . 1 |
|
Japan |
1 3 . 2 |
1 2 . 5 |
2 0 . 9 |
|
Developing Countries |
1 8 . 8 |
1 7 . 9 |
2 5 . 3 |
|
China |
3 4 . 6 |
3 2 . 7 |
1 9 . 5 |
|
India |
1 6 . 3 |
1 1 . 7 |
2 8 . 1 |
|
Korea |
1 9 . 3 |
1 7 . 9 |
3 3 . 1 |
|
Singapore |
1 5 . 2 |
1 4 . 4 |
2 4 . 9 |
|
Indonesia |
8 . 3 |
8 . 3 |
1 0 . 3 |
|
Malaysia |
1 1 . 5 |
1 0 . 6 |
2 1 . 8 |
|
Thailand |
1 8 . 0 |
1 7 . 0 |
2 1 . 1 |
|
Source : International Financial Statistics, IMF. |
|||
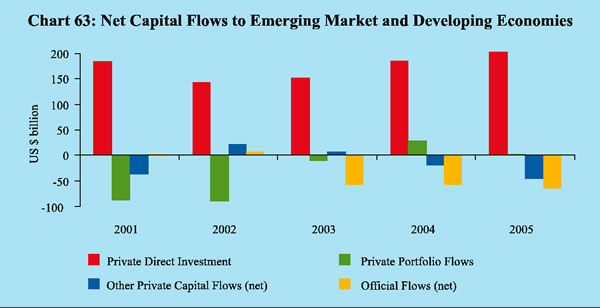
Private direct investment flows to emerging and developing economies are estimated to have increased from US $ 149.5 billion in 2003 to US $ 196.6 billion in 2004. On the other hand, while private portfolio flows have increased, other (net) flows, private as well as official, to emerging market and developing economies are expected to have declined in 2004 (Chart 63).
The International Monetary Fund (IMF) has projected world output growth at 4.3 per cent for 2005, down from 5.1 per cent in 2004. Potential risks to the prospects for growth are global imbalances and consequent disorderly exchange rate movements, reversal of global capital flows from emerging and developing economies in the case of a realignment of interest rates, slow investment growth on account of higher interest rates with tightening of monetary policy stance by leading central banks, slowdown of growth in China and moderation of demand on account of a rise in oil prices. According to the World Bank, the hike in oil prices already observed can be expected to dampen output in 2005 by about 0.5 per cent of world GDP. The rising and volatile oil prices continue to be a major risk for global growth.
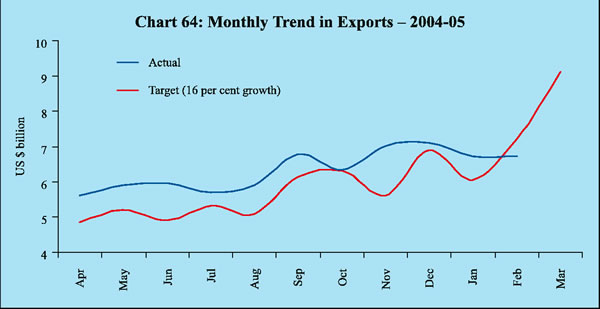
According to the Directorate General of Commercial Intelligence and Statistics (DGCI&S), India's export growth at 27.1 per cent during the first eleven months of the current fiscal year (April-February 2004-05) was substantially higher than the annual target of 16 per cent for 2004-05 set by the Government of India (Chart 64).
The improvement in export performance was broad-based (Table 26). Exports of primary products recorded a sharp increase of 24.7 per cent during April-January 2004-05 with significant contributions from agricultural commodities (viz., tea, tobacco, cashew, spices and oil meal) and ores and minerals. Exports of manufactured products accelerated to record a growth of 22.2 per cent during the period. Gems and jewellery, engineering goods, and chemicals and related products were key drivers. Exports of petroleum products surged by 92.4 per cent. Exports of handicrafts, however, declined.
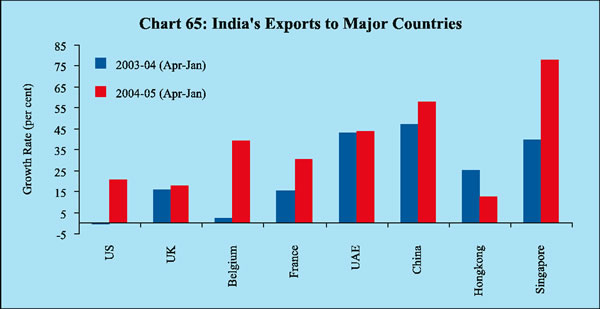
Within the overall expansion, India's exports were well diversified in terms of destination. Exports to the European Union, the OPEC and developing countries of Asia, Africa and Latin America posted a significant increase. Among the major
|
Table 26 : Merchandise Exports – April-January |
||||||
|
Commodity Group |
US $ |
billion |
Variation |
(per cent) |
||
|
2003-04 |
2004-05 |
2003-04 |
2004-05 |
|||
|
1 |
2 |
3 |
4 |
5 |
||
|
1. |
Primary Products |
7 . 6 |
9 . 5 |
5 . 0 |
2 4 . 7 |
|
|
2. |
Manufactured Goods |
3 7 . 8 |
4 6 . 3 |
1 5 . 3 |
2 2 . 2 |
|
|
of |
which: |
|||||
|
a. |
Chemicals and Related Products |
7 . 3 |
9 . 5 |
1 9 . 1 |
2 9 . 3 |
|
|
b. |
Engineering Goods |
9 . 7 |
1 2 . 9 |
3 3 . 8 |
3 3 . 0 |
|
|
of |
which: |
|||||
|
Metals |
1 . 9 |
2 . 6 |
2 6 . 4 |
3 4 . 3 |
||
|
Machinery and Instruments |
2 . 2 |
2 . 7 |
3 4 . 2 |
2 1 . 2 |
||
|
Transport Equipments |
1 . 5 |
2 . 3 |
5 1 . 1 |
4 9 . 9 |
||
|
Iron and Steel |
1 . 9 |
2 . 8 |
3 2 . 6 |
5 0 . 2 |
||
|
Electronic Goods |
1 . 4 |
1 . 4 |
3 4 . 9 |
1 . 3 |
||
|
c. |
Textiles |
9 . 5 |
9 . 8 |
5 . 7 |
3 . 0 |
|
|
d. |
Gems and Jewellery |
8 . 2 |
1 0 . 7 |
1 1 . 9 |
3 0 . 2 |
|
|
3. |
Petroleum Products |
2 . 9 |
5 . 5 |
4 9 . 6 |
9 2 . 4 |
|
|
4. |
Total Exports |
4 9 . 7 |
6 3 . 2 |
1 6 . 4 |
2 7 . 0 |
|
|
Source: DGCI&S. |
||||||
partner countries, exports to the US, the UK, Belgium, France, UAE, China, Hong
Kong and Singapore recorded significant increases (Chart 65). The destination
pattern of exports is gradually shifting in favour of developing Asian countries
with China accounting for the major share.
Imports grew strongly by 36.4 per cent during 2004-05 (April-February) mainly due to a surge in oil imports by 44.6 per cent following a rise in international crude oil prices (Chart 66). The average ‘Indian basket’ comprises about 57 per cent 'sour' variety (benchmarked by Dubai crude) and 43 per cent 'sweet' variety. The average crude prices for the Dubai variety rose sharply during April-February 2004-05 to US $ 35.7 per barrel from an average of US $ 26.6 per barrel during
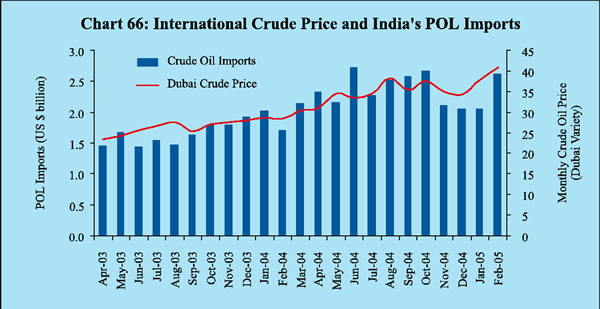
the corresponding period of the previous year. In volume terms, oil import growth slowed down to 5.3 per cent during April-January 2004-05 as compared with 9.9 per cent in the same period of the previous year.
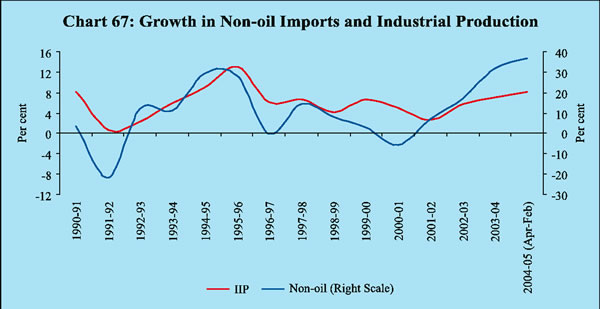
The value of non-oil imports increased by 33.3 per cent during April-February 2004-05 on top of a rise of 28.8 per cent during the corresponding period of the previous year, providing lead indication of the strengthening of industrial activity (Chart 67). In fact, non-oil non-gold and silver imports increased by 33.8 per cent during April-January 2004-05.
Imports of 'mainly industrial inputs' led the surge, growing by 36.8 per cent during April-January 2004-05 on top of the increase of 24.8 per cent in the previous year (Table 27) . Among other major items , gold and silver increased sharply, while bulk consumption goods, especially edible oil and pulses, declined. Source-wise, imports from the OPEC, Eastern Europe and Asian countries grew sharply.
|
Table 27 : Merchandise Imports: April-January |
||||||
|
Commodity Group |
US $ |
billion |
Variation (per cent) |
|||
|
2003-04 |
2004-05 |
2003-04 |
2004-05 |
|||
|
1 |
2 |
3 |
4 |
5 |
||
|
1. |
POL |
1 6 . 7 |
2 4 . 0 |
1 6 . 5 |
4 3 . 8 |
|
|
2. |
Edible Oils |
2 . 1 |
1 . 9 |
4 4 . 4 |
-8.3 |
|
|
3. |
Iron and Steel |
1 . 2 |
2 . 0 |
5 1 . 8 |
6 9 . 8 |
|
|
4. |
Capital Goods |
1 3 . 7 |
1 8 . 1 |
3 0 . 1 |
3 2 . 1 |
|
|
5. |
Pearls, Precious and Semi-Precious Stones |
5 . 8 |
7 . 2 |
1 5 . 5 |
2 4 . 3 |
|
|
6. |
Chemicals |
3 . 3 |
4 . 4 |
3 0 . 3 |
3 4 . 7 |
|
|
7. |
Gold and Silver |
5 . 4 |
8 . 7 |
5 0 . 9 |
6 0 . 8 |
|
|
8. |
Total Imports |
6 2 . 3 |
8 6 . 5 |
2 4 . 3 |
3 8 . 8 |
|
|
Memo Items: |
||||||
|
Non-Oil imports excluding gold and silver |
4 0 . 2 |
5 3 . 7 |
2 4 . 8 |
3 3 . 8 |
||
|
Mainly Industrial Imports* |
3 6 . 1 |
4 9 . 4 |
2 4 . 8 |
3 6 . 8 |
||
|
*:Non oil imports net of gold and silver, bulk consumption goods, manufactured
fertilisers |
||||||
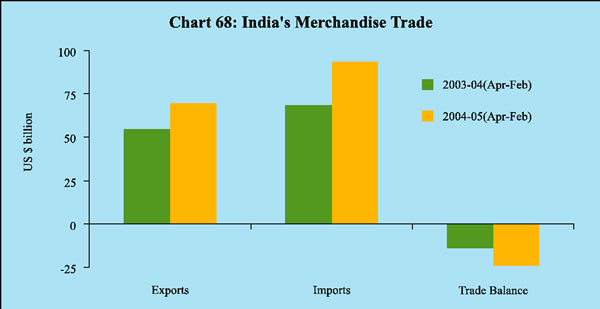
The trade deficit during April-February 2004-05 widened to US $ 23.8 billion from US $ 13.7 billion during the corresponding period of 2003-04 (Chart 68).
Invisibles and Current Account
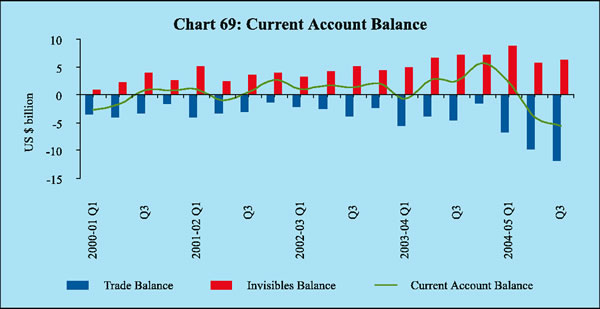
Surpluses on account of invisible transactions have financed a significant portion of the merchandise trade deficit that has traditionally characterised India's balance of payments. Through 2001-04, sizeable invisible surpluses comfortably financed the merchandise trade gap and spilled over into current account surpluses. Invisible receipts increased by 37.5 per cent during April-December 2004 over the corresponding period of the previous year. The key drivers of invisibles receipts were travel earnings, software exports and workers' remittances. Travel receipts reflected the jump in tourist arrivals by 24 per cent. India is fast emerging among the top ten tourism exporting countries of the world. Software exports, in which India is a world leader, continued to be buoyant on the back of sustained growth in industrial countries. According to the NASSCOM, Indian software and services exports are likely to have recorded 35 per cent growth to reach revenues of US $ 17.3 billion in 2004-05. Private transfers, representing overseas workers' remittances, were placed at US $ 15.8 billion in April-December 2004. In 2003-04, India was the world's leading recipient of remittances, accounting for 20 per cent of global flows. This position is expected to be maintained in 2004-05. Invisible payments, however, recorded a sharp rise of 62.3 per cent during April-December 2004 mainly on account of increased payments for travel, transportation, insurance and other business services. While the higher outgo on travel payments emanated from the rapid expansion in outbound tourists from India, transportation and insurance payments reflected mainly the expansion in merchandise trade. The sharp expansion in payments for other business services, particularly communication services, construction services, financial services, royalties, copyrights and license fees, and management services is in consonance with the ongoing technological transformation of the economy and the modernisation of Indian industry.
Despite the support from invisible earnings, the expansion in invisible payments coupled with a record level of the trade deficit led to a current account deficit to the tune of US $ 7.4 billion during the first three quarters of 2004-05 after a phase of current account surpluses ruling from 2001-02 to 2003-04 (Chart 69). The resurgence of a current account deficit in India's balance of payments augurs well for the growth of the economy. It marks the cessation of a period of net capital exports and signals an investment scenario in which net foreign saving can supplement domestic saving to achieve desired rates of investment and growth.
Capital Account
Net capital flows during 2004-05 were dominated by foreign investment. Portfolio flows brought in by foreign institutional investors (FIIs) went through significant shifts in the early part of the year before cumulating into a surge that was interrupted only briefly in the early part of January 2005. The appetite for investing in India was also shared by foreign direct investors who responded positively to the ongoing liberalisation. Drawing strength from the strong investor enthusiasm and credit rating upgrades, Indian entities expanded their access to international capital markets through foreign currency convertible bonds, trade credits and external commercial borrowings. Even as net outflows continued under non-resident Indian (NRI) deposits, banks compensated for the shrinkage in foreign currency funds by borrowing overseas and drawing down nostro balances.
Net capital inflows at US $ 20.7 billion during April-December 2004 were higher by 25 per cent as compared with US $ 16.6 billion recorded in the corresponding period of the previous year. The major contributors to the capital account surplus were foreign investment, short-term trade credit, external commercial borrowings and other capital, while NRI deposits recorded net outflow (Table 28) .
Inflows in the form of foreign direct investment (FDI) into India (which also includes equity capital of unincorporated entities, reinvested earnings and inter-corporate debt transactions between the related entities) picked up t o US $ 4.1 billion during April-December 2004 from US $ 3.4 billion during April-December 2003. The services sector was the largest recipient of FDI inflows. Mauritius remained the largest source of FDI flows to India, followed by the US, the Netherlands and Germany. The improvement in FDI reflects the recent initiatives taken to create an enabling environment for FDI and infusion of new technologies and management practices. The Union Budget for 2004-05 raised the sectoral caps on FDI in telecom (from 49 per cent to 74 per cent), and in air transport services (domastic airlines) up to 49 per cent from 40 per cent.
India's outward FDI flows increased rapidly from US $ 757 million in 2000-01 to US $ 1.3 billion in 2003-04 and US $ 1.9 billion in the first three quarters of 2004-05. Indian FDI is mostly in manufacturing, although FDI in IT services has begun to grow rapidly, particularly through mergers and acquisitions. The increasing competitiveness of Indian firms and their expanding global scan in a wide range of manufacturing, IT-related services and pharmaceuticals is driving the outward FDI surge. In recent years, Indian public sector entities have aggressively sought to acquire equity in the petroleum and gas sectors of key
|
Table 28 : Net Capital Flows into India |
|||
|
(US $ billion) |
|||
|
Item |
2004-05 |
2003-04 |
|
|
April-December |
|||
|
1 |
2 |
3 |
|
|
Total Capital Flows |
2 0 . 7 |
1 6 . 6 |
|
|
Of which: |
|||
|
Foreign Direct Investment |
2 . 2 |
2 . 5 |
|
|
Portfolio Investment |
5 . 1 |
7 . 6 |
|
|
Non-Resident Indian Deposits |
-1.3 |
3 . 7 |
|
|
Banking Capital, Excluding |
NRI Deposits |
3 . 0 |
2 . 1 |
|
External Commercial Borrowings |
4 . 1 |
-3.4 |
|
|
Short Term Trade Credits |
2 . 7 |
2 . 4 |
|
|
External Assistance |
0 . 7 |
-1.8 |
|
producer countries as a strategic initiative to manage the growing energy intensity
of the economy. This has emerged as a new engine of growth for Indian FDI overseas.
Access to markets, natural resources, distribution networks, foreign technologies
and strategic assets such as technology and brand names are the main motivations.
Ongoing liberalisation of the policy framework has provided a conducive environment
for FDI from India.
Inflows on account of foreign portfolio investment came off the peak level recorded in 2003-04 and turned into a net outflow of US $ 1.4 billion during the three-month period of May-July 2004. This phenomenon was observed across the Asian markets as FII activities remained subdued on account of global uncertainties caused by hardening of crude oil prices and edging up of international interest rates as several central banks began to exit fro m accommodative monetary policy stances . FII flows turned positive beginning August 2004 and in the subsequent period, there was a dramatic surge in net portfolio inflows into India, spurred by a positive growth outlook, improved corporate performance, upgradation of credit ratings and attractive returns on Indian stocks. The continued FII interest in India was also visible in the number of FIIs registered with the SEBI which increased to 685 by end-March 2005 with the total number of sub-accounts at 1,709. Investments by FIIs are well diversified. Moreover, FIIs also invested in mid-cap and small-cap stocks. Notwithstanding this surge for the second year in succession, valuation of Indian stocks remain attractive vis-a-vis other EMEs (Table 29).
In order to facilitate FII inflows, the registration procedure was simplified. The cumulative debt investment limit for FIIs was hiked to US $ 1.75 billion from US $ 1 billion. A cumulative sub-ceiling of US $ 500 million was fixed for FII investment in corporate debt over and above the sub-ceiling of US $ 1.75 billion for Government debt under the overall ECB ceiling.
|
Table 29 : Foreign Portfolio Investment Flows |
|||||
|
(US $ billion) |
|||||
|
Country |
Portfolio Inflows |
Price-Earnings Ratio |
|||
|
(Per cent) |
|||||
|
2002 |
2003 |
2004 |
2004 |
||
|
1 |
2 |
3 |
4 |
5 |
|
|
Chile |
1 . 0 |
1 . 7 |
0 . 1 |
1 6 . 8 |
|
|
Hong Kong |
-1.1 |
1 . 4 |
-0.2 |
1 6 . 1 |
|
|
India |
1 . 1 |
8 . 2 |
8 . 8 |
1 4 . 1 |
|
|
Philippines |
1 . 6 |
0 . 9 |
1 . 9 |
1 8 . 9 |
|
|
South Korea |
5 . 4 |
2 2 . 7 |
1 8 . 3 |
1 4 . 2 |
|
|
Thailand |
-0.7 |
0 . 9 |
0 . 5 |
8 . 5 |
|
|
Note :Data
for Chile, Hong Kong, the Philippines, South Korea and Thailand |
|||||
Indian corporates' recourse to ECBs was substantially higher in April-December
2004, which reaffirms the strong resumption of investment demand riding on the
back of growth in industrial production. The higher recourse to ECBs was also
facilitated by the narrowing down of spreads on emerging market bonds and upgrades
of sovereign rating by international credit rating agencies. In contrast to
the preceding two years which were characterised by large prepayments, external
assistance recorded net positive flows in 2004-05 due to lower repayment obligations.
Short-term trade credits rose strongly in tandem with the surge in import demand.
Net outflows from NRI deposits reached US $ 1.3 billion during April-December
2004 attributable to alignment of interest rates on such deposits with global
interest rates. The revision in interest rates on NRE deposits to LIBOR/ SWAP
rates of US dollar plus 50 basis points on October 26, 2004 brought in an inflow
of NRE deposits of US $ 207 million in November 2004, followed, however, by
a small net outflow in December 2004. The NR(NR)R deposits recorded an outflow
of US $ 927 million during April-December 2004. The Union Budget for 2005-06
proposes to continue the exemption from tax on interest earned on accounts maintained
by non-resident Indians.
The overall balance showed a surplus of US $ 13.5 billion during April-December 2004 as compared with US $ 21.4 billion in April-December 2003.
The strength of the external sector was reflected in a sizeable accumulation of India's foreign exchange reserves comprising foreign currency assets, gold, SDRs and the reserve position with the IMF which touched US $ 141.5 billion as on March 31, 2005. The accretion to the reserves of US $ 28.6 billion during 2004-05 was significant, occurring as it did on top of an unprecedented accretion of US $ 36.9 billion in 2003-04.
In terms of trade-related reserve adequacy indicators, India's foreign exchange reserves at about 15 months of imports are higher than those of several other EMEs in Asia (Table 30). India's ratio of short-term debt comfortably satisfies the adequacy criterion vis-à-vis other comparable countries. The level of reserves is higher than India’s overall external debt. In terms of total external liabilities, which include portfolio liabilities, India's reserves are broadly adequate.
The overall approach to the management of India's foreign exchange reserves in recent years reflects the changing composition of the balance of payments and the 'liquidity risks' associated with different types of flows and other requirements. The policy for reserve management is, thus, judiciously built upon a host of identifiable factors and other contingencies. Taking these factors into account, India's foreign exchange reserves continued to be at a comfortable level and consistent with the rate of growth, the share of the external sector in the economy and the size of risk-adjusted capital flows.
|
Table 30 : Reserve Adequacy Indicators |
|||||
|
(Per cent) |
|||||
|
Criterion |
India |
Korea |
Singapore |
Hong Kong |
|
|
1 |
2 |
3 |
4 |
5 |
|
|
Trade-related Indicators |
|||||
|
Import cover (months) |
1 4 . 8 |
1 1 . 4 |
1 0 . 5 |
5 . 6 |
|
|
Current payment cover |
1 0 . 8 |
8 . 7 |
7 . 7 |
4 . 4 |
|
|
Debt-related Indicators |
|||||
|
Reserves to external debt |
1 0 8 . 5 |
1 1 2 . 0 |
5 0 . 1 |
2 9 . 2 |
|
|
Reserves to short-term external debt |
1911.1 |
3 3 1 . 8 |
6 7 . 5 |
4 0 . 5 |
|
|
Reserves to total external liabilities |
6 1 . 2 |
4 5 . 2 |
2 5 . 6 |
1 5 . 0 |
|
|
Money-based Indicators |
|||||
|
Reserves to broad money |
2 6 . 2 |
2 1 . 8 |
1 5 4 . 3 |
4 2 . 3 |
|
|
Reserves to reserve money |
1 2 0 . 2 |
521.23 |
8 3 0 . 3 |
3 2 6 . 3 |
|
|
Macro Indicators |
|||||
|
Reserves to GDP |
1 7 . 6 |
2 5 . 7 |
9 1 . 5 |
7 5 . 3 |
|
|
Source : 1. International Financial Statistics, IMF. |
|||||
|
2. Websites of respective central banks. |
|||||
India's external debt at US $ 120.9 billion at end-December 2004 increased by US $ 9.2 billion over its end-March level of US $ 111.7 billion. Long-term debt increased by US $ 6.7 billion during the same period. Within long-term debt, multilateral debt recorded an increase of US $ 2.4 billion mainly due to the higher utilisation of World Bank loans, while bilateral debt increased by US $ 554 million. NRI debt increased by US $ 0.6 billion, while Rupee debt declined by US $ 0.3 billion (Chart 70 ). External commercial borrowings recorded the highest growth of US $ 3.3 billion following the increased access to international capital markets by Indian corporates.
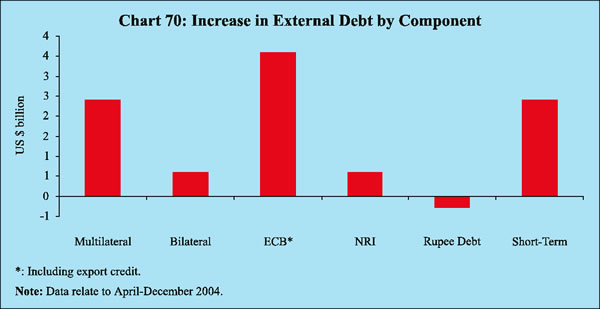
Short-term debt increased by US $ 2.4 billion on account of a surge in both oil and non-oil imports during April-December 2004. The short-term debt component of NRI deposits became nil, reflecting the impact of the policy decision to restrict NRE deposits to maturities of more than one year with effect from April 29, 2003.
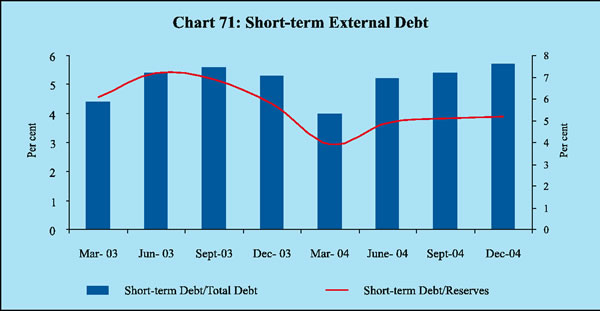
The key external debt indicators have shown considerable improvement in the recent past. The ratios of short-term debt to India's total external debt and short-term debt to foreign exchange reserves registered modest increases at end-December 2004 on account of the rise in short-term debt (Chart 71).
Page Last Updated on:


