 IST,
IST,
VI. The External Economy
Balance of payments (BoP) developments show that the current account deficit widened further during the second quarter (July-September) of 2005-06 over its level in the first quarter, led by a higher merchandise trade deficit. The balance of payments position, nonetheless, remained comfortable as capital flows continued to remain strong. Capital flows (net), in fact, doubled during the quarter, led by foreign portfolio investment flows and external commercial borrowings. With capital flows remaining in excess of the current account deficit, the overall balance of payments recorded a surplus. External debt increased marginally during the quarter ended September 2005. Foreign exchange reserves have declined by US $ 2.0 billion in the current fiscal year so far to US $ 139.5 billion as on January 13, 2006. The decline in the reserves was mainly on account of the redemption of the India Millennium Deposits (IMDs) on December 29, 2005. Various reserve adequacy indicators show that the current level of foreign exchange reserves is adequate.
International Developments
During the third quarter of calendar year 2005, global economic activity remained strong led by the US and Asian countries like China and India. Real GDP growth in advanced economies gathered some pace as strong activity in the US got support from Japan and the euro area (Table 40). After gaining momentum in the first quarter of 2005, domestic demand in the Japanese economy recovered further in the third quarter of 2005 on the back of a strengthening private consumption and business investment supported by improvements in labour market, high corporate profitability and improvement in business expectations. Despite weak domestic demand, European expansion has been facilitated by low long-term interest rates, euro depreciation and buoyant exports. Thus, notwithstanding record high international crude oil prices, global GDP growth exhibited a considerable degree of resilience during 2005. According to the International Monetary Fund (IMF), global economic activity is estimated to have grown by 4.3 per cent in 2005 on top of 5.1 per cent growth recorded in 2004 -which was a three-decade high - buoyed by strong corporate performance, accommodative macro policies and favourable financial market conditions.
Concomitantly, global current account imbalances have further accentuated with the US current account now projected by the Organisation for Economic Co-operation and Development (OECD) to increase from 5.7 per cent of GDP in 2004 to 6.5 per cent in 2005 and widen further to 6.7 per cent in 2006, reaching 7.0 per cent in 2007.
As regards prospects for 2006, global GDP growth is projected by the IMF at 4.3 per cent, the same as in 2005, benefiting from still accommodative macroeconomic policies and benign financial market conditions. However, high international crude oil prices, increasing protectionist sentiment and widening global imbalances pose serious downside risks to growth prospects.
|
Table 40: Growth Rates |
|||||||
|
(Per cent) |
|||||||
|
Country |
2004 |
2004-Q2 |
2004-Q3 |
2004-Q4 |
2005-Q1 |
2005-Q2 |
2005-Q3 |
|
1 |
2 |
3 |
4 |
5 |
6 |
7 |
8 |
|
Advanced Economies |
|||||||
|
Euro Area |
2.1 |
2.2 |
1.8 |
1.5 |
1.4 |
1.1 |
1.6 |
|
Japan |
1.7 |
2.8 |
2.4 |
0.4 |
1.4 |
2.6 |
2.9 |
|
OECD Countries |
3.3 |
3.7 |
3.2 |
2.8 |
2.6 |
2.6 |
2.8 |
|
UK |
3.1 |
3.7 |
2.1 |
2.9 |
2.1 |
1.5 |
1.7 |
|
US |
4.4 |
4.6 |
3.8 |
3.8 |
3.6 |
3.6 |
3.6 |
|
Emerging Economies |
|||||||
|
Argentina |
9.0 |
7.1 |
8.7 |
9.1 |
8.0 |
10.1 |
9.2 |
|
Brazil |
5.2 |
4.7 |
5.3 |
4.2 |
2.6 |
3.9 |
1.0 |
|
China |
9.5 |
9.6 |
9.1 |
9.5 |
9.4 |
9.5 |
9.4 |
|
India |
6.9@ |
7.6 |
6.7 |
6.4 |
7.0 |
8.1 |
8.0 |
|
Indonesia |
5.1 |
4.3 |
5.0 |
6.7 |
6.4 |
5.5 |
5.3 |
|
Malaysia |
7.1 |
8.0 |
6.8 |
5.6 |
5.7 |
4.1 |
5.3 |
|
South Korea |
4.6 |
5.5 |
4.7 |
3.3 |
2.7 |
3.3 |
4.5 |
|
Thailand |
6.9 |
6.4 |
6.1 |
5.1 |
3.3 |
4.4 |
5.3 |
|
@: FY 2004-05 |
|||||||
Global inflationary pressures, after remaining relatively contained during the first half of 2005, witnessed some pick up during the third quarter of 2005 moving in tandem with international crude oil prices. With crude oil prices retreating from their record highs of August 2005, headline inflation also edged down marginally during October-November 2005, albeit it still remains at elevated levels.
Growth in global trade during 2005 (January-September) showed signs of deceleration (Table 41). According to the IMF, the world trade volume is expected to increase by around 7.0 per cent in 2005 as compared with 10.3 per cent in 2004.
|
Table 41: Growth in Merchandise Exports: Global Scenario |
|||
|
(Per cent) |
|||
|
Region/ Country |
2004 |
2004 |
2005 |
|
(January-September) |
|||
|
1 |
2 |
3 |
4 |
|
World |
21.2 |
21.5 |
13.8 |
|
Industrial Countries |
17.4 |
18.5@ |
10.3@ |
|
USA |
13.0 |
13.7 |
10.9 |
|
Germany |
21.3 |
21.6 |
10.1 |
|
Japan |
19.9 |
22.0 |
6.2 |
|
United Kingdom |
11.4 |
9.2* |
11.7* |
|
Developing Countries |
26.3 |
26.4@ |
19.1@ |
|
China, P.R., Mainland |
35.4 |
35.7@ |
32.2@ |
|
India |
28.2 |
28.2^ |
18.7^ |
|
Korea |
31.0 |
33.2# |
12.4# |
|
Singapore |
24.6 |
25.5 |
14.2 |
|
Indonesia |
12.6 |
9.2 |
22.2 |
|
Malaysia |
20.5 |
22.2 |
10.8 |
|
Thailand |
19.8 |
20.0 |
16.1 |
|
@: January-August. *: January-June 2005. |
|||
The External Economy
Merchandise Trade
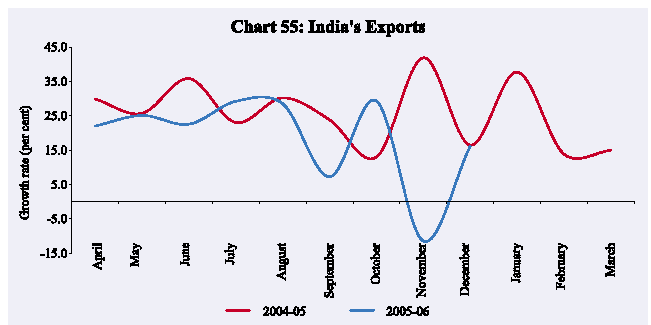
India’s merchandise exports recovered during December 2005 recording a growth of 16.2 per cent after having declined by 11.4 per cent during November 2005 (Chart 55). The sharp decline during November 2005 could be attributable to sectoral factors such as declines in the engineering goods, textiles and clothing, and gems and jewellery sectors. According to the Directorate General of Commercial Intelligence and Statistics (DGCI&S) data, exports (in US dollar terms) increased by 18.0 per cent during April-December 2005 on top of 26.7 per cent growth a year ago.
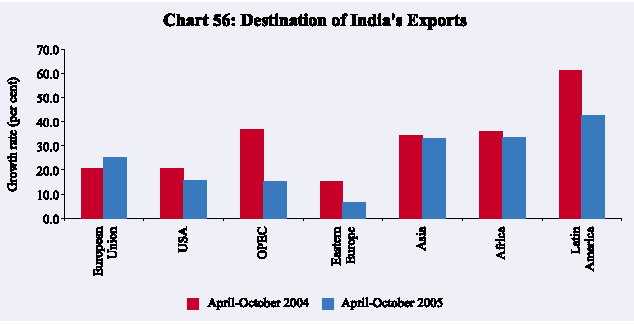
Disaggregated data available for April-October 2005 show that export growth has been broad-based. Exports of primary products were led by iron ore and minerals reflecting increased global demand for metals (Table 42). Exports of agricultural commodities were led by rice, coffee, raw cotton and cashew. In the manufacturing segment, engineering goods (transport equipment, machinery and parts, and manufactures of metals), gems and jewellery, and chemicals (dyes, intermediates and cosmetics and inorganic chemicals) continued to remain the key drivers of export growth. In the textiles segment, readymade garments remained as the mainstay, while textile yarns suffered a setback. Exports of petroleum products remained buoyant with a growth of 57.7 per cent during April-October 2005 on top of 89.4 per cent a year ago, benefiting from elevated international oil prices and reflecting the growing competitive strength of India’s petroleum refinery sector.
Latin America continued to be the fastest growing region for India’s exports during April-October 2005, followed by East Asia, Africa, South Asia,
|
Table 42: Exports of Principal Commodities (April-October) |
||||
|
Item |
2004-05 |
2005-06 |
2004-05 |
2005-06 |
|
(US $ million) |
(Growth rate in per cent) |
|||
|
1 |
2 |
3 |
4 |
5 |
|
Agricultural and Allied Products |
4,203 |
4,999 |
16.2 |
18.9 |
|
Ores and Minerals |
1,998 |
2,727 |
89.0 |
36.5 |
|
Leather and Manufactures |
1,320 |
1,404 |
15.5 |
6.3 |
|
Chemicals and Related Products |
6,128 |
7,193 |
26.9 |
17.4 |
|
Engineering Goods |
8,561 |
10,575 |
36.6 |
23.5 |
|
Textile and Textile Products |
7,305 |
7,850 |
11.0 |
7.5 |
|
Gems and Jewellery |
7,366 |
9,348 |
20.8 |
26.9 |
|
Petroleum Products |
3,665 |
5,779 |
89.4 |
57.7 |
|
Total Exports |
42,334 |
52,284 |
28.3 |
23.5 |
|
Source : DGCI&S. |
||||
and the European Union. The US, Singapore, China, Korea, Hong Kong, the Netherlands, France and the UK were the major markets for India’s exports (Chart 56).
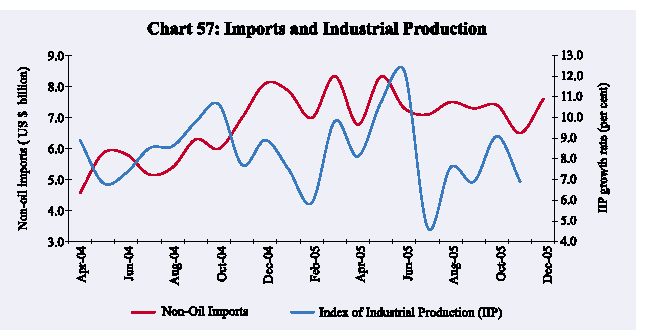
Import demand has continued to remain strong during 2005-06 so far although there was some deceleration during October-December 2005 to 15.7 per cent from 33.2 per cent a year ago due to a moderation in non-oil imports growth. Cumulatively, growth in non-oil imports during April-December 2005 was 20.1 per cent as compared with 33.0 per cent a year ago (Chart 57). Non-oil imports excluding gold and silver witnessed a rise of 30.8 per cent during April-October 2005, led by imports of industrial inputs. Within industrial inputs, capital goods posted a growth of 32.2 per cent during April-October 2005 (28.6 per cent a year ago) reflecting investment demand in the economy.
Among other items, imports of iron and steel increased sharply by 95.0 per cent during April-October 2005 on top of 66.2 per cent a year ago, reflecting the sustained expansion in domestic demand (Table 43). Imports of mainly export related items recorded a higher growth than a year ago due to pearls, precious stones and chemicals. Among bulk goods, edible oil imports recorded a decline while fertiliser and non-ferrous metals registered a steep rise during April-October 2005.
The rise in petroleum, oil and lubricants (POL) imports (45.4 per cent) in April-December 2005 was due to a sharp increase in international crude oil prices. The average crude oil price (Indian basket) at US $ 54 per barrel during April-December 2005 recorded a rise of 44.8 per cent over the previous year (Chart 58). In volume terms, oil imports are estimated to have declined
|
Table 43: Imports of Principal Commodities (April-October) |
|||||
|
Item |
2004-05 |
2005-06 |
2004-05 |
2005-06 |
|
|
(US $ million) |
(Growth rate in per cent) |
||||
|
1 |
2 |
3 |
4 |
5 |
|
|
Petroleum and Products |
17,249 |
24,392 |
56.8 |
41.4 |
|
|
Edible oil |
1,463 |
1,240 |
-11.9 |
-15.3 |
|
|
Metalliferrous Ores and Metal Scrap |
1,245 |
1,955 |
70.2 |
57.0 |
|
|
Iron and Steel |
1,323 |
2,580 |
66.2 |
95.0 |
|
|
Capital Goods |
11,395 |
15,061 |
28.6 |
32.2 |
|
|
Pearls, Precious and Semi Precious Stones |
4,530 |
6,178 |
25.9 |
36.4 |
|
|
Organic and Inorganic Chemicals |
2,871 |
3,461 |
32.9 |
20.6 |
|
|
Gold and Silver |
5,159 |
6,917 |
28.8 |
34.1 |
|
|
Total Imports |
57,060 |
76,648 |
36.9 |
34.3 |
|
|
Memo: |
|||||
|
Non-oil Imports excluding Gold and Silver |
34,651 |
45,339 |
29.9 |
30.8 |
|
|
Mainly Industrial Inputs |
31,641 |
41,821 |
33.4 |
32.2 |
|
|
Source : DGCI&S. |
|||||
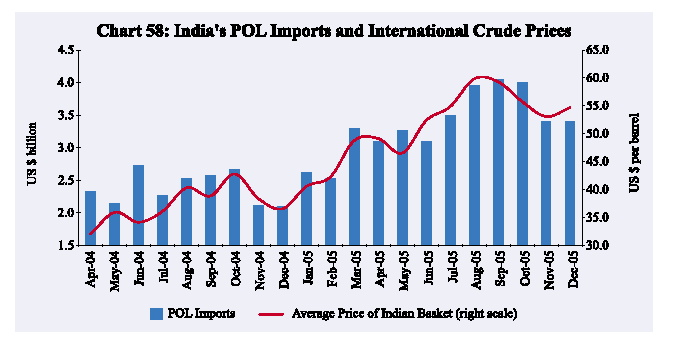
by 0.7 per cent during April-October 2005 (as against an increase of 10.5 per cent a year ago).
During April-October 2005, China emerged as the largest source of India’s imports, followed by the US, Switzerland, Germany, Belgium, UAE and Australia. Imports from China amounted to US $ 5.2 billion during April-October 2005 (6.8 per cent of India’s total imports) while imports from the US were placed at US $ 4.1 billion (5.3 per cent of India’s total imports).
Trade deficit, based on DGCI&S data, increased by 54.2 per cent to US $ 29.8 billion during April-December 2005 (Table 44). During April-October 2005, the non-oil trade balance showed a deficit of US $ 5.8 billion as compared with a deficit of US $ 1.1 billion a year ago.
|
Table 44: India’s Merchandise Trade |
||||
|
(US $ billion) |
||||
|
Item |
2004-05 |
2004-05 |
2005-06 |
|
|
(April-December) |
||||
|
1 |
2 |
3 |
4 |
|
|
Exports |
80.5 |
56.3 |
66.4 |
|
|
(26.2) |
(26.7) |
(18.0) |
||
|
Imports |
109.2 |
75.6 |
96.3 |
|
|
(39.7) |
(36.3) |
(27.3) |
||
|
Oil |
29.8 |
21.4 |
31.1 |
|
|
(45.1) |
(45.5) |
(45.4) |
||
|
Non-Oil |
79.3 |
54.2 |
65.1 |
|
|
(37.8) |
(33.0) |
(20.1) |
||
|
Trade Balance |
- 28.6 |
-19.3 |
-29.8 |
|
|
Note : Figures in parentheses show percentage change over |
||||
Current Account
Net surplus under the invisibles account continued to remain sizeable during July-September 2005, albeit lower than the previous quarter (Table 45). Gross invisible receipts during July-September 2005 recorded a strong rise of 62.5 per cent over the position a year ago due to a sustained growth in travel earnings and continuing pace of export of software and other business and professional services and stable remittances from overseas Indians. Private transfers contributed about 24 per cent of gross invisible receipts. Gross invisibles payments during July-September 2005 registered a sharp rise of 79.1 per cent on account of outbound tourist traffic, transportation and insurance payments, and rising import demand for business services such as business and management consultancy, engineering, technical and distribution services. On the whole, the net invisible surplus during July-September 2005 at US $ 8.5 billion was US $ 2.4 billion higher than the surplus a year ago. Consequently, the cumulative surplus during the first half of 2005-06 at US $ 18.7 billion was US $ 4.4 billion (31 per cent) higher than in the corresponding period of the previous year.
While the net invisible surplus expanded by US $ 4.4 billion during April-September 2005, the merchandise trade deficit, on payments basis, expanded by US $ 16.9 billion to US $ 31.6 billion during April-September 2005. Net invisible surplus during April-September 2005 thus could finance only 59 per cent of the trade deficit and the current account balance recorded a deficit of US $ 13.0 billion - as compared with a modest deficit of US $ 0.5 billion a year ago (Table 46).
|
Table 45: Invisibles Account (Net) |
||||||||
|
(US $ million) |
||||||||
|
Item |
2004-05 |
2004-05 |
2005-06 |
|||||
|
(April- |
April- |
July- |
April- |
April- |
July- |
April- |
||
|
March) |
June |
Sept. |
Sept. |
June |
Sept. |
Sept. |
||
|
1 |
2 |
3 |
4 |
5 |
6 |
7 |
8 |
|
|
Travel |
985 |
-62 |
24 |
-38 |
-454 |
-619 |
-1,073 |
|
|
Transportation |
259 |
272 |
-21 |
251 |
-675 |
-765 |
-1,440 |
|
|
Insurance |
187 |
-32 |
50 |
18 |
-25 |
352 |
327 |
|
|
Government not included elsewhere |
67 |
61 |
5 |
66 |
-33 |
-87 |
-120 |
|
|
Software |
16,526 |
3,710 |
3,859 |
7,569 |
4,853 |
4,989 |
9,842 |
|
|
Other Services |
-3,825 |
-927 |
-959 |
-1,886 |
1,056 |
920 |
1,976 |
|
|
Transfers |
20,844 |
5,890 |
4,330 |
10,220 |
6,479 |
5,766 |
12,245 |
|
|
Income |
-3,814 |
-758 |
-1,159 |
-1,917 |
-1,070 |
-2,008 |
-3,078 |
|
|
Investment Income |
-2,669 |
-527 |
-903 |
-1,430 |
-741 |
-1,676 |
-2,417 |
|
|
Compensation of Employees |
-1,145 |
-231 |
-256 |
-487 |
-329 |
-332 |
-661 |
|
|
Total |
31,229 |
8,154 |
6,129 |
14,283 |
10,131 |
8,548 |
18,679 |
|
|
Table 46: India’s Balance of Payments |
|||||||
|
(US $ million) |
|||||||
|
Item |
2004-05 |
2004-05 |
2005-06 |
||||
|
(April- |
April- |
July- |
April- |
April- |
July- |
April- |
|
|
March) |
June |
Sept. |
Sept. |
June |
Sept. |
Sept. |
|
|
1 |
2 |
3 |
4 |
5 |
6 |
7 |
8 |
|
Exports |
82,150 |
17,840 |
18,875 |
36,715 |
21,991 |
22,770 |
44,761 |
|
Imports |
1,18,779 |
22,980 |
28,503 |
51,483 |
37,418 |
38,978 |
76,396 |
|
Trade Balance |
-36,629 |
-5,140 |
-9,628 |
-14,768 |
-15,427 |
-16,208 |
-31,635 |
|
Invisibles, net |
31,229 |
8,154 |
6,129 |
14,283 |
10,131 |
8,548 |
18,679 |
|
Gross Receipts |
71,854 |
16,708 |
14,635 |
31,343 |
24,053 |
23,778 |
47,831 |
|
Gross Payments |
40,625 |
8,554 |
8,506 |
17,060 |
13,922 |
15,230 |
29,152 |
|
Current Account |
-5,400 |
3,014 |
-3,499 |
-485 |
-5,296 |
-7,660 |
-12,956 |
|
Capital Account* |
31,559 |
4,556 |
2,865 |
7,421 |
6,542 |
12,916 |
19,458 |
|
Change in Reserves # |
-26,159 |
-7,570 |
634 |
-6,936 |
-1,246 |
-5,256 |
-6,502 |
|
(-Indicates increase) |
|||||||
|
*: Includes errors and omissions. |
|||||||
Capital Flows
Capital flows to India have remained strong during 2005-06 so far, led by foreign investment flows and external commercial borrowings. Capital flows (net) more than doubled to US $ 19.5 billion during April-September 2005 from US $ 7.4 billion a year ago (Table 46). Foreign direct investment inflows into India during April-October 2005 were 35 per cent higher than in the corresponding period of 2004 (Table 47). Net FDI into India picked up on sustained growth in activity and positive investment climate with inflows going into manufacturing, business and computer services. Outward FDI remained on track reflecting the appetite of Indian companies for global expansion in terms of markets and resources.
After remaining subdued during April-May 2005, Foreign Institutional Investors (FIIs) made large purchases in the Indian stock markets in the subsequent period. The net cumulative FII inflows during April-December 2005 amounted to US $ 5.1 billion (US $ 4.7 billion during the corresponding period of the previous year). The number of FIIs registered with the SEBI increased from 685 at end-March 2005 to 823 by end-December 2005 with the registration of FIIs from Australia, Austria, Canada, Denmark, Ireland, Italy, Sweden, Korea, Japan and Taiwan, providing a diverse FII base for investment in India. Portfolio flows through the issuances of American depository receipts (ADRs)/global depository receipts (GDRs) remained buoyant as booming stocks offered corporates the opportunity to issue equities abroad.
|
Table 47: Capital Flows |
|||
|
(US $ million) |
|||
|
Component |
Period |
2004-05 |
2005-06 |
|
1 |
2 |
3 |
4 |
|
Foreign Direct Investment |
April-October |
2,682 |
3,631 |
|
FIIs (Net) |
April-December |
4,700 |
5,098 |
|
ADRs/GDRs |
April-October |
170 |
1,427 |
|
External Assistance (Net) |
April-September |
346 |
436 |
|
External Commercial Borrowings (Medium and long-term) (Net) |
April-September |
1,526 |
2,752 |
|
Short-term Trade Credits (Net) |
April-September |
1,963 |
938 |
|
NRI Deposits (Net) |
April-October |
-688 |
231 |
Notwithstanding further firming up of international interest rates, demand for external commercial borrowings (ECBs) increased during July-September 2005 in consonance with the sustained pick-up in economic activity. Net disbursements under short-term trade credit turned positive during July-September 2005 after having recorded net outflows during the first quarter. Non-Resident Indian deposit accounts recorded modest inflows during April-October 2005 as against outflows during April-October 2004 (Table 47).
Foreign Exchange Reserves
During the first half of 2005-06, the current account deficit was more than offset by surplus in the capital account, resulting in an accretion to the foreign exchange reserves of the order of US $ 6.5 billion on a balance of payments basis (i.e., excluding valuation effects).
India’s foreign exchange reserves stood at US $ 139.5 billion as on January 13, 2006, registering a decline of US $ 2.0 billion over end-March 2005 level. The decline in reserves was mainly on account of the redemption of India Millennium Deposits (IMDs). The Reserve Bank sold foreign exchange aggregating US $ 7.1 billion during December 27-29, 2005 to the State Bank of India (SBI) to meet the IMD redemption. SBI had raised equivalent of US $ 5.5 billion in the year 2000 under the IMD scheme from non-resident deposits and the maturity amount (principal and interest payment) aggregated US $ 7.1 billion.
India holds the fifth largest stock of reserves among the emerging market economies and the sixth largest in the world. The overall approach to the management of India’s foreign exchange reserves in recent years reflects the changing composition of the balance of payments and the ‘liquidity risks’ associated with different types of flows and other requirements. Taking these factors into account, India’s foreign exchange reserves continued to be at a comfortable level and consistent with the rate of growth, the share of external sector in the economy and the size of risk-adjusted capital flows.
External Debt
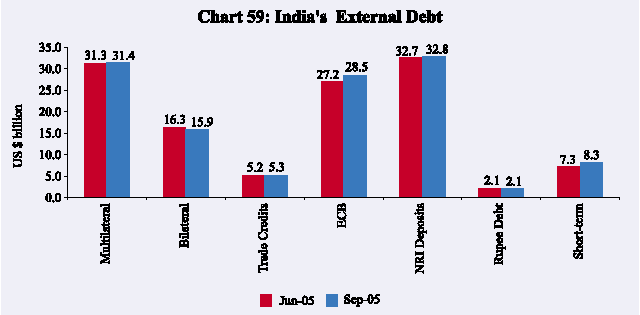
India’s total external debt registered an increase of US $ 2.2 billion (1.8 per cent) during the quarter ended September 2005 and stood at US $ 124.3 billion at end-September 2005. The increase during the quarter primarily reflected higher recourse to commercial borrowing and export credit. Short-term debt also increased on account of increase in trade credit to finance higher imports (Chart 59).
Key external debt indicators reflect the growing sustainability of external debt of India (Table 48). Although the ratios of short-term to total debt and short-term debt to foreign exchange reserves increased marginally during the quarter ended September 2005, they remain quite modest. India’s foreign exchange reserves exceeded the external debt by US $ 18.7 billion providing a cover of 115.1 per cent to the external debt stock at the end of September 2005. The share of concessional debt in total external debt continued its declining trend reflecting a gradual increase in non-concessional private debt. Nonetheless, the concessional debt continues to be a significant proportion of the total external debt, especially by international standards.
|
Table 48: Indicators of Debt Sustainability |
|||
|
(Per cent) |
|||
|
Indicator |
March 2004 |
March 2005 |
September 2005 |
|
1 |
2 |
3 |
4 |
|
Concessional debt/Total debt |
36.1 |
33.3 |
31.6 |
|
Short-term/Total debt |
4.0 |
6.1 |
6.7 |
|
Short-term debt/Reserves |
3.9 |
5.3 |
5.8 |
|
Reserves/ Total debt |
101.1 |
114.8 |
115.1 |
Page Last Updated on:


