Merchandise exports, based on Directorate General
of Commercial Intelligence and Statistics (DGCI&S) data, recorded a growth
of 19.3 per cent during 2006-07 (April-February), lower than that of 26.3 per
cent in the corresponding period of 2005-06. Growth in non-oil imports was led
by imports of capital goods, indicative of strong investment demand, partly offsetting
the decline in imports of pearls, precious and semi-precious stones. Growth in
oil imports remained large, although there was some deceleration in consonance
with the moderation in international crude oil prices. Net invisibles surplus
expanded further during the first three quarters of 2006-07, benefiting from continued
growth in exports of services and remittances, and financed a large part of the
deficit on the merchandise trade account. The current account deficit was marginally
lower than a year ago. Capital flows were substantially higher, led by foreign
direct investment (FDI) flows and supported by foreign institutional investors
(FIIs) flows and debt flows (external commercial borrowings and nonresident deposits).
Outward FDI flows associated with acquisitions by Indian corporates abroad also
increased. Capital flows (net) more than financed the current account deficit,
resulting in the net accretion of US $ 47.6 billion in foreign exchange reserves
during 2006-07.
International Developments
Global economic growth at 5.4 per cent during 2006 (4.9 per cent in 2005) turned
out to be stronger than expected, led by a broad-based upswing in advanced economies
and rapid growth in the emerging market economies. After a strong first quarter,
economic activity in the US slowed down on the back of a significant weakening
of the housing market. Nonetheless, for the year 2006, as a whole, economic growth
in the US was marginally higher than in 2005. The economic activity in the euro
area accelerated to 2.6 per cent – the highest since 2001– led by
strong domestic as well as external demand. The Japanese economy expanded at a
higher rate than in 2005. Growth momentum remained strong in China, India and
other emerging economies as well (Table 51). Developing Asia
recorded a growth of 9.4 per cent during 2006, the highest since 1995.
According to the International Monetary Fund (IMF) projections, the global economy
is likely to maintain its run of strong growth during 2007, though with some loss
of momentum (4.9 per cent from 5.4 per cent in 2006) (Table 52).
There are also some downside risks to global growth prospects. These include revival
of inflationary pressures in view of narrowing output gaps, the possibility of
renewed oil price rise, sharper slowdown in the US economy in case the housing
Table
51: Growth Rates – Global Scenario | (Per
cent) | Country | 2004 | 2005 | 2006 | 2007
P | 2008 P | 2005
| 2006 |
| Q4 | Q1 | Q2 | Q3 | Q4 |
1 | 2 | 3 | 4 | 5 | 6 | 7 | 8 | 9 | 10 | 11 |
Advanced Economies | | | | | | | | | | |
Euro area | 2.0 | 1.4 | 2.6 | 2.3 | 2.3 | 1.8 | 2.2 | 2.7 | 2.6 | 3.3 |
Japan | 2.7 | 1.9 | 2.2 | 2.3 | 1.9 | 2.8 | 2.9 | 2.1 | 1.5 | 2.3 |
Korea | 4.7 | 4.2 | 5.0 | 4.4 | 4.4 | 5.3 | 6.3 | 5.1 | 4.8 | 4.0 |
UK | 3.3 | 1.9 | 2.7 | 2.9 | 2.7 | 1.8 | 2.4 | 2.7 | 2.9 | 3.0 |
US | 3.9 | 3.2 | 3.3 | 2.2 | 2.8 | 3.1 | 3.7 | 3.5 | 3.0 | 3.1 |
OECD Countries | 3.2 | 2.5 | 3.0 | 2.5 | 2.7 | 3.0 | 3.3 | 3.3 | 2.9 | 3.3 |
Emerging Economies | | | | | | | | | | |
Argentina | 9.0 | 9.2 | 8.5 | 7.5 | 5.5 | 9.1 | 8.6 | 7.9 | 8.7 | 8.6 |
Brazil | 5.7 | 2.9 | 3.7 | 4.4 | 4.2 | 1.4 | 3.4 | 1.2 | 3.2 | 3.8 |
China | 10.1 | 10.4 | 10.7 | 10.0 | 9.5 | 9.9 | 10.3 | 10.9 | 10.7 | 10.7 |
India | 7.5 | 9.0 | 9.2 | 8.4 | 7.8 | 9.3 | 10.0 | 8.9 | 9.2 | 8.6 |
Indonesia | 5.0 | 5.7 | 5.5 | 6.0 | 6.3 | 5.0 | 5.0 | 5.0 | 5.9 | 6.1 |
Malaysia | 7.2 | 5.2 | 5.9 | 5.5 | 5.8 | 5.2 | 5.3 | 6.2 | 5.8 | 5.7 |
Thailand | 6.3 | 4.5 | 5.0 | 4.5 | 4.8 | 4.3 | 6.1 | 5.0 | 4.7 | 4.2 |
P : IMF Projections.
Note
: Data for India in columns 2 to 4 refer to fiscal years 2004-05, 2005-06
and 2006-07, respectively.
Source : International Monetary
Fund; The Economist; and the OECD. | sector continues to
deteriorate, financial market volatility and possible disorderly adjustment of
global imbalances.
Table
52: Select Economic Indicators – World | Item | 2001 | 2002 | 2003 | 2004 | 2005 | 2006 | 2007P | 2008P |
1 | 2 | 3 | 4 | 5 | 6 | 7 | 8 | 9 |
I. | | World
Output (Per cent change) # | 2.5 | 3.1 | 4.0 | 5.3 | 4.9 | 5.4 | 4.9 | 4.9 |
| | | | (1.5) | (1.8) | (2.6) | (4.0) | (3.3) | (3.9) | (3.4) | (3.5) |
| | i) | Advanced
economies | 1.2 | 1.6 | 1.9 | 3.3 | 2.5 | 3.1 | 2.5 | 2.7 |
| | ii) | Other
emerging market and developing countries | 4.3 | 5.0 | 6.7 | 7.7 | 7.5 | 7.9 | 7.5 | 7.1 |
| | | of
which: Developing Asia | 6.0 | 7.0 | 8.4 | 8.7 | 9.2 | 9.4 | 8.8 | 8.4 |
II. | | Consumer
Price Inflation (Per cent) | | | | | | | | |
| | i) | Advanced
economies | 2.1 | 1.5 | 1.8 | 2.0 | 2.3 | 2.3 | 1.8 | 2.1 |
| | ii) | Other
emerging market and developing countries | 6.7 | 5.8 | 5.8 | 5.6 | 5.4 | 5.3 | 5.4 | 4.9 |
| | | of
which: Developing Asia | 2.7 | 2.0 | 2.5 | 4.1 | 3.6 | 4.0 | 3.9 | 3.4 |
III. | Net
Capital Flows* (US $ billion) | | | | | | | | |
| | i) | Net
private capital flows (a+b+c) | 70.2 | 88.3 | 173.3 | 238.6 | 257.2 | 255.8 | 252.7 | 259.3 |
| | | a)
Net private direct investment | 182.8 | 152.2 | 165.3 | 190.0 | 266.3 | 266.9 | 283.7 | 288.9 |
| | | b)
Net private portfolio investment | -80.5 | -90.9 | -12.1 | 25.0 | 29.4 | -76.3 | -62.0 | -52.2 |
| | | c)
Net other private capital flows | -32.1 | 26.9 | 20.1 | 23.5 | -38.5 | 65.2 | 30.9 | 22.6 |
| | ii) | Net
official flows | 6.6 | 2.3 | -44.5 | -57.8 | -122.6 | -143.8 | -96.4 | -116.6 |
IV. | | World
Trade @ | | | | | | | | |
| | i) | Volume | 0.2 | 3.4 | 5.4 | 10.6 | 7.4 | 9.2 | 7.0 | 7.4 |
| | ii) | Price
deflator (in US dollars) | -3.5 | 1.2 | 10.4 | 9.8 | 5.5 | 5.4 | 2.8 | 0.8 |
V. | | Current
Account Balance (Per cent to GDP) | | | | | | | | |
| | i) | US | -3.8 | -4.5 | -4.8 | -5.7 | -6.4 | -6.5 | -6.1 | -6.0 |
| | ii) | China
| 1.3 | 2.4 | 2.8 | 3.6 | 7.2 | 9.1 | 10.0 | 10.5 |
| | iii) | Middle
East | 6.2 | 4.7 | 8.4 | 12.1 | 18.8 | 18.1 | 12.1 | 10.7 |
P : IMF Projections.
# :
Growth rates are based on exchange rates at purchasing power parities. Figures
in parentheses are growth rates at market exchange rates.
* : Net capital
flows to emerging market and developing countries.
@ : Average of annual percentage
change for world exports and imports of goods and services.
Source
: World Economic Outlook, IMF, April 2007. |
Table
53: Growth in Exports - Global Scenario | (Per
cent) | Region/Country | 2005 | 2006 |
1 | 2 | 3 |
World | 14.0 | 15.7 |
Industrial Countries | 8.5 | 12.6 |
US | 10.8 | 14.5 |
France | 4.3 | 10.8 |
Germany | 7.3 | 15.1 |
Japan | 5.2 | 9.2 |
Developing Countries | 21.8 | 19.7 |
Non-Oil Developing Countries | 19.2 | 19.7 |
China | 28.4 | 27.2 |
India | 29.6 | 21.1 |
Indonesia | 18.2 | 16.5 |
Korea | 12.0 | 14.5 |
Malaysia | 12.0 | 14.0 |
Singapore | 15.6 | 18.4 |
Thailand | 14.5 | 18.7 |
Source: International
Financial Statistics, International Money Fund;
DGCI&S for India. |
Global merchandise trade grew at a robust pace in 2006 benefiting from
favourable economic conditions, high commodity prices and recovery in global investment.
Exports of developing countries, notwithstanding some deceleration, continued
to post a higher growth in comparison with industrial countries (Table
53).
Merchandise Trade
According to the
provisional data released by the Directorate General of Commercial Intelligence
and Statistics (DGCI&S), India’s merchandise exports during April-February
2006-07 registered a growth of 19.3 per cent as compared with 26.3 per cent a
year ago. The export growth was strong in the first half (April-September 2006)
of the fiscal at 27.2 per cent, but decelerated to 14.3 per cent during October
2006-February 2007 (Chart 54).
Commodity-wise
data available for April-November 2006 reveal that engineering goods and petroleum
products were the major growth drivers, together contributing almost 64 per cent
of the export growth during this period. Gems and jewellery, textiles, and ores
and minerals, on the other hand, showed decline or deceleration in exports (Table
54). Agriculture and allied products posted strong growth, driven mainly by
the increase in the exports of sugar and molasses and raw cotton. Traditional
export items like tea, coffee, tobacco and spices also maintained high growth,
while exports of rice, wheat, cashew and marine products declined or decelerated.
The US continued to be the major destination of India’s exports with a share
of 15.4 per cent in 2006-07 (April-November) followed by the UAE (9.9 per cent),
China (5.9 per cent), Singapore (5.2 per cent) and the UK (4.5 per cent) 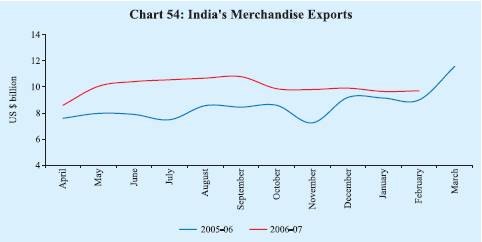
(Table
55). Among the major countries, growth in exports to the UAE accelerated to
57.4 per cent from 22.3 per cent a year ago. On the other hand, growth in exports
to China, Singapore and Hong Kong decelerated.
India’s merchandise
imports registered a growth of 27.8 per cent during April-February 2006-07 on
top of 32.7 per cent growth a year ago. After showing a slowdown in the latter
half of 2005-06, non-oil imports have picked up since
Table
54: Exports of Principal Commodities | Commodity
Group | US $
billion | Variation
(per cent) | 2005-06 | 2005-06 | 2006-07 | 2005-06 | 2005-06 | 2006-07 |
April-November | April-November |
1 | | 2 | 3 | 4 | 5 | 6 | 7 |
1. | Primary
Products | 16.4 | 9.6 | 11.4 | 20.8 | 29.7 | 18.9 |
| of
which: | | | | | | |
a) | Agriculture
and Allied Products | 10.2 | 6.0 | 7.4 | 20.5 | 20.4 | 23.5 |
b) | Ores
and Minerals | 6.2 | 3.6 | 4.0 | 21.4 | 49.1 | 11.2 |
| | | | | | | |
2. | Manufactured
Goods | 72.2 | 45.5 | 53.5 | 18.9 | 25.2 | 17.7 |
| of
which: | | | | | | |
a) | Chemicals
and Related Products | 14.8 | 9.0 | 10.9 | 18.6 | 23.3 | 21.0 |
b) | Engineering
Goods | 21.5 | 13.4 | 18.5 | 23.7 | 33.2 | 38.5 |
c) | Textiles
and Textile Products | 16.3 | 10.1 | 11.0 | 20.6 | 21.8 | 8.6 |
d) | Gems
and Jewellery | 15.5 | 10.3 | 10.2 | 12.8 | 22.5 | -0.8 |
3. | Petroleum
Products | 11.5 | 7.2 | 12.8 | 64.9 | 63.0 | 79.1 |
4. | Total
Exports | 103.1 | 63.9 | 80.9 | 23.4 | 29.4 | 26.6 |
Memo: | | | | | | |
Non-oil Exports | 91.6 | 56.7 | 68.1 | 19.6 | 26.1 | 20.0 |
Source : DGCI&S. |
Table
55: Direction of India’s Exports | Group/Country | US
$ billion | Variation
(per cent) | 2005-06 | 2005-06 | 2006-07 | 2005-06 | 2005-06 | 2006-07 |
April-November | April-November |
1 | 2 | 3 | 4 | 5 | 6 | 7 |
1. OECD Countries | 45.8 | 28.7 | 33.4 | 25.6 | 29.3 | 16.2 |
| of
which: | | | | | | |
| a)
EU | 22.4 | 14.0 | 16.3 | 27.6 | 34.5 | 17.1 |
| b)
North America | 18.4 | 11.6 | 13.2 | 25.6 | 25.6 | 13.0 |
| US | 17.4 | 11.0 | 12.4 | 26.1 | 25.9 | 12.8 |
2. | OPEC | 15.2 | 9.1 | 13.6 | 15.4 | 19.9 | 50.1 |
| of
which: | | | | | | |
| UAE | 8.6 | 5.1 | 8.0 | 16.9 | 22.3 | 57.4 |
3. | Developing
Countries | 39.7 | 24.6 | 32.0 | 25.8 | 35.8 | 30.1 |
| of
which: | | | | | | |
| Asia
| 31.0 | 19.2 | 23.8 | 24.1 | 35.6 | 23.7 |
| People’s
Republic of China | 6.8 | 3.9 | 4.8 | 20.4 | 56.5 | 22.7 |
| Singapore
| 5.4 | 3.6 | 4.2 | 19.3 | 63.0 | 15.3 |
4. | Total
Exports | 103.1 | 63.9 | 80.9 | 23.4 | 29.4 | 26.6 |
Source : DGCI&S. |
September 2006 (Chart 55). During April-February
2006-07, non-oil imports grew by 25.7 per cent and accounted for almost 64 per
cent of the rise in total imports.
Major import items like capital goods
maintained high growth during April-November 2006, while imports of mainly export
related items, particularly, pearls, precious and semi-precious stones declined
(Table 56). Imports of capital goods increased by 38.2 per
cent during April-November 2006, over and above 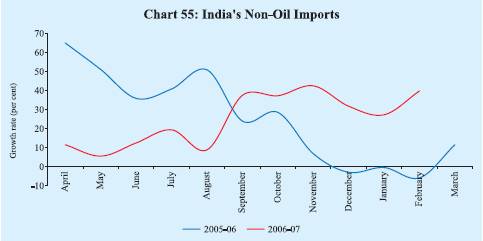
Table
56: Imports of Principal Commodities | Commodity
Group | US $
billion | | Variation
(per cent) | 2005-06 | 2005-06 | 2006-07 | 2005-06 | 2005-06 | 2006-07 |
April-November | April-November |
1 | 2 | 3 | 4 | 5 | 6 | 7 |
Petroleum, Petroleum Products and | | | | | | |
Related Material | 44.0 | 27.8 | 39.4 | 47.3 | 43.3 | 41.9 |
Edible Oils | 2.0 | 1.5 | 1.5 | -17.9 | -9.2 | 3.2 |
Iron and Steel | 4.6 | 3.2 | 4.1 | 71.3 | 106.4 | 28.4 |
Capital Goods | 37.7 | 19.6 | 27.1 | 49.9 | 45.7 | 38.2 |
Pearls, Precious and Semi-Precious Stones | 9.1 | 6.7 | 5.0 | -3.1 | 30.8 | -25.6 |
Chemicals | 7.0 | 4.7 | 5.2 | 22.5 | 37.5 | 11.8 |
Gold and Silver | 11.3 | 8.0 | 9.6 | 1.5 | 27.4 | 21.3 |
| | | | | | |
Total Imports | 149.2 | 93.5 | 119.4 | 33.8 | 41.2 | 27.8 |
| | | | | | |
Memo: | | | | | | |
| | | | | | |
Non-oil Imports | 105.2 | 65.7 | 80.0 | 28.8 | 40.4 | 21.8 |
Non-oil Imports excluding Gold and Silver | 93.9 | 57.8 | 70.4 | 33.1 | 42.4 | 21.8 |
Mainly Industrial Imports* | 87.5 | 53.3 | 64.5 | 34.7 | 43.8 | 21.1 |
* : Non-oil imports net of gold
and silver, bulk consumption goods, manufactured fertilisers and professional
instruments.
Source : DGCI&S. | the
growth of 45.7 per cent recorded a year ago, reflecting the continued buoyancy
in domestic investment activity. Imports of gold and silver registered a sharp
jump during September-November 2006, offsetting the decline during April-August
2006. As a result, the cumulative growth was 21.3 per cent during April-November
2006.
Oil imports during April-February 2006-07 rose
by 32.6 per cent on top of 49.7 per cent a year ago, reflecting partly the increase
in volumes. In volume terms, oil imports increased by 22.5 per cent during April-November
2006 as compared with a growth of 0.8 per cent a year ago. Growth in the Indian
basket of crude oil prices, on the other hand, decelerated to 12.7 per cent during
2006-07 from 42.3 per cent during 2005-06.
Source-wise, during April-November
2006, China was the major source of imports with a share of 9.3 per cent in India’s
total imports, followed by Saudi Arabia (7.9 per cent), the US (5.8 per cent),
Switzerland (4.9 per cent) and the UAE (4.7 per cent).
Trade deficit
at US $ 55.8 billion during 2006-07 (April-February), according to the DGCI&S
data, was higher by 48.5 per cent than the previous year (US $ 37.6 billion) (Table
57). The deficit on the oil account increased by US $ 6.0 billion during April-November
2006 over the corresponding period of 2005, while the non-oil trade deficit increased
by US $ 3.0 billion.
Table
57: India’s Merchandise Trade | (US
$ billion) | Item | 2004-05 | 2005-06 | 2005-06 | 2006-07 |
| | April-February |
1 | 2 | 3 | 4 | 5 |
Exports | 83.5 | 103.1 | 91.5 | 109.2 |
Imports | 111.5 | 149.2 | 129.1 | 165.0 |
Oil | 29.8 | 44.0 | 39.8 | 52.7 |
Non-oil | 81.7 | 105.2 | 89.3 | 112.3 |
Trade Balance | -28.0 | -46.1 | -37.6 | -55.8 |
Non-Oil Trade Balance | -5.1 | -13.6 | -9.0
* | -11.9 * | Variation
(per cent) | Exports | 30.8 | 23.4 | 26.3 | 19.3 |
Imports | 42.7 | 33.8 | 32.7 | 27.8 |
Oil | 45.1 | 47.3 | 49.7 | 32.6 |
Non-oil | 41.8 | 28.8 | 26.4 | 25.7 |
*: April-November. | | | | |
Source : DGCI&S. |
Current Account
Buoyant net surplus under invisibles
(services, transfers and income taken together) continued to finance bulk of the
trade deficit during 2006-07 (April-December). Amongst major services, net surplus
under software services increased by 29.1 per cent to US $ 20.1 billion during
April-December 2006 (Table 58). Private transfers (net) at
US $ 18.8 billion during April-December 2006 were 11.6 per cent higher than a
year ago. Investment income deficit narrowed from a year ago, on account of higher
earnings on India’s external assets. On balance, the net surplus under invisibles
increased to US $ 40.5 billion during April-December 2006 from US $ 28.1 billion
a year ago.
Table
58: Invisibles Account (Net) | (US
$ million) | Item | 2005-06
PR | 2005-06
PR | 2006-07
P | 2005-06
PR | | 2006-07 | |
April-March | April-December | Oct.-Dec. | April-
June PR | July- Sept. PR | Oct.-
Dec.P | 1 | | | 2 | 3 | 4 | 5 | 6 | 7 | 8 |
Services | 23,881 | 16,416 | 25,064 | 4,690 | 8,612 | 7,459 | 8,993 |
Travel | 1,389 | 788 | 981 | 516 | 220 | -31 | 792 |
Transportation | -1550 | -1,087 | -450 | -405 | -314 | -31 | -105 |
Insurance | 22 | 100 | 365 | -126 | 111 | 162 | 92 |
Government, not included elsewhere
-197 | -107 | -97 | -18 | -24 | -62 | -11 |
Software | 22,262 | 15,597 | 20,143 | 5,755 | 6,601 | 6,678 | 6,864 |
Other Services | 1,955 | 1,125 | 4,122 | -1,032 | 2,018 | 743 | 1,361 |
Transfers | 24,284 | 16,937 | 18,943 | 6,436 | 5,689 | 5,222 | 8,032 |
Investment Income | -4,921 | -4,741 | -3,100 | -2,706 | -1,043 | -1,144 | -913 |
Compensation of Employees | -589 | -465 | -426 | -222 | -131 | -162 | -133 |
Total | 42,655 | 28,147 | 40,481 | 8,198 | 13,127 | 11,375 | 15,979 |
PR : Partially Revised.
P: Preliminary. | The net invisible surplus financed 77.4
per cent of the merchandise trade deficit during April-December 2006. Current
account deficit at US $ 11.8 billion in April-December 2006 was marginally lower
than that in the corresponding period of the previous year on account of higher
net invisibles receipts (Table 59 and Chart
56).
Capital Flows
Capital flows during
2006-07 were substantially higher than a year ago, led by foreign direct investment
(FDI) flows, on the back of strong growth prospects and buoyant investment demand.
FDI inflows at US $ 16.4 billion during April-January 2006-07 were substantially
higher than the inflows in the corresponding period of the previous year (Table
60). FDI was channelled mainly into financial services, manufacturing, banking
services, information technology services and construction. Mauritius, the US
and United Kingdom remain the dominant sources of FDI to India. Outward direct
investment from India also exhibited a significant rise to US $ 8.7 billion during
April-December 2006 from US $ 1.9 billion a year ago due to some large overseas
acquisitions by Indian corporates. Both FDI inflows
Table
59: India's Balance of Payments | (US
$ million) | Item | 2005-06
PR | | 2005-06
PR | 2006-07
P | 2005-06
PR | 2006-07 |
April- March | | April-December | Oct.-
Dec. | April- June PR | July-
Sept. PR | Oct- Dec. P |
1 | 2 | | 3 | 4 | 5 | 6 | 7 | 8 |
Exports | 1,05,152 | | 74,573 | 91,334 | 25,318 | 29,674 | 32,798 | 28,862 |
Imports | 1,56,993 | | 1,14,662 | 1,43,636 | 38,298 | 46,898 | 48,855 | 47,883 |
Trade Balance | -51,841 | | -40,089 | -52,302 | -12,980 | -17,224 | -16,057 | -19,021 |
| | | (-6.4) | | | | | | | |
Invisible Receipts | 92,294 | | 63,594 | 82,633 | 23,990 | 25,056 | 25,576 | 32,001 |
Invisible Payments | 49,639 | | 35,447 | 42,152 | 15,792 | 11,929 | 14,201 | 16,022 |
Invisibles, net | 42,655 | | 28,147 | 40,481 | 8,198 | 13,127 | 11,375 | 15,979 |
| | | (5.3) | | | | | | | |
Current Account | -9,186 | | -11,942 | -11,821 | -4,782 | -4,097 | -4,682 | -3,042 |
| | | (-1.1) | | | | | | | |
Capital Account (net)* | 24,238 | | 13,773 | 27,972 | 110 | 10,475 | 6,950 | 10,547 |
| | | [29,738]@ | | [19,273]@ | | [5,610]@ | | | |
| | of
which: | | | | | | | | |
| | Foreign
Direct Investment 4,730 | | 3,347 | 5,822 | 1,218 | 1,273 | 2,268 | 2,281 |
| | Portfolio
Investment | 12,494 | | 8,161 | 5,170 | 2,748 | -527 | 2,141 | 3,556 |
| | | | | | | | | | |
| | External
Commercial | 2,723 | | -1,211 | 9,104 | -4,136 | 3,947 | 1,324 | 3,833 |
| | | [8,223]@ | [4,289]@ | | | | |
| | Borrowings
$ | | | [1,364]@ | | | |
| | Short-term
Trade Credit | 1,708 | | 1,731 | 1,329 | 759 | 417 | 1,554 | -642 |
| | External
Assistance | 1,682 | | 1,090 | 934 | 681 | 41 | 337 | 556 |
| | NRI
Deposits | 2,789 | | 1,114 | 3,201 | 881 | 1,231 | 798 | 1,172 |
Change in Reserves # | -15,052 | | -1,831 | -16,151 | 4,672 | -6,378 | -2,268 | -7,505 |
PR: Partially Revised.
P
: Preliminary.
* : Includes errors and omissions.
$ : Medium and long-term
borrowings.
@ : Excluding the IMD redemption.
# : On balance of payments
basis (excluding valuation); (-) indicates increase.
Note : Figures
in parentheses are percentages to GDP. | 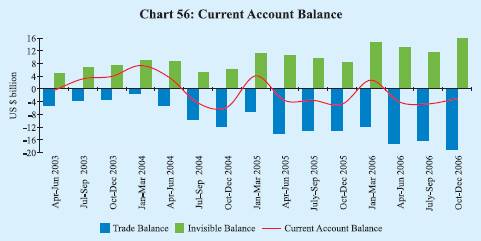
and
outflows include one transaction amounting to US $ 3.1 billion involving swap
of shares. Net of this transaction, FDI inflows and outflows were US $ 13.3 billion
and US $ 5.6 billion, respectively, also indicating a significant increase over
the previous year.
Portfolio equity inflows by foreign institutional investors
(FIIs) were lower than a year ago due to outflows witnessed during a few months
on the back of global developments such as meltdown in global commodities and
equity markets (May-July 2006), fall in Asian equity markets subsequent to the
tightening of capital controls by Thailand (December 2006) and fall in Asian equity
markets on account of concerns of slowdown in the US economy (late February 2007).
Capital inflows through the issuances of American depository receipts (ADRs)/Global
depository receipts (GDRs) during April-January 2006-07 remained higher than in
the previous year.
Table
60: Capital Flows | (US
$ million) | Components | | Period | 2005-06 | 2006-07 |
1 | | 2 | 3 | 4 |
Foreign Direct Investment (FDI) into India | | April-January | 5,821 | 16,444
# | FDI Abroad | | April-December | (-)1,939 | (-)8,684
# | FIIs (net) | | April-March | 9,926 | 3,224 |
ADRs/GDRs | | April-January | 2,141 | 3,506 |
External Assistance (net) | | April-December | 1,153 | 949 |
External Commercial Borrowings
(net)
(Medium and long-term) | April-December | 4,420
@ | 9,275 | Short-term
Trade Credits (net) | | April-December | 1,731 | 1,329 |
NRI Deposits (net) | | April-January | 1,681 | 3,686 |
# : Include swap of shares of
US $ 3.1 billion.
@: Excluding IMD redemption.
Note : Data
on FIIs presented in this table represent inflows into the country. They may differ
from
data relating to net investment in stock exchanges by FIIs. |
Amongst debt flows, demand for external commercial borrowings (ECBs)
remained strong in consonance with buoyant domestic investment activity. Net disbursements
under ECBs during April-December 2006 were more than double of those a year ago.
Net inflows under various NRI deposits during April-January 2006-07 were also
more than twice that a year ago, partly attributable to higher interest rates
on various deposit schemes up to January 2007. The ceiling interest rate on NRE
deposits was raised by 25 basis points each in November 2005 and April 2006 before
being scaled down by 50 basis points to “LIBOR/SWAP rates of US dollar plus
50 basis points” in January 2007. The ceiling interest rate on FCNR(B) deposits
was raised by 25 basis points to “LIBOR/SWAP rates for the respective currency/
maturity” in March 2006 but was reduced by 25 basis points to “LIBOR/
SWAP rates minus 25 basis points” in January 2007. Foreign
Exchange Reserves
India’s foreign exchange reserves were
US $ 199.2 billion as on March 31, 2007, showing an increase of US $ 47.6 billion
over end-March 2006 levels (Table 61). The increase in reserves
was mainly due to increase in foreign currency assets from US $ 145.1 billion
at end-March 2006 to US $ 191.9 billion as at end-March 2007. As on April 13,
2007, India’s foreign exchange reserves were US $ 203.1 billion.
Table
61: Foreign Exchange Reserves | | | | | | (US
$ million) | Period | Gold | SDR | Foreign | Reserve | Total |
| | | Currency | Position
in | (2+3+4+5) | | | | Assets | the
IMF | | 1 | 2 | 3 | 4 | 5 | 6 |
March 1995 | 4,370 | 7 | 20,809 | 331 | 25,517 |
March 2000 | 2,974 | 4 | 35,058 | 658 | 38,694 |
March 2005 | 4,500 | 5 | 135,571 | 1,438 | 141,514 |
March 2006 | 5,755 | 3 | 145,108 | 756 | 151,622 |
April 2006 | 6,301 | 6 | 153,598 | 772 | 160,677 |
May 2006 | 7,010 | – | 156,073 | 785 | 163,868 |
June 2006 | 6,180 | – | 155,968 | 764 | 162,912 |
July 2006 | 6,557 | 7 | 157,247 | 766 | 164,577 |
August 2006 | 6,538 | 1 | 158,938 | 767 | 166,244 |
September 2006 | 6,202 | 1 | 158,340 | 762 | 165,305 |
October 2006 | 6,068 | 7 | 160,669 | 648 | 167,392 |
November 2006 | 6,494 | 1 | 167,598 | 548 | 174,641 |
December 2006 | 6,517 | 1 | 170,187 | 546 | 177,251 |
January 2007 | 6,529 | 10 | 173,081 | 541 | 180,161 |
February 2007 | 6,883 | 2 | 187,211 | 467 | 194,563 |
March 2007 | 6,784 | 2 | 191,924 | 469 | 199,179 |
April 2007* | 6,784 | 2 | 195,844 | 462 | 203,092 |
- : Negligible.
* : As on April 13, 2007. |
India holds the fifth largest stock of reserves among the emerging
market economies. The overall approach to the management of India’s foreign
exchange reserves in recent years reflects the changing composition of the balance
of payments and the ‘liquidity risks’ associated with different types
of flows and other requirements. Taking these factors into account, India’s
foreign exchange reserves continued to be at a comfortable level and consistent
with the rate of growth, the share of external sector in the economy and the size
of risk-adjusted capital flows.
External Debt
India’s total external debt was placed at US $ 142.7 billion at end-December
2006, an increase of US $ 16.2 billion over end-March 2006. The increase during
the period was mainly on account of higher external commercial borrowings and
NRI deposits. As noted earlier, higher commercial borrowings could be attributed
to sustained investment and import demand, while the rise in NRI deposits was
partly on account of higher interest rates on these deposits for the period. Almost
46 per cent of the external debt stock was denominated in US dollars followed
by the Indian Rupee (19 per cent), SDR (14 per cent) and Japanese Yen (12 per
cent). Sustainability indicators such as the ratio of short-term to total debt
and short-term debt to reserves remained almost unchanged between end-March 2006
and end-December 2006 and continued to be at quite low and comfortable levels
(Table 62). Foreign exchange reserves remain in excess of
the stock of external debt.
Table
62: India’s External Debt | (US
$ million) | Indicator | End-March | End-March | End-March | End-June | End-Sept | End-Dec |
| | 1995 | 2005 | 2006 | 2006 | 2006 | 2006 |
1 | | 2 | 3 | 4 | 5 | 6 | 7 |
1. | Multilateral | 28,542 | 31,702 | 32,559 | 33,101 | 33,594 | 34,569 |
2. | Bilateral | 20,270 | 16,930 | 15,727 | 15,833 | 15,734 | 15,770 |
3. | International Monetary
Fund | 4,300 | 0 | 0 | 0 | 0 | 0 |
4. | Trade Credit | 6,629 | 4,980 | 5,398 | 5,498 | 5,658 | 5957 |
5. | External Commercial Borrowings | 12,991 | 27,024 | 26,869 | 31,114 | 32,421 | 35,980 |
6. | NRI Deposit | 12,383 | 32,743 | 35,134 | 35,651 | 36,515 | 38,382 |
7. | Rupee Debt | 9,624 | 2,301 | 2,031 | 1,915 | 1,921 | 1,983 |
8. | Long-term (1 to 7) | 94,739 | 1,15,680 | 1,17,718 | 1,23,112 | 1,25,843 | 132,641 |
9. | Short-term | 4,269 | 7,524 | 8,696 | 9,105 | 10,625 | 10,015 |
Total (8+9) | 99,008 | 1,23,204 | 1,26,414 | 1,32,217 | 1,36,468 | 142,656 |
Memo: | | | | | | (Per
cent) | Total debt /GDP | 30.8 | 17.3 | 15.8 | .. | .. | .. |
Short-term/Total debt | 4.3 | 6.1 | 6.9 | 6.9 | 7.8 | 7.0 |
Short-term debt/Reserves | 16.9 | 5.3 | 5.7 | 5.6 | 6.4 | 5.7 |
Concessional debt/Total debt | 45.3 | 33.0 | 31.2 | 30.1 | 29.3 | 28.3 |
Reserves/ Total debt | 25.4 | 114.9 | 120.0 | 123.2 | 121.1 | 124.3 |
Debt Service Ratio* | 25.9 | 6.1 | 9.9 | .. | .. | .. |
* : Relates to the fiscal year.
.. : Not available. | International Investment
Position
India’s international assets increased by US
$ 16.4 billion during the half year ended September 2006 over end-March 2006 levels,
mainly on account of an increase in reserve assets. India’s direct investment
abroad also maintained its rising trend, reflecting growing investment interest
by Indian companies in the overseas markets. International liabilities of the
country expanded by US $ 14.5 billion between end-March 2006 and end-September
2006, reflecting inflows on account of direct and portfolio investment, recourse
to commercial borrowings and non-resident deposits. As the increase in international
assets exceeded that in international liabilities during the period, India’s
net international liabilities declined by US $ 1.9 billion between end-March 2006
and end-September 2006 (Table 63).
Table
63: International Investment Position of India | (US
$ billion) | Period | | | March
2005 PR | March 2006
PR | June
2006
PR | September 2006
P |
1 | | | | | 2 | 3 | 4 | 5 |
A. | Assets | | | 168.2 | 183.5 | 191.8 | 199.9 |
| | | | | (23.5) | (22.9) | .. | .. |
| 1. | Direct
Investment | | 10.0 | 13.0 | 13.6 | 14.4 |
| 2. | Portfolio
Investment | | 0.8 | 1.3 | 1.1 | 1.2 |
| | 2.1 | Equity
Securities | 0.4 | 0.7 | 0.5 | 0.5 |
| | 2.2 | Debt
Securities | | 0.4 | 0.6 | 0.6 | 0.7 |
| 3. | Other
Investment | | 15.9 | 17.6 | 14.2 | 18.9 |
| | 3.1 | Trade
Credits | | 2.2 | 0.4 | 0.3 | 2.8 |
| | 3.2 | Loans | | 1.9 | 2.6 | 1.6 | 2.3 |
| | 3.3 | Currency
and Deposits | 8.4 | 11.2 | 8.9 | 10.3 |
| | 3.4 | Other
Assets | | 3.4 | 3.5 | 3.5 | 3.6 |
| 4. | Reserve
Assets | | 141.5 | 151.6 | 162.9 | 165.3 |
| | | | | (19.8) | (19.0) | .. | .. |
B. | Liabilities | | 210.0 | 231.3 | 238.3 | 245.8 |
| | | | | (29.4) | (28.9) | .. | .. |
| 1. | Direct
Investment | | 44.0 | 50.7 | 51.5 | 54.9 |
| | | | | (6.2) | (6.3) | .. | .. |
| 2. | Portfolio
Investment | | 55.7 | 64.6 | 64.8 | 67.4 |
| | | | | (7.8) | (8.1) | .. | .. |
| | 2.1 | Equity
Securities | 43.2 | 54.7 | 52.5 | 54.8 |
| | 2.2 | Debt
Securities | | 12.5 | 9.9 | 12.4 | 12.6 |
| 3. | Other
Investment | | 110.3 | 116.0 | 122.0 | 123.5 |
| | | | | (15.4) | (14.5) | .. | .. |
| | 3.1 | Trade
Credits | | 9.6 | 10.5 | 10.9 | 12.4 |
| | 3.2 | Loans | | 65.7 | 68.2 | 70.7 | 72.2 |
| | 3.3 | Currency
and Deposits | 33.6 | 36.2 | 39.2 | 37.6 |
| | 3.4 | Other
Liabilities | | 1.4 | 1.1 | 1.2 | 1.4 |
C. | Net
Position (A-B) | | -41.8 | -47.8 | -46.4 | -45.9 |
| | | | | (-5.9) | (-6.0) | .. | .. |
PR : Partially Revised.
P : Provisional.
Note : Figures in parentheses are percentages to GDP. |
|
 IST,
IST,


