During 2006-07, both exports and imports recorded strong growth, albeit with some moderation. Growth in oil imports as well as oil exports remained high, notwithstanding some deceleration. Merchandise trade deficit widened further in consonance with higher investment and economic activity. Net invisibles surplus remained buoyant during 2006-07, led by exports of services and remittances. The surplus on the invisibles account continued to finance a large part of the deficit on the merchandise trade account. As a result, the current account deficit as a proportion to GDP was contained at the previous year’s level. Net capital inflows were substantially higher than those in 2005-06 reflecting large flows under foreign direct investment (FDI) and external commercial borrowings. With capital flows (net) remaining well above the current account deficit, there was an accretion of US $ 47.6 billion to foreign exchange reserves during 2006-07 (US $ 10.1 billion in 2005-06). While the stock of external debt rose, that of net international liabilities fell during 2006-07.
During 2007-08 (April-May), merchandise exports and imports exhibited acceleration in growth. Capital flows have remained buoyant. Foreign exchange reserves have increased further by US $ 22.9 billion during 2007-08 (up to July 20, 2007).
International Developments
After expanding at an impressive pace of 5.5 per cent in 2006, global economic activity in 2007 so far has remained buoyant, fuelled by growth in major emerging markets. Amongst the major advanced economies, growth of the US economy recorded a marked slowdown to 1.9 per cent in the first quarter of 2007 due to negative contributions from net exports, inventories and residential investment. At the same time, consumption continues to hold up well and there is some evidence of a rebound of growth in the US in the second quarter. In the euro area, growth remained robust, benefiting from strong domestic as well as export demand. Various surveys suggest the continuance of the growth momentum in the second quarter in the euro area. Japan also recorded strong growth in the first quarter of 2007, largely on account of support provided by exports, business fixed investment and the steady recovery of consumption (Table 48). In emerging Asia, economic activity remained robust, led by China and India. Net exports and domestic demand maintained a strong momentum in major economies of the region.
According to the projections released by the International Monetary Fund (IMF) in July 2007, growth in the world economy is likely to moderate to 5.2 per cent in 2007 as also in 2008 from 5.5 per cent in 2006 (Table 49). While global economic activity has remained resilient during 2007 so far, protectionist pressures, further rise in oil prices, persisting global imbalances, adjustment in the US on
Table 48: Growth Rates – Global Scenario |
(Per cent) |
Country |
2004 |
2005 |
2006 |
2007 P |
2008 P |
2006 |
2007 |
|
|
|
|
|
|
Q1 |
Q2 |
Q3 |
Q4 |
Q1 |
1 |
2 |
3 |
4 |
5 |
6 |
7 |
8 |
9 |
10 |
11 |
Advanced Economies |
|
|
|
|
|
|
|
|
|
|
Euro area |
2.0 |
1.5 |
2.8 |
2.6 |
2.5 |
2.2 |
2.7 |
2.8 |
3.3 |
3.0 |
Japan |
2.7 |
1.9 |
2.2 |
2.6 |
2.0 |
3.0 |
2.1 |
1.4 |
2.2 |
2.6 |
Korea |
4.7 |
4.2 |
5.0 |
4.4 |
4.4 |
6.3 |
5.1 |
4.8 |
4.0 |
4.0 |
UK |
3.3 |
1.8 |
2.8 |
2.9 |
2.7 |
2.4 |
2.7 |
2.9 |
3.0 |
3.0 |
US |
3.9 |
3.2 |
3.3 |
2.0 |
2.8 |
3.7 |
3.5 |
3.0 |
3.1 |
1.9 |
OECD Countries |
3.2 |
2.5 |
3.0 |
2.5 |
2.7 |
3.3 |
3.4 |
3.0 |
3.3 |
2.7 |
Emerging Economies |
|
|
|
|
|
|
|
|
|
|
Argentina |
9.0 |
9.2 |
8.5 |
7.5 |
5.5 |
8.6 |
7.9 |
8.7 |
8.6 |
8.0 |
Brazil |
5.7 |
2.9 |
3.7 |
4.4 |
4.2 |
3.9 |
1.1 |
4.4 |
4.4 |
4.3 |
China |
10.1 |
10.4 |
11.1 |
11.2 |
10.5 |
10.3 |
10.9 |
10.7 |
10.7 |
11.1 |
India |
7.5 |
9.0 |
9.4 |
9.0 |
8.4 |
10.0 |
9.6 |
10.2 |
8.7 |
9.1 |
Indonesia |
5.0 |
5.7 |
5.5 |
6.0 |
6.3 |
5.0 |
5.0 |
5.9 |
6.1 |
6.0 |
Malaysia |
7.2 |
5.2 |
5.9 |
5.5 |
5.8 |
6.0 |
6.1 |
6.0 |
5.7 |
5.3 |
Thailand |
6.3 |
4.5 |
5.0 |
4.5 |
4.8 |
6.1 |
5.0 |
4.7 |
4.3 |
4.3 |
P : IMF Projections.
Note : Data for India in columns 2 to 4 refer to fiscal years 2004-05, 2005-06 and 2006 07, respectively.
Source : International Monetary Fund; The Economist; and the OECD. |
Table 49: Select Economic Indicators – World |
Item |
|
2001 |
2002 |
2003 |
2004 |
2005 |
2006 |
2007P |
2008P |
1 |
|
2 |
3 |
4 |
5 |
6 |
7 |
8 |
9 |
I. |
|
World Output (Per cent change) # |
2.5 |
3.1 |
4.0 |
5.3 |
4.9 |
5.5 |
5.2 |
5.2 |
|
|
|
|
(1.5) |
(1.8) |
(2.6) |
(4.0) |
(3.4) |
(3.9) |
(3.6) |
(3.7) |
|
|
i) |
Advanced economies |
1.2 |
1.6 |
1.9 |
3.3 |
2.6 |
3.1 |
2.6 |
2.8 |
|
|
ii) |
Other emerging market and
developing countries |
4.3 |
5.0 |
6.7 |
7.7 |
7.5 |
8.1 |
8.0 |
7.6 |
|
|
|
of which: Developing Asia |
6.0 |
7.0 |
8.4 |
8.7 |
9.2 |
9.7 |
9.6 |
9.1 |
II. |
|
Consumer Price Inflation (Per cent) |
|
|
|
|
|
|
|
|
|
|
i) |
Advanced economies |
2.1 |
1.5 |
1.8 |
2.0 |
2.3 |
2.3 |
2.0 |
2.1 |
|
|
ii) |
Other emerging market and
developing countries |
6.7 |
5.8 |
5.8 |
5.6 |
5.4 |
5.3 |
5.7 |
5.0 |
|
|
|
of which: Developing Asia |
2.7 |
2.0 |
2.5 |
4.1 |
3.6 |
4.0 |
3.9 |
3.4 |
III. |
|
Net Capital Flows* (US $ billion) |
|
|
|
|
|
|
|
|
|
|
i) |
Net private capital flows (a+b+c) |
70.2 |
88.3 |
173.3 |
238.6 |
257.2 |
255.8 |
252.7 |
259.3 |
|
|
|
a) Net private direct investment |
182.8 |
152.2 |
165.3 |
190.0 |
266.3 |
266.9 |
283.7 |
288.9 |
|
|
|
b) Net private portfolio investment |
-80.5 |
-90.9 |
-12.1 |
25.0 |
29.4 |
-76.3 |
-62.0 |
-52.2 |
|
|
|
c) Net other private capital flows |
-32.1 |
26.9 |
20.1 |
23.5 |
-38.5 |
65.2 |
30.9 |
22.6 |
|
|
ii) |
Net official flows |
6.6 |
2.3 |
-44.5 |
-57.8 |
-122.6 |
-143.8 |
-96.4 |
-116.6 |
IV. |
|
World Trade @ |
|
|
|
|
|
|
|
|
|
|
i) Volume |
0.2 |
3.4 |
5.4 |
10.6 |
7.5 |
9.4 |
7.1 |
7.4 |
|
|
ii) Price deflator (in US dollars) |
-3.5 |
1.2 |
10.4 |
9.8 |
5.5 |
5.4 |
2.8 |
0.8 |
V. |
|
Current Account Balance
(Per cent to GDP) |
|
|
|
|
|
|
|
|
|
|
i) |
US |
-3.8 |
-4.5 |
-4.8 |
-5.7 |
-6.4 |
-6.5 |
-6.1 |
-6.0 |
|
|
ii) |
China |
1.3 |
2.4 |
2.8 |
3.6 |
7.2 |
9.1 |
10.0 |
10.5 |
|
|
iii) |
Middle East |
6.2 |
4.7 |
8.4 |
12.1 |
18.8 |
18.1 |
12.1 |
10.7 |
P : IMF Projections.
# : Growth rates are based on exchange rates at purchasing power parities.
Figures in parentheses are growth rates at market exchange rates.
* : Net capital flows to emerging market and developing countries.
@ : Average of annual percentage change for world exports and imports of goods and services.
Source : World Economic Outlook, April 2007; World Economic Outlook Update, July 2007,
International Monetary Fund. |
Table 50: Growth in Exports - Global Scenario |
(Per cent) |
Region/Country |
2005 |
2006 |
2006 Q1 |
2007-Q1 |
1 |
2 |
3 |
4 |
5 |
World |
14.1 |
15.5 |
11.8 |
18.5 |
Industrial Countries |
8.5 |
12.6 |
8.2 |
12.9 |
US |
10.8 |
14.5 |
14.2 |
10.8 |
France |
4.0 |
9.7 |
3.4 |
9.4 |
Germany |
7.3 |
15.1 |
6.2 |
20.8 |
Japan |
5.2 |
9.2 |
5.3 |
5.4 |
Developing Countries |
22.1 |
19.2 |
16.7 |
25.8 |
Non-Oil Developing Countries |
19.2 |
19.6 |
18.9 |
27.7 |
China |
28.4 |
27.2 |
26.6 |
27.8 |
India |
29.6 |
21.5 |
13.0 |
12.6 |
Indonesia |
22.9 |
19.0 |
15.2 |
9.7 |
Korea |
12.0 |
14.4 |
10.6 |
14.6 |
Malaysia |
12.0 |
14.0 |
14.0 |
7.6 |
Singapore |
15.6 |
18.4 |
23.0 |
9.9 |
Thailand |
14.5 |
18.7 |
18.4 |
17.2 |
Source : International Financial Statistics, International Monetary Fund; DGCI&S for India. |
account of housing slowdown and potential shifts in financial market sentiment pose downward risks to global growth prospects.
According to the IMF, world trade of goods and services is expected to moderate to 7.1 per cent in volume terms in 2007 from 9.4 per cent in the preceding year. Exports of emerging market and developing countries are projected to grow by 10.7 per cent in 2007 (11.1 per cent a year ago), while those of advanced countries are expected to grow by 5.5 per cent (8.5 per cent a year ago) (see Table 49).
World exports (in US dollar terms) in the first quarter of 2007 posted an accelerated growth (18.5 per cent from 11.8 per cent a year ago) (Table 50).
Balance of Payments: 2006-07
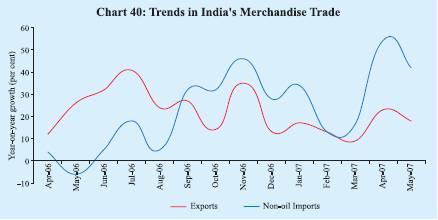
According to the Directorate General of Commercial Intelligence and Statistics (DGCI&S), India’s merchandise exports posted a growth of 20.9 per cent in 2006-07 (23.4 per cent a year ago), while merchandise imports grew by 21.6 per cent in 2006-07 (33.8 per cent in 2005-06) (Chart 40).
Commodity-wise data available for 2006-07 (April-February) indicate that exports of both primary products and manufactured products exhibited moderation in growth. The moderation was on account of the decline in the exports of gems and jewellery and deceleration in textiles, chemicals and ores and minerals (Table 51). On the other hand, tea, spices, sugar and molasses, engineering goods and petroleum products maintained the growth momentum. Engineering goods and petroleum products together contributed 62 per cent to total export growth during 2006-07 (April-February).
Destination-wise, export growth decelerated to almost all major markets during 2006-07 (April-February), with the exception of the UAE (Table 52). The US remained the major market for India’s exports with a share of 15.0 per cent, followed by the UAE (9.6 per cent), China (6.5 per cent), Singapore (4.8 per cent) and the UK (4.5 per cent).
Both oil and non-oil imports exhibited moderation in growth during 2006-07. The deceleration in non-oil imports was partly due to decline in imports of pearls, precious and semi-precious stones. On the other hand, imports of capital goods
Table 51: Exports of Principal Commodities |
Commodity Group |
US $ billion |
Variation (per cent) |
|
|
2005-06 |
2005-06 |
2006-07 |
2005-06 |
2005-06 |
2006-07 |
|
|
|
April-February |
|
April-February |
1 |
|
2 |
3 |
4 |
5 |
6 |
7 |
1. |
Primary Products |
16.4 |
14.3 |
16.8 |
20.8 |
27.2 |
17.5 |
|
of which: |
|
|
|
|
|
|
|
a) Agriculture and Allied Products |
10.2 |
9.0 |
10.8 |
20.5 |
21.9 |
20.3 |
|
b) Ores and Minerals |
6.2 |
5.3 |
6.0 |
21.4 |
37.4 |
12.9 |
2. |
Manufactured Goods |
72.2 |
64.3 |
73.9 |
18.9 |
21.2 |
15.0 |
|
of which: |
|
|
|
|
|
|
|
a) Chemicals and Related Products |
14.8 |
13.1 |
14.9 |
18.6 |
18.9 |
14.2 |
|
b) Engineering Goods |
21.5 |
19.0 |
25.6 |
23.7 |
27.8 |
36.2 |
|
c) Textiles and Textile Products |
16.3 |
14.6 |
15.3 |
20.6 |
22.5 |
4.8 |
|
d) Gems and Jewellery |
15.5 |
13.9 |
13.8 |
12.8 |
15.5 |
-0.5 |
3. |
Petroleum Products |
11.5 |
10.6 |
16.9 |
64.9 |
67.7 |
59.1 |
4. |
Total Exports |
103.1 |
91.5 |
112.5 |
23.4 |
26.2 |
23.1 |
Memo: |
Non-oil Exports |
91.6 |
80.9 |
95.6 |
19.6 |
22.2 |
18.3 |
Source : DGCI&S. |
Table 52: Direction of India’s Exports |
Group/Country |
US $ billion |
Variation (per cent) |
|
|
2005-06 |
2005-06 |
2006-07 |
2005-06 |
2005-06 |
2006-07 |
|
|
|
April-February |
|
April-February |
1 |
|
2 |
3 |
4 |
5 |
6 |
7 |
1. |
OECD Countries |
45.8 |
41.1 |
46.5 |
25.6 |
27.9 |
13.2 |
|
of which: |
|
|
|
|
|
|
|
a) EU |
22.4 |
20.1 |
23.1 |
27.6 |
31.1 |
14.9 |
|
b) North America |
18.4 |
16.5 |
17.9 |
25.6 |
26.3 |
8.8 |
|
US |
17.4 |
15.6 |
16.9 |
26.1 |
26.6 |
8.8 |
2. |
OPEC |
15.2 |
13.5 |
18.6 |
15.4 |
16.5 |
38.0 |
|
of which: |
|
|
|
|
|
|
|
UAE |
8.6 |
7.6 |
10.8 |
16.9 |
18.7 |
42.0 |
3. Developing Countries |
39.7 |
34.9 |
44.9 |
25.8 |
30.2 |
28.6 |
|
of which: |
|
|
|
|
|
|
|
Asia |
31.0 |
27.1 |
33.5 |
24.1 |
29.4 |
23.7 |
|
People’s Republic of China |
6.8 |
5.8 |
7.3 |
20.4 |
38.6 |
25.6 |
|
Singapore |
5.4 |
4.8 |
5.4 |
35.6 |
40.2 |
13.6 |
4. |
Total Exports |
103.1 |
91.5 |
112.5 |
23.4 |
26.2 |
23.1 |
Source : DGCI&S. |
continued to record a buoyant growth in consonance with strong domestic investment activity. Capital goods accounted for 45 per cent of the growth in non-oil imports during 2006-07 (April-February). Imports of gold and silver increased sharply, partly on account of higher prices (Table 53).
Source-wise, China was the major source of non-oil imports during 2006-07 (April-February) (14.1 per cent of total non-oil imports), followed by the US (8.1 per cent), Switzerland (7.2 per cent), Germany (6.0 per cent) and Australia (5.6 per cent).
Table 53: Imports of Principal Commodities |
Commodity Group |
US $ billion |
Variation (per cent) |
|
2005-06 |
2005-06 |
2006-07 |
2005-06 |
2005-06 |
2006-07 |
|
|
April-February |
|
April-February |
1 |
2 |
3 |
4 |
5 |
6 |
7 |
Petroleum, Petroleum Products and |
|
|
|
|
|
|
Related Material |
44.0 |
39.8 |
52.2 |
47.3 |
49.7 |
31.2 |
Edible Oils |
2.0 |
1.8 |
1.9 |
-17.9 |
-20.9 |
7.6 |
Iron and Steel |
4.6 |
4.1 |
5.7 |
71.3 |
79.1 |
39.7 |
Capital Goods |
37.7 |
28.5 |
37.8 |
49.9 |
38.1 |
32.5 |
Pearls, Precious and Semi-Precious Stones |
9.1 |
8.6 |
6.6 |
-3.1 |
3.9 |
-23.3 |
Chemicals |
7.0 |
6.3 |
7.1 |
22.5 |
27.8 |
13.0 |
Gold and Silver |
11.3 |
10.1 |
13.1 |
1.5 |
-0.4 |
29.2 |
Total Imports |
149.2 |
129.4 |
162.5 |
33.8 |
33.0 |
25.5 |
Memo: |
Non-oil Imports |
105.2 |
89.6 |
110.3 |
28.8 |
26.8 |
23.0 |
Non-oil Imports excluding Gold and Silver |
93.9 |
79.5 |
97.2 |
33.1 |
31.4 |
22.3 |
Mainly Industrial Imports* |
87.5 |
73.7 |
89.5 |
34.7 |
32.7 |
21.5 |
* : Non-oil imports net of gold and silver, bulk consumption goods,
manufactured fertilisers and professional instruments. |
Source : DGCI&S. |
Considering the overall imports (including oil), China was the major source accounting for 9.7 per cent followed by Saudi Arabia (7.6 per cent), the US (5.7 per cent), Switzerland (4.9 per cent), the UAE (4.7 per cent) and Germany (4.1 per cent).
During 2006-07 (April-February), India’s overall trade deficit was the highest against Saudi Arabia (US $ 10.1 billion) followed by China (US $ 8.4 billion), Switzerland (US $ 7.6 billion) and Australia (US $ 5.4 billion). India recorded a trade surplus of US $ 7.7 billion with the US. It is noteworthy that China has emerged as the single most significant source of imports for India and India’s overall trade deficit with China is second only to Saudi Arabia.
The merchandise trade deficit, on balance of payments basis, rose from US $ 51.8 billion in 2005-06 to US $ 64.9 billion in 2006-07. As a proportion of GDP, the trade deficit widened from 6.4 per cent to 7.1 per cent.
Current Account
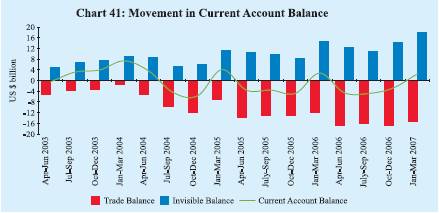
Net surplus under invisibles (services, transfers and income taken together) remained buoyant during 2006-07 and increased from US $ 42.7 billion (5.3 per cent of GDP) in 2005-06 to US $ 55.3 billion (6.0 per cent of GDP) in 2006-07. Exports of services and inflows under remittances remained the key drivers of the net surplus (Table 54). Amongst miscellaneous services, both software and non-software continued to record robust growth. Investment income deficit narrowed from a year ago, on account of higher earnings on India’s external assets.
The net invisible surplus offset a large part of the trade deficit (85 per cent during 2006-07 as compared with 82 per cent during 2005-06). Reflecting the support provided by the invisibles surplus, the current account deficit was contained at US $ 9.6 billion in 2006-07 (US $ 9.2 billion in the previous year). As a proportion of GDP, the current account deficit at 1.1 per cent in 2006-07 was the same as in 2005-06
Table 54: Invisibles Account (Net) |
(US $ million) |
Item |
2005-06PR |
2006-07P |
2005-06PR |
2006-07 |
|
April-March |
Jan- |
April- |
July- |
Oct.- |
Jan- |
|
|
|
March |
June PR |
Sept. PR |
Dec. PR |
March P |
1 |
2 |
3 |
4 |
5 |
6 |
7 |
8 |
Services |
23,881 |
32,727 |
7,465 |
7,965 |
7,268 |
7,467 |
10,027 |
Travel |
1,389 |
2,188 |
601 |
220 |
-31 |
792 |
1,207 |
Transportation |
-1,550 |
-788 |
-463 |
-314 |
-31 |
-255 |
-188 |
Insurance |
22 |
559 |
-78 |
111 |
162 |
92 |
194 |
Government, not included elsewhere |
-197 |
-144 |
-90 |
-24 |
-62 |
-11 |
-47 |
Software |
22,262 |
28,798 |
6,665 |
6,601 |
6,678 |
6,864 |
8,655 |
Other Services |
1,955 |
2,114 |
830 |
1,371 |
552 |
-15 |
206 |
Transfers |
24,284 |
27,415 |
7,347 |
5,692 |
5,226 |
7,844 |
8,653 |
Investment Income |
-4,921 |
-4,282 |
-180 |
-1,147 |
-1,300 |
-1,088 |
-747 |
Compensation of Employees |
-589 |
-564 |
-124 |
-131 |
-162 |
-133 |
-138 |
Total |
42,655 |
55,296 |
14,508 |
12,379 |
11,032 |
14,090 |
17,795 |
PR : Partially Revised. P : Preliminary. |
Table 55: India's Balance of Payments |
(US $ million) |
Item |
2005-06 PR |
2006-07 P |
2005-06 PR |
2006-07 |
|
April-March |
Jan-March |
April- June PR |
July- Sept. PR |
Oct.- Dec. PR |
Jan- March P |
1 |
2 |
3 |
4 |
5 |
6 |
7 |
8 |
Exports |
1,05,152 |
1,27,090 |
30,579 |
29,674 |
32,700 |
30,664 |
34,052 |
Imports |
1,56,993 |
1,91,995 |
42,331 |
46,620 |
48,562 |
47,529 |
49,284 |
Trade Balance |
-51,841 |
-64,905 |
-11,752 |
-16,946 |
-15,862 |
-16,865 |
-15,232 |
|
(-6.4) |
(-7.1) |
|
|
|
|
|
Invisible Receipts |
92,294 |
1,19,163 |
28,700 |
24,643 |
25,597 |
31,658 |
37,265 |
Invisible Payments |
49,639 |
63,867 |
14,192 |
12,264 |
14,565 |
17,568 |
19,470 |
Invisibles, net |
42,655 |
55,296 |
14,508 |
12,379 |
11,032 |
14,090 |
17,795 |
|
(5.3) |
(6.0) |
|
|
|
|
|
Current Account |
-9,186 |
-9,609 |
2,756 |
-4,567 |
-4,830 |
-2,775 |
2,563 |
|
(-1.1) |
(-1.1) |
|
|
|
|
|
Capital Account (net)* |
24,238 |
46,215 |
10,465 |
10,946 |
7,100 |
10,280 |
17,889 |
|
[29,738] @ |
|
|
|
|
|
|
of which: |
|
|
|
|
|
|
|
Foreign Direct Investment |
4,730 |
8,437 |
1,383 |
1,416 |
2,426 |
2,558 |
2,037 |
Portfolio Investment |
12,494 |
7,062 |
4,333 |
-505 |
2,152 |
3,569 |
1,846 |
External Commercial |
2,723 |
16,084 |
3,934 |
3,959 |
1,458 |
3,994 |
6,673 |
Borrowings $ |
[8,223] @ |
|
|
|
|
|
|
Short-term Trade Credit |
1,708 |
3,275 |
-23 |
417 |
1,554 |
-316 |
1,620 |
External Assistance |
1,682 |
1,770 |
592 |
49 |
337 |
633 |
751 |
NRI Deposits |
2,789 |
3,895 |
1,675 |
1,231 |
797 |
1,236 |
631 |
Change in Reserves # |
-15,052 |
-36,606 |
-13,221 |
-6,379 |
-2,270 |
-7,505 |
-20,452 |
Memo: |
Current Account net of |
-33,288 |
-36,804 |
-4,472 |
-10,280 |
-10,047 |
-10,429 |
-6,048 |
private transfers |
(-4.1) |
(-4.0) |
|
|
|
|
|
P : Preliminary. PR : Partially Revised.
* : Includes errors and omissions. $ : Medium and long-term borrowings.
# : On balance of payments basis (excluding valuation); (-) indicates increase.
@ : Excluding the IMD redemption.
Note : Figures in parentheses are percentages to GDP. |
(Table 55 and Chart 41). Net of remittances, the current account deficit was 4.0 per cent of GDP in 2006-07 (4.1 per cent in 2005-06 and 3.3 per cent in 2004-05).
Capital Flows
Net capital flows to India increased from US $ 24.2 billion during 2005-06 to US $ 46.2 billion during 2006-07, led by foreign direct investment (FDI) inflows and external commercial borrowings (ECBs) (see Table 55). FDI inflows at US $ 19.5 billion during 2006-07 were more than two and a half times those of the previous year (Table 56), mainly on account of positive investment climate and growing investor interest in the Indian economy amidst gradual liberalisation of the policy regime with regard to FDI. FDI was channelled mainly into manufacturing, financial services and computer services. Mauritius, the US, and the Netherland were the dominant sources of FDI to India. Alongwith the jump in inward FDI inflows, there was a large increase in outward foreign direct investment from US $ 2.9 billion during 2005-06 to US $ 11.0 billion during 2006-07, reflecting large overseas acquisitions by the Indian corporates to gain market shares and reap economies of scale, amidst the progressive liberalisation of the external payments regime. Both FDI inflows and outflows during 2006-07 included one transaction amounting to US $ 3.1 billion involving swap of shares. Net of this transaction, FDI inflows and outflows at US $ 16.4 billion and US $ 7.9 billion, respectively, during 2006-07 were significantly higher than the previous year.
India follows the internationally accepted definition of FDI. According to the IMF definition, FDI is the category of international investment that reflects the objective of obtaining a lasting interest by a resident entity in one economy in an enterprise resident in another economy. The lasting interest implies the existence of a long-term relationship between the direct investor and the enterprise and a significant degree of influence by the investor on the management of the enterprise. In line with international best practices, FDI includes both equity capital, reinvested earnings (retained earnings of FDI companies) and ‘other direct capital’ (intercorporate debt transactions between related entities). Data on equity capital
Table 56: Capital Flows |
(US $ million) |
Item |
2005-06 |
2006-07 |
2006-07 |
2007-08 |
|
(April-March) |
(April-March) |
(April) |
(April) |
1 |
2 |
3 |
4 |
5 |
Foreign Direct Investment (FDI) into India |
7,722 |
19,531 # |
661 |
1,551 |
FDI Abroad |
(-) 2,931 |
(-) 11,005 # |
– |
– |
FIIs (net) |
9,926 |
3,225 |
-1,955 * |
8,417 * |
ADRs/GDRs |
2,552 |
3,776 |
435 |
11 |
External Assistance (net) |
1,682 |
1,770 |
– |
– |
External Commercial Borrowings (net) |
|
|
|
|
(Medium and long-term) |
8,223 @ |
16,084 |
– |
– |
Short-term Trade Credits (net) |
1,708 |
3,275 |
– |
– |
NRI Deposits (net) |
2,789 |
3,895 |
253 |
(-) 274 |
# : Includes swap of shares of US $ 3.1 billion. @ : Excluding IMD redemption.
– : Not available. * : Up to July 13.
Note : Data on FIIs presented in this table represent inflows into the country.
They may differ from data relating to net investment in stock exchanges by FIIs. |
include equity of unincorporated entities (mainly foreign bank branches in India and Indian bank branches operating abroad) besides equity of incorporated bodies.
Foreign institutional investors (FIIs) continued to invest in the Indian capital market during 2006-07, although the inflows (US $ 3.2 billion) were only a third of the preceding year. With corporates resorting to greater issue of American depository receipts (ADRs)/global depository receipts (GDRs) abroad, capital inflows through this route were higher than FII inflows during 2006-07.
According to the IMF definition, portfolio investment refers to cross-border transactions and positions involving debt or equity securities, other than those included in direct investment or reserve assets. Generally, FIIs include hedge funds, insurance companies, pension funds and mutual funds. In India, FIIs include overseas pension funds, mutual funds, investment trusts, asset management companies, nominee companies, banks, institutional portfolio managers, university funds, endowments, foundations, charitable trusts, charitable societies, a trustee or power of attorney holder incorporated or established outside India proposing to make proprietary investments or investments on behalf of a broad-based fund (i.e., fund having more than 20 investors with no single investor holding more than 10 per cent of the shares or units of the fund). India is among the largest recipients of portfolio inflows among EMEs.
Net drawals under ECBs rose from US $ 2.7 billion during 2005-06 (US $ 8.2 billion adjusted for the redemption of India Millennium Deposits) to US $ 16.1 billion during 2006-07, reflecting sustained domestic investment and import demand, and some hardening of domestic interest rates. Net inflows under the various NRI deposit schemes at US $ 3.9 billion during 2006-07 exceeded those of US $ 2.8 billion during the previous year, partly due to the higher interest rates on various deposit schemes for the large part of 2006-07. The ceiling interest rate on NRE deposits was initially raised by 25 basis points each in November 2005 and April 2006 but was subsequently scaled down by 50 basis points each in January 2007 and April 2007 to “LIBOR/swap rates of US dollar”. Similarly, the ceiling interest rate on FCNR(B) deposits was raised by 25 basis points to “LIBOR/ swap rates for the respective currency/maturity” in March 2006 but was reduced by 25 basis points in January 2007 and by a further 50 basis points to “LIBOR minus 75 basis points” in April 2007.
With net capital flows being substantially higher than the current account deficit, the overall balance of payments recorded a surplus of US $ 36.6 billion in 2006-07 (US $ 15.1 billion in 2005-06).
External Debt
India’s total external debt was placed at US $ 155.0 billion at end-March 2007, an increase of US $ 28.6 billion over end-March 2006. The increase in external debt during the period was mainly on account of the rise in external
Table 57: India’s External Debt |
(US $ million) |
Item |
End-March |
End-March |
End-March |
End-June |
End-Sept |
End-Dec |
End-March |
|
1995 |
2005 |
2006 |
2006 |
2006 |
2006 |
2007 |
1 |
2 |
3 |
4 |
5 |
6 |
7 |
8 |
1. |
Multilateral |
28,542 |
31,702 |
32,559 |
33,101 |
33,594 |
34,569 |
35,641 |
2. |
Bilateral |
20,270 |
16,930 |
15,727 |
15,833 |
15,734 |
15,770 |
16,104 |
3. |
International Monetary Fund |
4,300 |
0 |
0 |
0 |
0 |
0 |
0 |
4. |
Trade Credit |
6,629 |
4,980 |
5,398 |
5,498 |
5,658 |
5,957 |
6,964 |
5. |
External Commercial Borrowings |
12,991 |
27,024 |
26,869 |
31,114 |
32,421 |
35,980 |
42,780 |
6. |
NRI Deposits |
12,383 |
32,743 |
35,134 |
35,651 |
36,515 |
38,382 |
39,624 |
7. |
Rupee Debt |
9,624 |
2,301 |
2,031 |
1,915 |
1,921 |
1,983 |
1,949 |
8. |
Long-term (1 to 7) |
94,739 |
1,15,680 |
1,17,718 |
1,23,112 |
1,25,843 |
1,32,641 |
1,43,062 |
9. |
Short-term |
4,269 |
7,524 |
8,696 |
9,105 |
10,625 |
10,015 |
11,971 |
Total (8+9) |
99,008 |
1,23,204 |
1,26,414 |
1,32,217 |
1,36,468 |
142,656 |
1,55,033 |
Memo: |
(Per cent) |
Total debt/GDP |
30.8 |
17.3 |
15.8 |
– |
– |
– |
16.4 |
Short-term/Total debt |
4.3 |
6.1 |
6.9 |
6.9 |
7.8 |
7.0 |
7.7 |
Short-term debt/Reserves |
16.9 |
5.3 |
5.7 |
5.6 |
6.4 |
5.7 |
6.0 |
Concessional debt/Total debt |
45.3 |
33.0 |
31.2 |
30.1 |
29.3 |
28.3 |
25.7 |
Reserves/Total debt |
25.4 |
114.9 |
119.9 |
123.2 |
121.1 |
124.3 |
128.5 |
Debt Service Ratio* |
25.9 |
6.1 |
9.9 |
– |
– |
– |
4.8 |
* : Relates to the fiscal year. – : Not Available. |
commercial borrowings and NRI deposits, as alluded to earlier. About 49 per cent of the external debt stock was denominated in US dollar, followed by the Indian Rupee (17.4 per cent), SDR (13.3 per cent) and Japanese Yen (12.5 per cent). The ratios of short-term to total debt and short-term debt to reserves recorded modest increases between end-March 2006 and end-March 2007 (Table 57). Foreign exchange reserves remained in excess of the stock of external debt.
International Investment Position
India’s net international liabilities declined by US $ 4.6 billion between end-March 2006 and end-December 2006, as the increase in international assets (US $ 41.1 billion) exceeded that in international liabilities (US $ 36.4 billion) (Table 58). The increase in international assets was mainly on account of reserve assets, while that in international liabilities reflected inflows on account of direct and portfolio investment, commercial borrowings and non-resident deposits.
Developments during 2007-08
According to the DGCI&S data, growth in merchandise exports as well as imports accelerated during April-May 2007. While exports increased by 20.2 per cent, imports expanded by 33.0 per cent. The increase in merchandise imports was led by non-oil imports, which recorded a growth of 47.3 per cent. Growth in oil imports moderated, mainly reflecting the impact of international crude oil prices. The Indian basket of crude oil price at US $ 65.6 per barrel in April-May 2007 was lower by 2.1 per cent than a year ago (US $ 67.0 per barrel in April-May 2006).
Table 58: International Investment Position of India |
(US $ billion) |
Item |
March |
March |
June |
September |
December |
|
2005 PR |
2006 PR |
2006 PR |
2006 P |
2006 P |
1 |
2 |
3 |
4 |
5 |
6 |
A. Assets |
168.2 |
183.5 |
192.1 |
198.2 |
224.5 |
|
(23.5) |
(22.9) |
|
|
|
|
1. |
Direct Investment |
10.0 |
13.0 |
14.1 |
15.3 |
21.6 |
|
2. |
Portfolio Investment |
0.8 |
1.3 |
1.1 |
1.2 |
1.2 |
|
|
2.1 |
Equity Securities |
0.4 |
0.7 |
0.5 |
0.5 |
0.6 |
|
|
2.2 |
Debt Securities |
0.4 |
0.6 |
0.6 |
0.7 |
0.6 |
|
3. |
Other Investment |
15.9 |
17.6 |
14.0 |
16.4 |
24.4 |
|
|
3.1 |
Trade Credits |
2.2 |
0.4 |
0.1 |
0.3 |
4.1 |
|
|
3.2 |
Loans |
1.9 |
2.6 |
1.6 |
2.2 |
3.6 |
|
|
3.3 |
Currency and Deposits |
8.4 |
11.2 |
8.8 |
10.3 |
12.9 |
|
|
3.4 |
Other Assets |
3.4 |
3.5 |
3.5 |
3.6 |
3.8 |
|
4. |
Reserve Assets |
141.5 |
151.6 |
162.9 |
165.3 |
177.3 |
|
(19.8) |
(19.0) |
|
|
|
B. Liabilities |
210.0 |
231.3 |
237.3 |
246.0 |
267.7 |
|
|
|
|
(29.4) |
(28.9) |
|
|
|
|
1. |
Direct Investment |
44.0 |
50.7 |
51.6 |
55.1 |
65.3 |
|
|
|
|
(6.2) |
(6.3) |
|
|
|
|
2. |
Portfolio Investment |
55.7 |
64.6 |
64.7 |
67.4 |
73.6 |
|
|
|
|
(7.8) |
(8.1) |
|
|
|
|
|
2.1 |
Equity Securities |
43.2 |
54.7 |
52.5 |
54.8 |
60.0 |
|
|
2.2 |
Debt Securities |
12.5 |
9.9 |
12.2 |
12.6 |
13.6 |
|
3. |
Other Investment |
110.3 |
116.0 |
121.0 |
123.5 |
128.8 |
|
(15.4) |
(14.5) |
|
|
|
|
|
3.1 |
Trade Credits |
9.6 |
10.5 |
10.9 |
12.4 |
11.8 |
|
|
3.2 |
Loans |
65.7 |
68.2 |
70.7 |
72.2 |
76.2 |
|
|
3.3 |
Currency and Deposits |
33.6 |
36.2 |
38.2 |
37.5 |
39.4 |
|
|
3.4 |
Other Liabilities |
1.4 |
1.1 |
1.2 |
1.4 |
1.4 |
C. |
Net Position (A-B) |
-41.8 |
-47.8 |
-45.2 |
-47.8 |
-43.2 |
|
(-5.9) |
(-6.0) |
|
|
|
PR : Partially Revised. P : Provisional.
Note : Figures in parentheses are percentages to GDP. |
The trade deficit widened to US $ 13.3 billion in April-May 2007 from US $ 8.2 billion in April-May 2006 (Table 59).
Table 59: India’s Merchandise Trade |
(US $ billion) |
Item |
2005-06 |
2006-07 |
2006-07 |
2007-08 |
|
|
|
April-May |
1 |
2 |
3 |
4 |
5 |
Exports |
103.1 |
124.6 |
18.6 |
22.4 |
Imports |
149.2 |
181.3 |
26.9 |
35.7 |
Oil |
44.0 |
57.3 |
8.8 |
9.2 |
Non-oil |
105.2 |
124.0 |
18.0 |
26.5 |
Trade Balance |
-46.1 |
-56.7 |
-8.2 |
-13.3 |
Non-Oil Trade Balance |
-13.6 |
-14.7 * |
-1.8 |
– |
Variation (per cent) |
Exports |
23.4 |
20.9 |
19.2 |
20.2 |
Imports |
33.8 |
21.6 |
16.9 |
33.0 |
Oil |
47.3 |
30.4 |
39.1 |
3.7 |
Non-oil |
28.8 |
17.9 |
8.4 |
47.3 |
* : April-February. – : not available. Source : DGCI&S. |
Available information on capital flows indicates that FDI inflows were US $ 1.6 billion during April 2007 (US $ 0.7 billion a year ago). During 2007-08 (up to July 13, 2007), FIIs registered net inflows of US $ 8.4 billion as compared with net outflows of US $ 2.0 billion in the corresponding period of 2006-07. Non-resident deposits registered net outflows amounting to US $ 274 million during April 2007 as against net inflows of US $ 253 million during April 2006.
India’s foreign exchange reserves were US $ 222.0 billion on July 20, 2007, an increase of US $ 22.9 billion over end-March 2007 level (Table 60). India holds the fifth largest stock of reserves among the emerging market economies. The overall approach to the management of India’s foreign exchange reserves in recent years reflects the changing composition of the balance of payments and the ‘liquidity risks’ associated with different types of flows and other requirements. Taking these factors into account, India’s foreign exchange reserves continued to be at a comfortable level and consistent with the rate of growth, the share of external sector in the economy and the size of risk-adjusted capital flows.
India’s foreign exchange reserves increased from US$ 5.8 billion at end-March 1991 to US $ 199.2 billion by end-March 2007. The accretion to foreign exchange reserves was on account of net capital flows, which amounted to US $ 212.2 billion over the period, partly offset by a deficit of US $ 34.1 billion in current account. Valuation changes also added US $ 15.3 billion to reserves. Of the components of capital flows, cumulative foreign investment inflows (net) amounted to US $ 109.3 billion (including US $ 52.0 billion under FII inflows), external commercial borrowings (net) were US $ 37.6 billion and net inflows under NRI deposits were US $ 29.2 billion.
A comparison of major reserve holding countries over the period 2000-2006 shows that current account surpluses accounted for179 per cent and 138 per cent of accretion to reserves in Japan and Russia, respectively, and 56 per cent each in case of China and Korea. In contrast, in India, over the same period, accretion to foreign exchange reserves was almost entirely due to capital inflows. While net capital inflows were US $ 143.9 billion during 2000-2006, total reserves increased by US $ 143.8 billion over the same period.
Table 60: Foreign Exchange Reserves |
(US $ million) |
Month |
Gold |
SDR |
Foreign Currency |
Reserve Position |
Total |
|
|
|
Assets |
in the IMF |
(2+3+4+5) |
1 |
2 |
3 |
4 |
5 |
6 |
March 1995 |
4,370 |
7 |
20,809 |
331 |
25,517 |
March 2000 |
2,974 |
4 |
35,058 |
658 |
38,694 |
March 2005 |
4,500 |
5 |
135,571 |
1,438 |
141,514 |
March 2006 |
5,755 |
3 |
145,108 |
756 |
151,622 |
March 2007 |
6,784 |
2 |
191,924 |
469 |
199,179 |
April 2007 |
7,036 |
11 |
196,899 |
463 |
204,409 |
May 2007 |
6,911 |
1 |
200,697 |
459 |
208,068 |
June 2007 |
6,787 |
1 |
206,114 |
460 |
213,362 |
July 2007 * |
6,787 |
1 |
214,790 |
465 |
222,043 |
* : As on July 20, 2007. |
|
 IST,
IST,


