India’s balance of payments position has remained comfortable during 2007-08 so far. Merchandise exports after registering robust growth in 2006-07, witnessed some moderation during April-August 2007. Cumulative imports during April-August 2007 posted a high growth rate; oil imports, however, witnessed a sharp deceleration from the strong growth recorded during the corresponding period of the previous year. Net invisibles surplus remained buoyant during the first quarter of 2007-08, led by higher growth in private transfers. The surplus on the invisibles account contained the current account deficit at broadly the same level as in the first quarter of 2006-07. Net capital inflows were substantially higher than those in the corresponding period of 2006-07, reflecting large flows under portfolio investment and external commercial borrowings. Foreign exchange reserves increased further by US $ 62.0 billion during 2007-08 (up to October 19, 2007).
International Developments
The global economy sustained strong growth of above 5 per cent during the first half of 2007. Growth in the US economy, however, moderated during this period, as the housing correction continued to apply considerable drag. While private consumption growth slowed markedly in the US in the face of rising gasoline prices, net external demand provided a significant boost to growth –exports benefited from strong partner country growth combined with the weakening dollar, while imports weakened in line with slower household spending. Growth in the Euro area, Japan and OECD countries slowed in the second quarter after two quarters of high growth (Table 48). The slowdown in the Japanese economy during the second quarter was largely driven by decline in public and residential investment and weaker consumption growth. The Chinese economy, on the other hand, gained further momentum growing by 11.5 per cent during the first half of 2007. India and Russia also continued to grow at a rapid pace. These three countries alone have accounted for one half of global growth over the past year. China for the first time has become the largest contributor to the world growth both in terms of market as well PPP based exchange rates. According to the International Monetary Fund (IMF), India is projected to record 8.9 per cent growth in 2007. Developing Asia is projected to grow by 9.8 per cent in 2007 and 8.8 per cent in 2008.
The current global expansion has been the strongest period of growth since the early 1970s and it is also remarkable in other dimensions. First, with the rapid growth of world trade, openness (exports plus imports as proportion to GDP) has risen by over 10 percentage points since 2001, while financial openness (capital inflows plus outflows as proportion to GDP) has also risen rapidly. Second,
Table 48: Growth Rates – Global Scenario |
(Per cent) |
Region/Country |
2004 |
2005 |
2006 |
2007 P |
2008 P |
2006 |
2007 |
|
|
|
|
|
|
Q1 |
Q2 |
Q3 |
Q4 |
Q1 |
Q2 |
1 |
2 |
3 |
4 |
5 |
6 |
7 |
8 |
9 |
10 |
11 |
12 |
Advanced Economies |
|
|
|
|
|
|
|
|
|
|
|
Euro area |
2.0 |
1.5 |
2.8 |
2.5 |
2.1 |
2.2 |
2.7 |
2.8 |
3.3 |
3.0 |
2.5 |
Japan |
2.7 |
1.9 |
2.2 |
2.0 |
1.7 |
3.0 |
2.1 |
1.4 |
2.2 |
2.6 |
1.6 |
Korea |
4.7 |
4.2 |
5.0 |
4.8 |
4.6 |
6.3 |
5.1 |
4.8 |
4.0 |
4.0 |
5.0 |
UK |
3.3 |
1.8 |
2.8 |
3.1 |
2.3 |
2.4 |
2.7 |
2.9 |
3.0 |
3.0 |
3.1 |
US |
3.6 |
3.1 |
2.9 |
1.9 |
1.9 |
3.3 |
3.2 |
2.4 |
2.6 |
1.5 |
1.9 |
OECD Countries |
3.1 |
2.5 |
2.9 |
2.7 |
2.7 |
3.2 |
3.3 |
2.8 |
3.1 |
2.6 |
2.5 |
Emerging Economies |
|
|
|
|
|
|
|
|
|
|
|
Argentina |
9.0 |
9.2 |
8.5 |
7.5 |
5.5 |
8.6 |
7.9 |
8.7 |
8.6 |
8.0 |
8.7 |
Brazil |
5.7 |
2.9 |
3.7 |
4.4 |
4.0 |
3.9 |
1.1 |
4.4 |
4.4 |
4.3 |
5.4 |
China |
10.1 |
10.4 |
11.1 |
11.5 |
10.0 |
10.3 |
10.9 |
10.7 |
10.7 |
11.1 |
11.5 |
India |
7.5 |
9.0 |
9.4 |
8.9 |
8.4 |
10.0 |
9.6 |
10.2 |
8.7 |
9.1 |
9.3 |
Indonesia |
5.0 |
5.7 |
5.5 |
6.2 |
6.1 |
5.0 |
5.0 |
5.9 |
6.1 |
6.0 |
6.3 |
Malaysia |
7.2 |
5.2 |
5.9 |
5.8 |
5.6 |
6.0 |
6.1 |
6.0 |
5.7 |
5.3 |
5.7 |
Thailand |
6.3 |
4.5 |
5.0 |
4.0 |
4.5 |
6.1 |
5.0 |
4.7 |
4.3 |
4.3 |
4.4 |
P : IMF Projections.
Note : Data for India in columns 2 to 4 refer to fiscal years 2004-05, 2005-06 and 2006-07, respectively.
Source : International Monetary Fund; The Economist; and the OECD. |
emerging market and developing countries now account for a high share of growth – over two-thirds compared to around half in the 1990s. Third, the growth process has been widespread across countries and regions rather than being driven by only a few dynamic countries. These countries/regions are doing well by their own past standards as reflected in the decline in the dispersion of growth rates relative to trend. Fourth, the volatility of growth has declined substantially.
According to the projections released by the IMF in October 2007, growth in the world economy is likely to moderate to 5.2 per cent in 2007 and 4.8 per cent in 2008 from 5.4 per cent in 2006 (Table 49). The downside risks to the global outlook have increased considerably on account of tightening of credit conditions resulting from reduced risk appetite and less optimistic prospects for a turnaround in the US housing market. The cutback in residential construction is reported to have directly reduced the annual rate of US economic growth by about 0.75 per cent on an average over the past year and half. In case the current conditions persist in mortgage markets, the demand for homes could weaken further, with possible implications for the broader economy. However, at the present juncture, the broad assessment by the IMF is that sound fundamentals and the strong momentum of the emerging market economies will continue to support the solid growth. The extent of the impact on growth will depend on how quickly more normal market liquidity is restored and the extent of the retrenchment in credit market.
According to the IMF, growth in world trade is expected to moderate to 6.6 per cent in volume terms in 2007 from 9.2 per cent in the preceding year (Table 49). Exports of other emerging market and developing countries are projected to grow by 9.2 per cent in 2007 (11.0 per cent a year ago), while those of advanced countries are expected to grow by 5.4 per cent (8.2 per cent a year ago).
Table 49: Select Economic Indicators – World |
Item |
2001 |
2002 |
2003 |
2004 |
2005 |
2006 |
2007P |
2008P |
1 |
2 |
3 |
4 |
5 |
6 |
7 |
8 |
9 |
I. |
World Output (Per cent change) # |
2.5 |
3.1 |
4.0 |
5.3 |
4.8 |
5.4 |
5.2 |
4.8 |
|
|
|
(1.5) |
(1.9) |
(2.6) |
(3.9) |
(3.3) |
(3.8) |
(3.5) |
(3.3) |
|
i) |
Advanced economies |
1.2 |
1.6 |
1.9 |
3.2 |
2.5 |
2.9 |
2.5 |
2.2 |
|
ii) |
Other emerging market and
developing countries |
4.3 |
5.1 |
6.7 |
7.7 |
7.5 |
8.1 |
8.1 |
7.4 |
|
|
of which: Developing Asia |
6.0 |
7.0 |
8.3 |
8.8 |
9.2 |
9.8 |
9.8 |
8.8 |
II. |
Consumer Price Inflation (Per cent) |
|
|
|
|
|
|
|
|
|
i) |
Advanced economies |
2.1 |
1.5 |
1.8 |
2.0 |
2.3 |
2.3 |
2.1 |
2.0 |
|
ii) |
Other emerging market and
developing countries |
6.5 |
5.7 |
5.7 |
5.4 |
5.2 |
5.1 |
5.9 |
5.3 |
|
|
of which: Developing Asia |
2.7 |
2.0 |
2.5 |
4.1 |
3.6 |
4.0 |
5.3 |
4.4 |
III. |
Net Capital Flows* (US $ billion) |
|
|
|
|
|
|
|
|
|
i) |
Net private capital flows (a+b+c)** |
80.6 |
90.1 |
168.3 |
239.4 |
271.1 |
220.9 |
495.4 |
291.3 |
|
|
a) Net private direct investment |
185.9 |
154.7 |
164.4 |
191.5 |
262.7 |
258.3 |
302.2 |
293.9 |
|
|
b) Net private portfolio investment |
-79.8 |
-91.3 |
-11.7 |
21.1 |
23.3 |
-111.9 |
20.6 |
-93.1 |
|
|
c) Net other private capital flows |
-25.8 |
26.0 |
14.5 |
25.1 |
-17.0 |
73.6 |
171.0 |
88.8 |
|
ii) |
Net official flows |
0.1 |
-2.7 |
-48.7 |
-67.2 |
-146.4 |
-165.8 |
-132.1 |
-141.2 |
IV. |
World Trade @ |
|
|
|
|
|
|
|
|
|
i) |
Volume |
0.2 |
3.5 |
5.5 |
10.8 |
7.5 |
9.2 |
6.6 |
6.7 |
|
ii) |
Price deflator (in US dollars) |
-3.5 |
1.2 |
10.4 |
9.5 |
5.7 |
4.8 |
7.0 |
2.4 |
V. |
Current Account Balance (Per cent to GDP) |
|
|
|
|
|
|
|
|
|
i) |
US |
-3.8 |
-4.4 |
-4.8 |
-5.5 |
-6.1 |
-6.2 |
-5.7 |
-5.5 |
|
ii) |
China |
1.3 |
2.4 |
2.8 |
3.6 |
7.2 |
9.4 |
11.7 |
12.2 |
|
iii) |
Middle East |
6.3 |
4.8 |
8.3 |
11.7 |
19.4 |
19.7 |
16.7 |
16.0 |
P : IMF Projections.
# : Growth rates are based on exchange rates at purchasing power parities.
Figures in parentheses are growth rates at market exchange rates.
* : Net capital flows to emerging market and developing countries.
** : On account of data limitations, flows listed under ‘Net private capital flows’ may include some official flows.
@ : Average of annual percentage change for world exports and imports of goods and services.
Source : World Economic Outlook, October 2007, International Monetary Fund. |
World exports (in US dollar terms) in the first six months of 2007 (January-June) recorded a growth of 13.3 per cent (13.5 per cent in the corresponding period a year ago) supported by export growth in industrial countries (Table 50).
Table 50: Growth in Exports - Global Scenario |
(Per cent) |
Region/Country |
2005 |
2006 |
2006 |
2007 |
|
|
|
January – July |
1 |
2 |
3 |
4 |
5 |
World |
14.1 |
15.7 |
13.5* |
13.3 * |
Industrial Countries |
8.5 |
12.6 |
9.9* |
12.4 * |
USA |
10.8 |
14.5 |
13.9 |
11.2 |
France |
4.6 |
10.3 |
8.2* |
10.1 * |
Germany |
7.3 |
15.1 |
7.9* |
19.9 * |
Japan |
5.2 |
9.2 |
7.8# |
7.2 # |
Developing Countries |
22.0 |
19.7 |
18.7 |
15.1 |
Non-Oil Developing Countries |
19.4 |
20.0 |
19.6 |
16.6 |
China |
28.4 |
27.2 |
24.8 |
28.6 |
India |
29.9 |
21.3 |
21.3# |
17.3 # |
Indonesia |
22.9 |
19.0 |
17.6 |
15.4 |
Korea |
12.0 |
14.4 |
13.4 |
14.9 |
Malaysia |
12.0 |
14.0 |
14.8 |
7.5 |
Singapore |
15.6 |
18.4 |
22.4 |
9.3 |
Thailand |
14.5 |
18.7 |
18.8 |
16.1 |
* : January-June. # : January-August.
Source: International Financial Statistics, International Money Fund; DGCI&S for India. |
However, exports from developing countries showed a moderation in growth at 15.1 per cent during January-July 2007 from 18.7 per cent registered during the corresponding period a year ago. Amongst developing countries, exports from China maintained the high growth momentum at 28.6 per cent during January-July 2007.
Merchandise Trade
India’s merchandise exports after registering strong growth in 2006-07, witnessed some moderation in the first five months of 2007-08 (Chart 40). According to the Directorate General of Commercial Intelligence and Statistics (DGCI&S), merchandise exports during 2007-08 (April-August) registered a growth of 18.2 per cent as compared with 27.1 per cent in the corresponding period of the previous year. Imports, on the other hand, posted high growth during April-August 2007-08 (31.0 per cent as compared with 20.6 per cent a year ago). Non-oil imports, which registered a growth of 44.3 per cent (10.9 per cent a year ago), accounted for 93 per cent of the overall import growth during 2007-08 (April-August). Oil imports showed a sharp deceleration in growth at 6.0 per cent as against 44.5 per cent during 2006-07 (April-August).
Commodity-wise data available for April-May 2007 show that the growth in exports emanated mainly from petroleum products, engineering goods and gems and jewellery, which together accounted for 69 per cent of the export growth (66 per cent in April-May 2006). Primary products showed a deceleration in April-May 2007, mainly due to a deceleration in exports of agriculture and allied products. Agricultural products exhibited moderation in growth on account of the decline in exports of raw cotton and sugar. Among the exports of manufactured goods, textiles and textile products exports showed a decline in April-May 2007; gems and jewellery
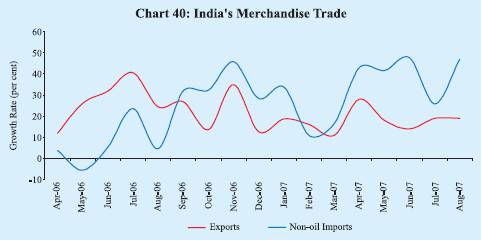
Table 51: Exports of Principal Commodities |
Commodity Group |
US $ billion |
Variation (per cent) |
|
2006-07 |
2006-07 |
2007-08 |
2006-07 |
2006-07 |
2007-08 |
|
|
April-May |
|
April-May |
1 |
2 |
3 |
4 |
5 |
6 |
7 |
1. |
Primary Products |
19.7 |
2.9 |
3.1 |
20.2 |
9.9 |
7.1 |
|
of which: |
|
|
|
|
|
|
|
a) Agriculture and Allied Products |
12.7 |
1.9 |
1.9 |
24.2 |
18.2 |
2.4 |
|
b) Ores and Minerals |
7.0 |
1.0 |
1.2 |
13.6 |
-2.4 |
15.6 |
2. |
Manufactured Goods |
84.9 |
12.6 |
14.1 |
17.0 |
12.2 |
12.7 |
|
of which: |
|
|
|
|
|
|
|
a) Chemicals and Related Products |
17.3 |
2.5 |
2.7 |
17.4 |
12.1 |
7.9 |
|
b) Engineering Goods |
29.6 |
4.1 |
5.3 |
36.1 |
20.2 |
27.9 |
|
c) Textiles and Textile Products |
17.4 |
2.8 |
2.6 |
5.9 |
11.6 |
-7.7 |
|
d) Gems and Jewellery |
16.0 |
2.5 |
2.9 |
2.9 |
3.9 |
18.1 |
3. |
Petroleum Products |
18.7 |
2.4 |
4.0 |
60.5 |
85.6 |
65.0 |
4. |
Total Exports |
126.4 |
18.6 |
23.2 |
22.6 |
18.1 |
24.6 |
Memo: |
Non-oil Exports |
107.7 |
16.2 |
19.2 |
17.7 |
12.0 |
18.6 |
Source : DGCI&S. |
exports witnessed a revival in April-May 2007 with a growth rate of 18.1 per cent as compared with a growth rate of only 3.9 per cent in April-May 2006 (Table 51).
Destination-wise, the US continued to be the major market for India’s exports during 2007-08, though its share declined from 15.4 per cent in April-May 2006 to 13.1 per cent in April-May 2007. The US was followed by the UAE (10.3 per cent), China (5.6 per cent), Singapore (5.1 per cent) and the UK (4.2 per cent). Among the major regions, exports to OPEC decelerated, while that to the European Union (EU) and Asia showed higher growth in April-May 2007 (Table 52).
Table 52: Direction of India’s Exports |
Group/Country |
US $ billion |
Variation (per cent) |
|
|
|
2006-07 |
2007-08 |
2006-07 |
2006-07 |
2006-07 |
|
|
|
April-May |
|
April-May |
1 |
|
2 |
3 |
4 |
5 |
6 |
7 |
1. |
OECD Countries |
52.1 |
7.7 |
8.8 |
13.6 |
12.8 |
15.5 |
|
of which: |
|
|
|
|
|
|
|
a) European Union |
25.8 |
3.8 |
4.6 |
15.3 |
10.4 |
19.9 |
|
b) North America |
20.0 |
3.0 |
3.2 |
9.0 |
17.3 |
5.7 |
|
US |
18.9 |
2.9 |
3.0 |
8.8 |
17.9 |
5.8 |
2. |
OPEC |
20.7 |
3.0 |
3.9 |
35.6 |
42.4 |
30.7 |
|
of which: |
|
|
|
|
|
|
|
UAE |
12.0 |
1.7 |
2.4 |
39.8 |
49.9 |
37.0 |
3. |
Developing Countries |
50.7 |
7.6 |
9.8 |
27.6 |
16.0 |
29.5 |
|
of which: |
|
|
|
|
|
|
|
Asia |
37.6 |
5.9 |
7.0 |
21.3 |
17.1 |
18.0 |
|
People’s Republic of China |
8.3 |
1.2 |
1.3 |
22.7 |
4.4 |
10.1 |
|
Singapore |
6.0 |
1.2 |
1.2 |
11.0 |
16.5 |
-4.5 |
4. |
Total Exports |
126.4 |
18.6 |
23.2 |
22.6 |
18.1 |
24.6 |
Source : DGCI&S. |
Table 53: Imports of Principal Commodities |
Commodity Group |
|
US $ billion |
Variation (per cent) |
|
2006-07 |
2006-07 |
2007-08 |
2006-07 |
2006-07 |
2007-08 |
|
|
April-May |
|
April-May |
1 |
2 |
3 |
4 |
5 |
6 |
7 |
Petroleum, Petroleum Products and |
|
|
|
|
|
|
Related Material |
57.1 |
8.8 |
11.1 |
30.0 |
39.1 |
25.6 |
Edible Oil |
2.1 |
0.4 |
0.3 |
4.2 |
24.2 |
-5.2 |
Iron and Steel |
6.4 |
0.9 |
1.5 |
40.5 |
18.3 |
65.1 |
Capital Goods |
47.1 |
6.3 |
8.2 |
25.0 |
39.6 |
31.1 |
Pearls, Precious and Semi-Precious Stones |
7.5 |
1.2 |
1.5 |
-18.0 |
-29.4 |
23.0 |
Chemicals |
7.8 |
1.1 |
1.5 |
12.1 |
-0.5 |
31.2 |
Gold and Silver |
14.6 |
2.5 |
4.6 |
29.4 |
-25.8 |
82.7 |
Total Imports |
185.7 |
26.9 |
37.0 |
24.5 |
17.0 |
37.5 |
Memo: |
Non-oil Imports |
128.6 |
18.0 |
25.9 |
22.2 |
8.6 |
43.4 |
Non-oil Imports excluding Gold and Silver |
114.0 |
15.5 |
21.3 |
21.4 |
17.5 |
37.0 |
Mainly Industrial Imports* |
104.7 |
14.5 |
20.0 |
19.6 |
17.9 |
38.1 |
* : Non-oil imports net of gold and silver, bulk consumption goods,
manufactured fertilisers and professional instruments.
Source : DGCI&S. |
Commodity-wise data on imports available for April-May 2007 show that growth in non-oil imports was more diversified as compared with April-May 2006. Capital goods continued to be the major contributor to the growth in non-oil imports, but its relative share in growth declined in April-May 2007. On the other hand, the contribution of gold and silver, iron and steel, pearls, precious and semi-precious stones increased. Capital goods accounted for 31.8 per cent of total non-oil imports in April-May 2007 followed by gold and silver (17.8 per cent), metalliferrous ores and metal scrap (6.9 per cent), pearls, precious and semi-precious stones (5.8 per cent) and iron and steel (5.6 per cent) (Table 53).
Source-wise, China was the major source of imports (oil plus non-oil imports) in April-May 2007, accounting for 10.4 per cent of total imports, followed by Switzerland (7.0 per cent), the UAE (6.0 per cent), Saudi Arabia (5.1 per cent), the US (4.8 per cent), Australia (4.8 per cent), Iran (4.6 per cent), Germany (3.9 per cent) and Singapore (3.2 per cent).
Trade deficit during 2007-08 (April-August) widened to US $ 32.5 billion, an increase of US $ 12.6 billion from US $ 19.9 billion a year ago (Table 54). The trade deficit on the oil account increased by US $ 0.7 billion in April-May 2007 to US $ 7.1 billion, while the non-oil trade deficit increased by US $ 4.8 billion to US $ 6.6 billion.
Table 54: India’s Merchandise Trade |
(US $ billion) |
Item |
2005-06 |
2006-07 |
2006-07 |
2007-08 |
|
|
|
|
April-August |
1 |
2 |
3 |
4 |
5 |
Exports |
103.1 |
126.4 |
50.3 |
59.4 |
Imports |
149.2 |
185.7 |
70.2 |
92.0 |
Oil |
44.0 |
57.1 |
24.4 |
25.9 |
Non-oil |
105.2 |
128.6 |
45.8 |
66.1 |
Trade Balance |
-46.1 |
-59.4 |
-19.9 |
-32.5 |
Non-Oil Trade Balance |
-13.8 |
-20.9 |
-3.9 |
– |
Variation (per cent) |
Exports |
23.4 |
22.6 |
27.1 |
18.2 |
Imports |
33.8 |
24.5 |
20.6 |
31.0 |
Oil |
47.3 |
30.0 |
44.5 |
6.0 |
Non-oil |
28.8 |
22.2 |
10.9 |
44.3 |
– : Not Available.
Source: DGCI&S. |
Current Account
Net surplus under invisibles (services, transfers and income taken together) exhibited buoyancy during the first quarter of 2007-08, showing an increase of 36.4 per cent. Exports of services and higher transfer receipts comprising mainly remittances remained the key drivers of the net surplus (Table 55). Amongst services, both software and business services continued to record robust growth. Private transfers during April-June 2007 increased by over 45 per cent over the corresponding quarter of 2006-07.
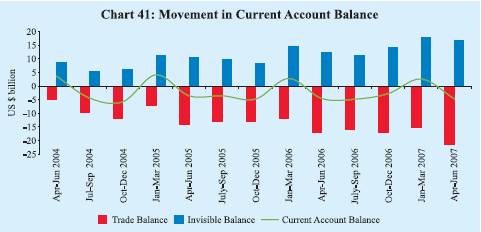
The net invisible surplus offset a large part of the trade deficit – 78.2 per cent during April-June 2007 as compared with 73 per cent during the corresponding period of the previous year. Despite large merchandise trade deficit, higher net invisible surplus, mainly emanating from private transfers, contained the current
Table 55: Invisibles Account (Net) |
(US $ million) |
Item |
2006-07 P |
2006-07 |
2007-08 |
|
April- |
April- |
July- |
Oct.- |
Jan- |
April- |
|
March |
June PR |
Sept. PR |
Dec. PR |
March P |
June P |
1 |
2 |
3 |
4 |
5 |
6 |
7 |
Services |
32,727 |
7,965 |
7,268 |
7,467 |
10,027 |
9,150 |
Travel |
2,188 |
220 |
-31 |
792 |
1,207 |
207 |
Transportation |
-788 |
-314 |
-31 |
-255 |
-188 |
-484 |
Insurance |
559 |
111 |
162 |
92 |
194 |
233 |
Government, not included elsewhere |
-144 |
-24 |
-62 |
-11 |
-47 |
-16 |
Software |
28,798 |
6,601 |
6,678 |
6,864 |
8,655 |
7,884 |
Other Services |
2,114 |
1,371 |
552 |
-15 |
206 |
1,326 |
Transfers |
27,415 |
5,692 |
5,226 |
7,844 |
8,653 |
8,327 |
Investment Income |
-4,282 |
-1,147 |
-1,300 |
-1,088 |
-747 |
-486 |
Compensation of Employees |
-564 |
-131 |
-162 |
-133 |
-138 |
-108 |
Total |
55,296 |
12,379 |
11,032 |
14,090 |
17,795 |
16,883 |
P : Preliminary. PR : Partially Revised. |
Table 56: India’s Balance of Payments |
(US $ million) |
Item |
2006-07 P |
2006-07 |
2007-08 |
|
April- |
April- |
July- |
Oct.- |
Jan- |
April- |
|
March |
June PR |
Sept. PR |
Dec. PR |
March P |
June P |
1 |
2 |
3 |
4 |
5 |
6 |
7 |
Exports |
127,090 |
29,674 |
32,700 |
30,664 |
34,052 |
34,960 |
Imports |
191,995 |
46,620 |
48,562 |
47,529 |
49,284 |
56,540 |
Trade Balance |
-64,905 |
-16,946 |
-15,862 |
-16,865 |
-15,232 |
-21,580 |
|
(-7.1) |
|
|
|
|
|
Invisible Receipts |
119,163 |
24,643 |
25,597 |
31,658 |
37,265 |
31,432 |
Invisible Payments |
63,867 |
12,264 |
14,565 |
17,568 |
19,470 |
14,549 |
Invisibles, net |
55,296 |
12,379 |
11,032 |
14,090 |
17,795 |
16,883 |
|
(6.0) |
|
|
|
|
|
Current Account |
-9,609 |
-4,567 |
-4,830 |
-2,775 |
2,563 |
-4,697 |
|
(-1.1) |
|
|
|
|
|
Capital Account (net)* |
46,215 |
10,946 |
7,100 |
10,280 |
17,889 |
15,897 |
of which: |
|
|
|
|
|
|
Foreign Direct Investment |
8,437 |
1,416 |
2,426 |
2,558 |
2,037 |
461 |
Portfolio Investment |
7,062 |
-505 |
2,152 |
3,569 |
1,846 |
7,458 |
External Commercial Borrowings + |
16,084 |
3,959 |
1,458 |
3,994 |
6,673 |
7,048 |
Short-term Trade Credit |
3,275 |
417 |
1,554 |
-316 |
1,620 |
1,048 |
External Assistance |
1,770 |
49 |
337 |
633 |
751 |
258 |
NRI Deposits |
3,895 |
1,231 |
797 |
1,236 |
631 |
-447@ |
Change in Reserves # |
-36,606 |
-6,379 |
-2,270 |
-7,505 |
-20,452 |
-11,200 |
Memo: |
|
|
|
|
|
|
Current Account net of Private Transfers |
-36,804 |
- 10,280 |
-10,047 |
-10,429 |
-6,048 |
-13,037 |
|
(-4.0) |
|
|
|
|
|
P : Preliminary. PR : Partially Revised.
* : Includes errors and omissions.
# : On balance of payments basis (excluding valuation); (-) indicates increase.
+ : Medium and long-term borrowings. @ : Includes Non-resident Rupee Deposits for April June 2007.
Note : Figures in parentheses are percentages to GDP. |
account deficit at US $ 4.7 billion in the first quarter of 2007-08, broadly at the same level as in the first quarter of 2006-07 (Table 56 and Chart 41). Net of remittances, the current account deficit was US $ 13.0 billion during April-June 2007.
Capital Flows
Capital flows to India have remained buoyant during the financial year 2007-08 so far. Among the major components of capital flows, foreign investment recorded an inflow of US $ 20.7 billion during April-July 2007. Inflows under foreign direct investment (FDI) into India at US $ 6.6 billion during April-July 2007 (US $ 3.7 billion in April-July 2006) witnessed significant increase, reflecting the continuing pace of expansion of domestic activities, positive investment climate, and long-term view of India as the investment destination. FDI was channelled mainly into services sector (34.2 per cent), followed by construction industry (20.6 per cent). While Mauritius continued as the dominant sources of FDI to India, FDI from Singapore exceeded that from the US.
Foreign institutional investors (FIIs) inflows (net) have aggregated US $ 21.2 billion during the current financial year so far (up to October 19, 2007), reflecting, inter alia, strong corporate performance and strong domestic equity markets (Table 57). The number of FIIs registered with the SEBI increased from 997 by end-March 2007 to 1,113 by October 15, 2007. Capital inflows through American depository receipts (ADRs)/global depository receipts (GDRs) abroad amounted to US $ 2.3 billion during April-July 2007.
During the first quarter of 2007-08 (April-June 2007), net inflows under external commercial borrowings (ECBs) continued to be buoyant at US $ 7.0 billion. Ongoing technological upgradation and modernisation combined with expansion of domestic industrial activities have led to increased investment demand by Indian companies, and some hardening of domestic interest rates, which is reflected in higher recourse to ECBs.
Table 57: Capital Flows |
(US $ million) |
Item |
Period |
2006-07 |
2007-08 |
1 |
2 |
3 |
4 |
Foreign Direct Investment (FDI) into India |
April-July |
3,675 |
6,609 |
FDI Abroad |
April-June |
-1,124 |
-5,422 |
FIIs (net) |
April-October * |
933 |
21,209 |
ADRs/GDRs |
April-July |
1,547 |
2,336 |
External Assistance (net) |
April-June |
4 9 |
258 |
External Commercial Borrowings (net) |
|
|
|
(Medium and long-term) |
April-June |
3,959 |
7,048 |
Short-term Trade Credits (net) |
April-June |
417 |
1,048 |
NRI Deposits (net) |
April-July |
1,585 |
-148 |
*: Up to October 19.
Note : Data on FIIs presented in this table represent inflows into the country.
They may differ from data relating to net investment in stock exchanges by FIIs. |
Non-Resident Indian (NRI) deposits during April-July 2007 recorded a net outflow of US $ 148 million, which can be partly attributed to the impact of two downward revisions in ceiling interest rates during January 2007 and April 2007. While there were net inflows under Foreign Currency Non-Resident (Banks) [FCNR(B)] deposits, the higher magnitude of outflows under Non-Resident External Rupee Account [NR(E)RA] deposits resulted in overall net outflows.
With net capital flows being substantially higher than the current account deficit, the overall balance of payments recorded a surplus of US $ 11.2 billion in the first quarter of 2007-08 (US $ 6.4 billion in the first quarter of 2006-07).
Foreign Exchange Reserves
India’s foreign exchange reserves were US $ 261.1 billion as on October 19, 2007, higher by US $ 62.0 billion over end-March 2007. The increase in reserves was mainly due to an increase in foreign currency assets from US $ 191.9 billion during end-March 2007 to US $ 253.3 billion as on October 19, 2007 (Table 58).
India holds the fifth largest stock of reserves among the emerging market economies and sixth largest in the world. The overall approach to the management of India’s foreign exchange reserves in recent years reflects the changing composition of the balance of payments and the ‘liquidity risks’ associated with different types of flows and other requirements. Taking these factors into account, India’s foreign exchange reserves continued to be at a comfortable level and consistent with the rate of growth, the share of external sector in the economy and the size of risk-adjusted capital flows.
Table 58: Foreign Exchange Reserves |
(US $ million) |
Month |
Gold |
SDR |
Foreign
Currency
Assets |
Reserve Position
in the IMF |
Total
(2+3+4+5) |
1 |
2 |
3 |
4 |
5 |
6 |
March 1995 |
4,370 |
7 |
20,809 |
331 |
25,517 |
March 2000 |
2,974 |
4 |
35,058 |
658 |
38,694 |
March 2005 |
4,500 |
5 |
135,571 |
1,438 |
141,514 |
March 2006 |
5,755 |
3 |
145,108 |
756 |
151,622 |
March 2007 |
6,784 |
2 |
191,924 |
469 |
199,179 |
April 2007 |
7,036 |
11 |
196,899 |
463 |
204,409 |
May 2007 |
6,911 |
1 |
200,697 |
459 |
208,068 |
June 2007 |
6,787 |
1 |
206,114 |
460 |
213,362 |
July 2007 |
6,887 |
12 |
219,753 |
455 |
227,107 |
August 2007 |
6,881 |
2 |
221,509 |
455 |
228,847 |
September 2007 |
7,367 |
2 |
239,955 |
438 |
247,762 |
October 2007* |
7,367 |
13 |
253,324 |
439 |
261,143 |
* : As on October 19, 2007. |
External Debt
India’s total external debt was placed at US $ 165.4 billion at end-June 2007, recording an increase of US $ 8.7 billion (5.6 per cent) over end-March 2007. The increase in external debt during the period was mainly on account of higher external commercial borrowings, followed by higher NRI deposits and short-term trade credit. Over 50 per cent of the external debt stock was denominated in US dollars followed by the Indian rupee (18.0 per cent), SDR (12.3 per cent) and Japanese yen (12.0 per cent). Debt sustainability indicators such as the ratio of short-term to total debt and short-term debt to reserves increased marginally between end-March 2007 and end-June 2007. Foreign exchange reserves remained in excess of the stock of external debt (Table 59).
International Investment Position
India’s net international liabilities declined by US $ 2.7 billion between end-March 2006 and end-March 2007, as the increase in international assets (US $ 60.8 billion) exceeded the increase in international liabilities (US $ 58.1 billion) (Table 60). The increase in international assets was mainly on account of reserve assets, which registered an increase of US $ 47.6 billion between end-March 2006 and end-March 2007, followed by direct investment abroad which
Table 59: India’s External Debt |
(US $ million) |
Item |
End-March |
End-March |
End-March |
End-March |
End-June |
|
1995 |
2005 |
2006 |
2007 |
2007 |
1 |
|
2 |
3 |
4 |
5 |
6 |
1. |
Multilateral |
28,542 |
31,698 |
32,559 |
35,641 |
35,958 |
2. |
Bilateral |
20,270 |
17,011 |
15,734 |
16,104 |
15,687 |
3. |
International Monetary Fund |
4,300 |
0 |
0 |
0 |
0 |
4. |
Trade Credit (above 1 year) |
6,629 |
5,021 |
5,419 |
6,964 |
7,782 |
5. |
External Commercial Borrowings |
12,991 |
27,857 |
26,902 |
42,780 |
48,314 |
6. |
NRI Deposit |
12,383 |
32,743 |
36,282 |
41,240 |
42,603 |
7. |
Rupee Debt |
9,624 |
2,301 |
2,031 |
1,949 |
2,031 |
8. |
Long-term (1 to 7) |
94,739 |
116,631 |
118,927 |
144,678 |
152,375 |
9. |
Short-term |
4,269 |
7,529 |
8,696 |
11,971 |
13,019 |
Total (8+9) |
99,008 |
124,160 |
127,623 |
156,649 |
165,394 |
Memo: |
(per cent) |
Total debt /GDP |
30.8 |
17.4 |
16.0 |
16.6 |
– |
Short-term/Total debt |
4.3 |
6.1 |
6.8 |
7.6 |
7.9 |
Short-term debt/Reserves |
16.9 |
5.3 |
5.7 |
6.0 |
6.1 |
Concessional debt/Total debt |
45.3 |
33.1 |
30.9 |
25.5 |
23.8 |
Reserves/ Total debt |
25.4 |
114.0 |
118.8 |
127.1 |
129.0 |
Debt Service Ratio* |
25.9 |
6.1 |
9.9 |
4.8 |
4.6 |
* : Relates to the fiscal year. – : Not Available. |
increased by US $ 11 billion during the same period. International liabilities reflected increases in direct and portfolio investment and loans at end-March 2007 from their levels at end-March 2006. A major part of the liabilities like direct and portfolio investments reflects cumulative inflows, which are at historical prices.
Table 60: International Investment Position of India |
(US $ billion) |
Item |
March |
March |
March |
March |
|
2004 R |
2005 PR |
2006 PR |
2007 P |
1 |
2 |
3 |
4 |
5 |
A. |
Assets |
|
136.0 |
166.8 |
182.8 |
243.6 |
|
(21.3) |
(23.3) |
(22.9) |
(25.7) |
|
1. |
Direct Investment |
7.8 |
10.0 |
13.0 |
24.0 |
|
2. |
Portfolio Investment |
0.4 |
0.5 |
1.0 |
0.8 |
|
|
2.1 |
Equity Securities |
0.2 |
0.3 |
0.5 |
0.4 |
|
|
2.2 |
Debt securities |
0.2 |
0.2 |
0.5 |
0.4 |
|
3. |
Other Investment |
14.9 |
14.8 |
17.2 |
19.7 |
|
|
3.1 |
Trade Credits |
0.5 |
1.1 |
-0.3 |
2.5 |
|
|
3.2 |
Loans |
1.8 |
1.9 |
2.6 |
2.6 |
|
|
3.3 |
Currency and Deposits |
9.5 |
8.4 |
11.6 |
10.3 |
|
|
3.4 |
Other Assets |
3.1 |
3.4 |
3.3 |
4.2 |
|
4. |
Reserve Assets |
113.0 |
141.5 |
151.6 |
199.2 |
|
(17.7) |
(19.8) |
(19.0) |
(21.0) |
B. |
Liabilities |
183.2 |
209.8 |
230.8 |
288.9 |
|
(29.0) |
(29.4) |
(28.9) |
(30.5) |
|
1. |
Direct Investment |
38.2 |
44.5 |
51.1 |
72.3 |
|
(6.0) |
(6.2) |
(6.4) |
(7.6) |
|
2. |
Portfolio Investment |
43.7 |
55.7 |
64.6 |
80.3 |
|
(6.9) |
(7.8) |
(8.1) |
(8.5) |
|
|
2.1 |
Equity Securities |
33.9 |
43.2 |
54.7 |
63.3 |
|
|
2.2 |
Debt securities |
9.8 |
12.5 |
9.9 |
17.0 |
|
3. |
Other Investment |
101.3 |
109.7 |
115.0 |
136.4 |
|
(16.1) |
(15.4) |
(14.4) |
(14.4) |
|
|
3.1 |
Trade Credits |
6.3 |
9.6 |
10.5 |
13.7 |
|
|
3.2 |
Loans |
61.9 |
65.3 |
67.8 |
81.1 |
|
|
3.3 |
Currency and Deposits |
32.2 |
33.6 |
36.2 |
40.7 |
|
|
3.4 |
Other Liabilities |
1.0 |
1.2 |
0.6 |
0.9 |
C. |
Net Position (A-B) |
-47.2 |
-43.0 |
-48.0 |
-45.3 |
|
(-7.6) |
(-6.0) |
(-6.0) |
(-4.8) |
R : Revised. PR : Partially Revised. P : Provisional.
Note : Figures in parentheses represent percentage to GDP. |
|
 IST,
IST,


