VII.1 The various business expectations surveys released recently reflect less than optimistic sentiments prevailing in the economy. The results of professional forecasters’ survey conducted by the Reserve Bank in December 2008 also suggested further moderation in economic activity for 2008-09. The downside risks for economic growth include factors like global economic slowdown and deterioration in global financial markets as also some slowdown in domestic demand, while the positive factors are expected increase in consumption demand in medium term. The upward pressure on primary articles’ inflation, and aggressive monetary easing domestically and internationally constitute upside risks to inflationary expectations. On the positive side, significant easing of international oil prices and softening of international food prices may help in softening the inflationary pressure. On balance, however, the inflation outlook is tilted downwards at the current juncture.
Business Expectations Surveys
VII.2 According to the quarterly business expectations survey of the National Council of Applied Economic Research (NCAER) conducted in October 2008, the overall business confidence index (BCI) for the next six months continued to decline (Table 63). The sustained decline was attributed by the survey to tightening liquidity conditions, high inflation and political uncertainties revolving around the Indo-US nuclear deal. The survey, however, noted that while some issues were resolved, the global economic climate worsened. A component-wise analysis shows that all the four components of BCI, viz., overall economic conditions, investment climate, financial position of firms and capacity utilisation declined over the previous round. The fall in business confidence was noticeable particularly in capital goods and services sectors followed by consumer durable and non-durable sectors, while intermediate goods sector registered no change in confidence levels. All five constituting sectors of BCI, viz., consumer goods (durables and non-durables), capital goods and services, barring intermediates, declined over the previous period. In contrast, the Political Confidence Index surged by 24.9 per cent in October 2008 over July 2008 reflecting regaining of faith by firms in political management of economic policies.
VII.3 According to the quarterly business expectations survey of Confederation of Indian Industry (CII), the business confidence index (CII-BCI) for October-March 2009 has also declined both as compared with the previous six months as well as with the corresponding period in the year earlier (Table 63). The decline reflected uncertainties on global economic outlook and concerns about high cost of funds.
Table 63: Business Expectations Surveys |
Organisation |
Business Expectations |
Growth over a |
Growth over |
|
Period |
Index |
year ago
(per cent) |
previous round
(per cent) |
1 |
2 |
3 |
4 |
5 |
NCAER |
November 2008- April 2009 |
Business Confidence Index |
-17.8 |
-4.7 |
CII |
October 2008-March 2009 |
Business Confidence Index |
-15.1 |
-7.7 |
Dun & Bradstreet |
October-December 2008 |
Business Optimism Index |
-28.0 |
1.8 |
RBI |
January-March 2009 |
Business Expectation Index |
-5.6 |
-5.9 |
VII.4 The composite business optimism index for October-December 2008 compiled by Dun and Bradstreet (D&B) increased moderately as compared with the previous quarter but declined sharply as compared with the previous year and it was the largest magnitude of year-on-year fall ever witnessed in the index. All the six optimism indices - volumes of sales, net profits, selling prices, new orders, inventory levels and employee levels have fallen significantly as compared to the corresponding period last year. Optimism was particularly low among respondents in the services sector.
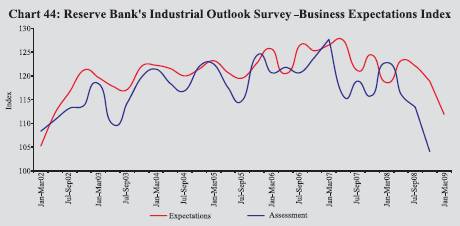
VII.5 According to the Reserve Bank’s Industrial Outlook Survey of manufacturing companies in the private sector, the business expectations indices based on assessment for October-December 2008 and on expectations for January-March 2009 declined by 2.6 per cent and 5.9 per cent, respectively, over the corresponding previous quarters. Similar trend was observed in these indices when compared over the corresponding quarters of the previous year (Chart 44).
VII.6 During the period October 2008-March 2009, optimism on major business sentiment indicators such as overall business situation, overall financial situation, production, order books, capacity utilisation, employment of the company, exports, imports and profit margin significantly declined compared to a year ago. Raw material cost seems to have eased up to a certain extent during October-December 2008 and significantly higher net proportion of respondents view that there would be a ‘decline’ in selling prices from the respective levels in the previous quarter (Table 64).
Table 64: Reserve Bank’s Survey – Net Response on ‘A Quarter Ahead’ Expectations About the Industrial Performance |
Expectations About the Industrial Performance |
Parameter |
Response |
Oct-Dec 2007 |
Jan-Mar 2008 |
Apr-Jun 2008 |
Jul-Sep 2008 |
Oct-Dec |
Jan-Mar |
1 |
2 |
3 |
4 |
5 |
6 |
7 |
8 |
1. |
Overall business situation |
Better |
50.2 |
47.7 |
46.0 |
41.8 |
33.7 |
21.1 |
|
|
|
(42.1) |
(42.9) |
(42.7) |
(42.6) |
(44.1) |
(43.9) |
2. |
Financial situation |
Better |
40.1 |
40.3 |
36.6 |
32.7 |
27.7 |
16.4 |
|
|
|
(51.3) |
(50.3) |
(51.6) |
(53.0) |
(52.5) |
(53.2) |
3. |
Working capital finance requirement |
Increase |
32.2 |
34.7 |
36.6 |
33.6 |
33.8 |
32.9 |
|
|
|
(62.6) |
(60.3) |
(56.5) |
(57.3) |
(57.7) |
(57.1) |
4. |
Availability of finance |
Improve |
33.8 |
31.1 |
32.3 |
30.2 |
23.3 |
13.7 |
|
|
|
(58.8) |
(59.5) |
(58.3) |
(57.9) |
(59.0) |
(56.3) |
5. |
Production |
Increase |
49.0 |
43.9 |
45.2 |
43.5 |
39.8 |
26.0 |
|
|
|
(40.9) |
(42.3) |
(41.0) |
(36.6) |
(42.1) |
(42.3) |
6. |
Order books |
Increase |
44.1 |
37.1 |
41.5 |
38.5 |
35.7 |
20.6 |
|
|
|
(46.0) |
(48.6) |
(44.3) |
(43.5) |
(46.1) |
(46.1) |
7. |
Pending orders, if applicable |
Below
normal |
-3.5 |
0.4 |
-4.3 |
2.2 |
4.6 |
11.5 |
|
|
|
(82.4) |
(80.2) |
(81.3) |
(80.9) |
(82.0) |
(77.8) |
8. |
Cost of raw material |
Decrease |
-42.4 |
-44.1 |
-48.2 |
-54.7 |
-61.1 |
-35.7 |
|
|
|
(51.0) |
(49.2) |
(46.0) |
(39.1) |
(32.3) |
(39.7) |
9. |
Inventory of raw material |
Below average |
-6.3 |
-7.3 |
-7.0 |
-3.8 |
-7.6 |
-3.3 |
|
|
|
(85.0) |
(84.8) |
(83.2) |
(81.8) |
(77.6) |
(81.3) |
10. |
Inventory of finished goods |
Below average |
-3.5 |
-4.5 |
-5.8 |
-1.5 |
-4.3 |
-4.4 |
|
|
|
(86.4) |
(86.1) |
(84.5) |
(84.5) |
(82.6) |
(80.9) |
11. |
Capacity utilisation (Main product) |
Increase |
28.4 |
24.2 |
25.6 |
22.2 |
26.4 |
12.3 |
|
|
|
(61.5) |
(62.3) |
(59.9) |
(58.8) |
(56.0) |
(59.1) |
12. |
Level of capacity utilisation |
Above normal |
10.7 |
6.4 |
9.4 |
3.6 |
-0.5 |
-7.4 |
|
(Compared to the average in the |
|
(77.2) |
(78.3) |
(77.0) |
(74.9) |
(78.7) |
(73.7) |
|
preceding four quarters) |
|
|
|
|
|
|
|
13. |
Assessment of the production |
More than |
4.2 |
4.7 |
8.0 |
4.6 |
5.7 |
11.8 |
|
capacity (With regard to expected |
adequate |
(83.0) |
(83.8) |
(81.2) |
(81.3) |
(81.7) |
(81.0) |
|
demand in the next six months) |
|
|
|
|
|
|
|
14. |
Employment in the company |
Increase |
16.7 |
14.6 |
20.8 |
15.8 |
16.6 |
7.7 |
|
|
|
(74.1) |
(75.6) |
(68.2) |
(71.5) |
(70.4) |
(75.7) |
15. |
Exports, if applicable |
Increase |
31.4 |
24.3 |
27.7 |
27.7 |
27.3 |
16.0 |
|
|
|
(55.9) |
(58.3) |
(53.3) |
(54.9) |
(54.3) |
(54.8) |
16. |
Imports, if any |
Increase |
20.8 |
20.1 |
25.3 |
21.3 |
21.4 |
9.1 |
|
|
|
(68.6) |
(70.5) |
(65.6) |
(66.5) |
(67.9) |
(69.7) |
17. |
Selling prices are expected to |
Increase |
13.0 |
14.9 |
19.1 |
21.0 |
26.2 |
4.1 |
|
|
|
(68.5) |
(67.1) |
(66.0) |
(61.5) |
(57.6) |
(61.7) |
18. |
If increase expected in selling prices |
Increase at |
3.7 |
13.3 |
9.0 |
3.0 |
0.6 |
0.9 |
|
|
lower rate |
(58.9) |
(66.7) |
(64.0) |
(61.3) |
(54.7) |
(54.0) |
19. |
Profit margin |
Increase |
9.6 |
5.4 |
7.2 |
3.8 |
-3.6 |
-12.9 |
|
|
|
(59.6) |
(60.0) |
(61.0) |
(59.8) |
(54.7) |
(53.3) |
Note: 1. ‘Net response’ is measured as the percentage share differential between the companies reporting ‘optimistic’ (positive) and ‘pessimistic’ (negative) responses; responses indicating status quo (no change) are not reckoned. Higher ‘net response’ indicates higher level of confidence and vice versa.
2. Figures in parentheses are the percentages of respondents with ‘no change over the preceding quarter’ as responses. |
VII.7 The ABN-AMRO Purchasing Managers’ Index1 (PMI) for December 2008 touched a record low of 44.4. The PMI survey signalled further declines in both pre- and post-production stocks, with the respective rates of contraction accelerating to the fastest in the survey history. This mainly reflected the deteriorating outlook for the manufacturing sector. The New Orders Index, which is also a leading indicator of economic
Table 65: Median Forecasts of Select Macroeconomic
Indicators by Professional Forecasters 2008-09 |
Professional Forecasters 2008-09 |
|
Actual |
2008-09 |
2009-10 |
|
2007-08 |
Annual |
Q3 |
Q4 |
Q1 |
Q2 |
|
|
E |
L |
E |
L |
E |
L |
E |
L |
E |
L |
1 |
2 |
3 |
4 |
5 |
6 |
7 |
8 |
9 |
10 |
11 |
12 |
1. |
Real GDP growth rate at factor |
|
|
|
|
|
|
|
|
|
|
|
|
cost (in per cent) |
9.0 |
7.7 |
6.8 |
7.6 |
6.1 |
7.6 |
6.2 |
7.5 |
6.1 |
7.8 |
6.3 |
|
a. Agriculture & Allied Activities |
4.5 |
3.0 |
3.0 |
2.5 |
2.5 |
3.0 |
3.5 |
3.0 |
3.0 |
3.0 |
3.0 |
|
b. Industry |
8.1 |
7.0 |
4.9 |
6.9 |
4.0 |
7.5 |
4.0 |
7.3 |
4.0 |
7.0 |
4.5 |
|
c. Services |
10.7 |
9.5 |
9.0 |
9.5 |
8.5 |
9.3 |
8.0 |
9.4 |
7.6 |
9.5 |
8.1 |
2. |
Gross Domestic Saving (per cent of |
|
|
|
|
|
|
|
|
|
|
|
|
GDP at current market price) |
34.8* |
34.8 |
33.0 |
– |
– |
– |
– |
– |
– |
– |
– |
3. |
Gross Domestic Capital |
|
|
|
|
|
|
|
|
|
|
|
|
Formation (per cent of GDP |
|
|
|
|
|
|
|
|
|
|
|
|
at current market price) |
35.9* |
36.3 |
34.9 |
36.2 |
33.0 |
36.0 |
33.0 |
36.0 |
34.0 |
35.8 |
34.3 |
4. |
Corporate profit after tax |
|
|
|
|
|
|
|
|
|
|
|
|
(growth rate in per cent) |
26.2 |
18.0 |
15.0 |
17.5 |
6.5 |
17.8 |
11.0 |
18.0 |
10.0 |
19.0 |
12.5 |
5. |
T-Bill 91 days Yield |
|
|
|
|
|
|
|
|
|
|
|
|
(per cent-end period) |
7.1 |
8.4 |
5.9 |
– |
– |
– |
– |
– |
– |
– |
– |
6. |
10-year Govt. Securities Yield |
|
|
|
|
|
|
|
|
|
|
|
|
(per cent-end period) |
7.9 |
8.5 |
7.0 |
– |
– |
– |
– |
– |
– |
– |
– |
7 |
Exports (growth rate in per cent) |
23.7 |
20.0 |
12.0 |
– |
– |
– |
– |
– |
– |
– |
– |
8 |
Imports (Growth rate in per cent) |
29.9 |
27.2 |
17.7 |
– |
– |
– |
– |
– |
– |
– |
– |
9 |
Trade Balance (US $ billion) |
– |
– |
– |
-31.0 |
-27.0 |
-29.0 |
-24.4 |
-32.0 |
-33.3 |
-30.4 |
-35.5 |
E : Earlier Projection.
L : Latest Projection.
– : Not Available.
* : Pertains to 2006-07.
Note : The latest round refers to sixth round for the quarter ended December 2008, while earlier round refers to fifth round for the quarter ended September 2008.
Source : Survey of Professional Forecasters, Third Quarter 2008-09. |
activity for the next month, has declined sharply in December 2008 to 41.4, signalling the possibility of weakening of activity in the manufacturing sector.
Survey of Professional Forecasters2
VII.8 The results of professional forecasters' survey conducted by the Reserve Bank in December 2008 suggested further moderation in economic activity for 2008-09 on the whole (Table 65). Between the fifth round of survey conducted in September 2008 and sixth round survey in December 2008, median forecast of real GDP growth for 2008-09 was placed at 6.8 per cent, lower than the 7.7 per cent forecast earlier. The sectoral growth rate forecast for the agriculture sector was kept unchanged. However, the sectoral growth rate forecast for industry was revised downwards from 7.0 per cent to 4.9 per cent and for services sector, from 9.5 per cent to 9.0 per cent. The annual growth rate in imports was revised downwards to 17.7 per cent from 27.2 per cent.
VII.9 Forecasts by select agencies for real GDP growth in 2008-09 are set out in Table 66.
Balance of Risks for Growth and Inflation
VII.10 Several significant global and domestic developments recently have rendered the outlook uncertain and have increased the downside risks associated with real GDP growth. The global economic outlook has deteriorated sharply since September 2008 with several countries, notably the US, the UK, the Euro area and Japan experiencing recession. Furthermore, at present, the indications are that the global downturn may be deeper and more protracted than expected earlier. Consequently, the adverse implications through trade and financial channels for emerging economies, including India, have
Table 66: Projections of Real GDP for India by Various Agencies – 2008-09 |
(Per cent) |
Agency |
|
Latest Projection |
Month of |
Earlier Projection |
|
Overall
Growth |
Agriculture |
Industry |
Services |
Projection |
Overall Growth
(Per cent) |
Month |
1 |
2 |
3 |
4 |
5 |
6 |
7 |
8 |
ADB |
7.0 |
– |
– |
– |
Dec-08 |
7.4 |
Sep-08 |
ASSOCHAM |
7.6 |
4.0 |
7.2 |
9.0 |
Nov-08 |
7.6 |
Jul-08 |
Confederation of Indian |
|
|
|
|
|
|
|
Industries (CII) |
Above 8 |
– |
– |
– |
Sep-08 |
8.0-8.5 |
Mar-08 |
CRISIL |
6.5-7.0 |
2.5 |
5.5-6.0 |
8.5-9.0 |
Dec-08 |
7.8 |
Sep-08 |
Economic Advisory |
|
|
|
|
|
|
|
Council to PM |
7.1 |
3.0 |
5.1 |
9.3 |
Jan-09 |
7.7 |
Jul- 08 |
Merrill Lynch |
7.2 |
3.0 |
4.6 |
9.1 |
Dec-08 |
7.5 |
Oct-08 |
Citigroup |
7.2 |
2.0 |
6.1 |
9.4 |
Oct-08 |
7.5 |
Aug-08 |
CMIE |
7.4 |
3.2 |
5.5 |
9.5 |
Jan-09 |
7.5 |
Dec-08 |
NCAER |
7.6 |
2.3 |
8.2 |
9.8 |
Oct-08 |
7.8 |
Jul-08 |
UNCTAD |
7.6 |
– |
– |
– |
Sep-08 |
|
|
IMF (Calendar year) |
7.8 |
– |
– |
– |
Nov-08 |
7.9 |
Oct-08 |
Ministry of Finance, |
|
|
|
|
|
|
|
Government of India |
7.0 |
|
|
|
Dec-08 |
|
|
World Bank |
6.3 |
– |
– |
– |
Dec-08 |
7.0 |
Jun-08 |
Range |
6.3-8.0 |
2.0-4.0 |
4.6-8.2 |
8.5-9.8 |
|
7.0-8.5 |
|
amplified. If the recession is deeper and the recovery is long drawn as is the current expectation, emerging economies have also to contend with second round effects in the form of potential terms of trade losses, erosion of export competitiveness and restricted external financing.
VII.11 The outlook for India going forward is mixed. There is evidence of a slowing down of economic activity. Real GDP growth has moderated in the first half of 2008-09. Industrial activity, particularly in the manufacturing and infrastructure sectors, is decelerating. In the coming months, the services sector too, which has been the prime growth engine for the last five years, is slowing, mainly in the construction, transport and communication, trade, hotels and restaurants subsectors. For the first time in seven years, exports have declined in absolute terms in October and November 2008. Higher input costs and dampened demand have dented corporate margins while the uncertainty surrounding the crisis has affected business confidence. The major inputs of the construction sector, viz., cement and steel continued to record deceleration in growth during April-October 2008. Various leading indicators of services have also witnessed deceleration in growth during 2008-09. The OECD’s latest Composite Index of Leading Indicators (CILI) for India fell by 1.2 point in November 2008 and was 7.6 point lower than a year ago. The OECD suggested a strong slowdown in the industrial sector in India. Furthermore, its analysis exhibited strong slowdown in the industrial sector for Euro area, the US and China during the recent period. It may also be recognised that unlike in the advanced countries where the contagion spread from the financial to the real sector, in India the slowdown in the real sector is affecting the financial sector, which in turn, has a second-order impact on the real sector.
VII.12 On the other hand, some positive factors include an expected increase in consumption demand mainly reflecting rise in basic exemption limits and tax slabs, Sixth Pay Commission awards, debt waiver for farmers and pre-election expenditure. The consumption expenditure is also expected to improve in the medium-run due to changing pattern of demographic profile in India. Furthermore, India’s export destinations have diversified in recent years. Other countries such as China, Hong Kong, Singapore, UAE, Germany and other Asian countries have emerged as important destinations for India’s exports.
VII.13 Overall, the balance of risks on growth outlook is tilted towards downside. While downside risks would be extending to the future, the fall in commodity including oil prices and the coordinated fiscal and monetary stimulus are expected to revive the growth momentum.
VII.14 WPI inflation has fallen sharply from an intra-year peak of 12.9 per cent on August 2, 2008 to 5.6 per cent by January 10, 2009 and the decline has been sustained since August 2008, pointing out to a faster than expected reduction in inflation. Clearly, falling international commodity prices especially those of crude oil, steel and selected food items have been the key drivers behind the decline in inflation rate, although, some contribution has also come from the slowing domestic demand. The reduction in administered prices of petrol and diesel announced in the first week of December 2008 further eased inflationary pressures.
VII.15 Going forward, the outlook on international commodity prices indicate further downward pressure to domestic prices. Crude oil prices are expected to be at lower levels in the year 2009 as compared to 2008 on account of weaker demand across the OECD as well as increasing likelihood of a prolonged global economic downturn. Improved global production prospects of key agricultural items such as cereals and oilseeds are expected to keep food prices lower in 2009. Metal prices are expected to decline reflecting lower manufacturing demand in the OECD countries and some improvement in supply in China. International steel prices, which have remained at elevated levels up to August 2008, have eased since then as the slowdown in demand set in following recession in major advanced economies.
VII.16 On the domestic front, the shortfall in output in major agricultural commodities (food, oilseeds, sugar and cotton) as per the first advance estimates of kharif production for the year 2008-09 is likely to pose upside risks to the prices of these commodities. However, easing international prices along with improved rabi sowing could eventually balance these risks. Among the manufacturing products, prices are expected to moderate for metals in line with international prices. In addition, the pass-through of recent reduction in CENVAT by 4 per cent by the Government of India as part of the fiscal stimulus package would lead to a general reduction in price levels. The moderation in aggregate demand on account of the expected slowdown in economic growth is further expected to diminish the upside risks to inflation in coming months. Overall, the outlook on inflation has shifted to the downside and keeping in view the supply management measures taken by the Government of India and the lagged response to the monetary policy measures taken by the Reserve Bank, the inflation by end-March 2009 is expected to be significantly lower than that projected.
VII.17 Double-digit consumer price inflation during September-December 2008 reflected firm trend in food articles inflation and the higher weight of food articles in measures of consumer price inflation
1 The PMI is a composite indicator designed to provide an overall view of activity in the manufacturing sector. A PMI of 50.0 indicates no change while values above or below this level indicate an expansion or a contraction of the manufacturing activity.
2 Introduced by the Reserve Bank from the quarter ended September 2007. The forecasts made in the section are that of professional forecasters and not that of the Reserve Bank.
|
 IST,
IST,


