 IST,
IST,


VII. Macroeconomic Outlook
The macroeconomic outlook of the Indian economy, as suggested by various forward looking surveys, shows a general improvement in confidence with expectations of further acceleration in activities. The Industrial Outlook Survey conducted by the Reserve Bank shows improvement in the sentiments in the manufacturing sector, in continuation of the trend seen in the previous survey. The Professional Forecasters’ Survey of the Reserve Bank points to upward revision to the growth outlook for 2009-10 from 6.0 per cent in the earlier survey to 6.9 per cent in the latest round. The outlook for growth and inflation is currently conditioned by the emerging upside prospects for growth and upside risks for inflation. Stronger growth outlook may increase the possibility of current high food price inflation causing generalised price pressures, first signs of which were visible in December 2009. VII.1 Since the release of the second quarter GDP data for 2009-10, the assessment about the growth outlook has improved. Recent growth projections of different agencies suggest upward revision to India’s growth outlook for 2009-10. Continuing the optimism witnessed in the last quarter’s business confidence surveys, the bullish sentiments have grown stronger. The Industrial Outlook Survey of the Reserve Bank indicates further improvement in the sentiments of the manufacturing sector. The Professional Forecasters’ Survey conducted in December 2009 shows overall (median) growth rate for 2009-10 at 6.9 per cent, as against 6.0 per cent reported in the previous survey. Business Expectations Surveys VII.2 The forward looking surveys conducted by various agencies generally convey an optimistic picture about the economy. Almost all the surveys report a strong sequential Q-o-Q as well as Y-o-Y improvements (Table 7.1). VII.3 In continuation of the improvement witnessed during the last quarter, the Business Confidence Index (BCI) of the NCAER (National Council of Applied Economic Research) released in October 2009 showed a 21.2 per cent rise over the previous quarter. All four components of BCI recorded improvement, with ‘investment climate’ registering the highest improvement, followed by ‘financial position of the firm’, ‘overall economic conditions’ and ‘capacity utilisation’. A uniform pattern of improvement in BCI has been observed across all the major industrial sectors of the economy. The early indication from the NCAER Survey conducted during December 2009 shows continuation of improvement in BCI over October 2009.
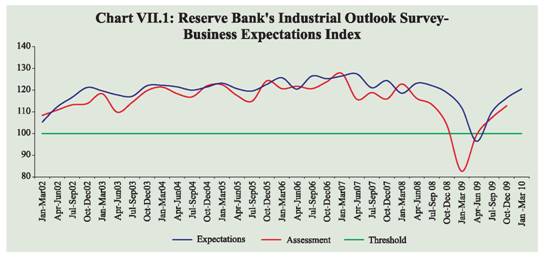
VII.4 The Business Confidence Survey of the FICCI for the second quarter of 2009-10, which was released in December 2009, suggests that 80 per cent of the companies felt overall economic conditions to have improved ‘moderately to substantially’ over previous six months. Overall business confidence index rose by 7.7 per cent over the previous quarter level, as 65 per cent of the survey respondents expected sales volume to increase, 40 per cent expected investment to increase, and 16 per cent foresee the addition to the workforce in the next two quarters. Notwithstanding the overall optimism, 52 per cent and 62 per cent of the respondents reported rising prices of industrial inputs and raw materials, and weakness in market demand respectively, as the concerns that could adversely affect business performance. This was, nevertheless, an improvement over the last year, where 84 per cent of the surveyed companies had viewed market demand as a key concern. In addition, 65 per cent of the companies anticipate an improvement in their order book position in the next six months. VII.5 The Dun and Bradstreet Business Optimism Index (BOI) for Q1 of 2010 recorded a sharp increase of 43.4 per cent on Y-o-Y basis. This increase partly reflected the low base effect, but is also indicative of improving business optimism. Even though on Q-o-Q basis the BOI for Q1 of 2010 registered a marginal decline of 4.1 per cent, this largely reflects the high degree of improvement that was seen in the previous quarter i.e. Q4 of 2009 (by 8.4 per cent). While the optimism parameters for 'volume of sales', 'net profits' and 'new orders' increased, the optimism parameter for 'employee levels' remained unchanged during Q1 of 2010 over the previous quarter. VII.6 The CII Business Confidence Index (CII-BCI) for October-March 2009-10 increased by 7.4 points to 66.1, on top of a modest 2.4 point increase during the first half of 2009-10. During the period when this survey was carried out, the uncertain global economic outlook and slackening consumer demand was continuing to affect confidence levels. Subsequently however, both global economic conditions and domestic private demand have recovered, helping in return of business and consumer confidence. VII.7 The HSBC Market Purchasing Managers’ Index (PMI) for manufacturing for December 2009 climbed to its highest level since May 2009 signaling a robust month-on-month improvement in manufacturing. With this, the PMI has remained above the no-change threshold of 50, signifying expansion, for the ninth month in a row. The stronger domestic and external demand played an important role in maintaining these gains in recent months. Notwithstanding this, the survey mentions that most manufacturers are cautious about the durability of the recovery and are, therefore, reluctant to hire new labourers. Though accelerating input price inflation is also a concern, on balance the survey predicts continuation of recovery at a robust pace. The PMI for services also registered significant expansion during November and December 2009, suggesting that services sector too is picking up steam. The survey results suggest that the growth in total activity and new business accelerated to reach fifteen months’ high. Reserve Bank’s Industrial Outlook Survey VII.8 The 48th round of Industrial Outlook Survey of the Reserve Bank conducted during October-December 2009 showed further improvement in the sentiments of the manufacturing sector, in continuation of the optimism seen during the previous quarter. The survey covered opinions on “assessment for October-December 2009” and “expectations for January–March 2010”, and in line with the trend witnessed since Q2: 2009-10, both indices remained in the growth terrain (i.e. above 100, which is the threshold that separates contraction from expansion) (Chart VII.1). The survey respondents expect the industrial growth to gain further momentum during the last quarter of 2009-10, which has to be seen in the context of significant acceleration in IIP growth already seen during August–November, 2009. VII.9 Better expectations about order books, capacity utilisation and production revealed by the survey are indicative of both improved demand conditions as well as perceptions of further recovery in private demand in the near term. The working capital finance requirement is expected to grow further during the last quarter of 2009-10, which suggests that demand for short term funds from the private sector may rise in the coming months. The availability of finance is expected to improve further in the last quarter of 2009-10. With stronger recovery, the pressure on profit margins is expected to be relieved in the coming months; but with the return of pricing power, inflationary pressures may increase. As a sign of gradual return of the pricing power, the selling prices are expected to increase for the second successive quarter, albeit at a lower rate as compared to the previous quarter. According to the survey findings, the outlook for employment is also improving and firms are expected to increase their workforce on the back of expected increase in demand (Table 7.2). VII.10 The upturn in business expectations is broad-based across industries, with transport equipment, rubber and plastic products, electrical machinery, other machinery and apparatus, basic metals and metal products, food products and pharmaceuticals and medicines expecting overall improvement in performance. Industries like cement, paper and paper products and diversified companies, however, expect weaker performance. In the case of cement industry especially, the capacity utilisation is expected to be lower, which in turn may affect the profitability adversely. The improvement in business outlook varies by size of company, with bigger companies having better expectations as compared to the smaller companies. Survey of Professional Forecasters1 Factors Influencing the Current Growth and Inflation Outlook VII.12 While the growth outlook has improved significantly since the release of the GDP data for the second quarter of 2009-10 and the strong industrial recovery in recent months up to November 2009, the inflationary pressures have firmed up, led by significant increase in food prices. Though the inflationary process still remains largely concentrated in food articles, there is a possibility of gradual spilling over of the pressure to other segments in the WPI basket, early signs of which were seen in December 2009. Thus, growth outlook has clear upside prospects and the inflation outlook has upside risks. VII.13 The current optimism about the growth outlook is driven by: (a) acceleration in GDP growth to 7.9 per cent in Q2: 2009-10; (b) turnaround in exports in November 2009 after 13 consecutive months of decline; (c) strong recovery in IIP growth over successive months; (d) early indications from corporate performance suggesting significant positive growth in corporate sales in Q3 of 2009-10 after a phase of deceleration; (e) continuing trend of improved profitability of the corporate sector; (f) higher growth in core infrastructure sector over the corresponding period of the previous year; (g) revival of private final consumption demand and improvement in ‘gross fixed capital formation’ during Q2 of 2009-10;(h) optimistic business expectations reflected in RBI’s Industrial outlook survey and in similar surveys of other agencies for India; (i) revival in stock market activities, both in terms of stock prices as well as additional mobilisation of resources through IPOs and private placements; (j) revival in capital inflows; (k) signs of recovery in global growth and trade; (l) higher flow of resources from the non-banking financial sector; (m) turnaround in credit growth since November 2009; and (n) higher collection of net direct taxes, with 44 per cent increase in corporate tax collections in December 2009. VII.14 The downside risks to the growth outlook include: (a) global recovery turning out to be not as robust as expected; (b) possibility of an oil price shock; (c) the impact of the deficient South-West monsoon on agricultural output, a large part of which is yet to be reflected in the GDP data; (d) possible pressure on interest rates with revival in demand for credit from the private sector;(e)inventory build-up reaching the cyclical peak, given the turnaround in inventory cycle since Q2 of 2009-10 as per data on corporate performance; and (f) weak performance of services dependent on external demand, notwithstanding the improvement in recent month. VII.15 The upside risks to the already rising inflation path are: (a) supply constraints tapering off only over time in the case of food articles, given the normal crop cycles; (b) indications of rising international food prices, suggesting limited option of resorting to imports to improve the domestic supply conditions; (c) the return of pricing power with stronger recovery and scope for wage-price revisions linked to high CPI inflation; (d) rebound in private demand, with receding uncertainty and improving confidence; (e) rebound in global commodity prices, particularly oil and metals, with stronger recovery in EMEs and advanced economies; (f) asset price increases with higher capital inflows; and (g) early indications of generalised inflation, which may increase inflationary expectations. From the standpoint of monetary policy, the possibility of food price inflation spilling over to other groups in the WPI, through expectations driven price revisions to cause a generalised inflation, remains a major concern. VII.16 Some of the factors which could help in moderating the price pressures include : (a) arrival of post-harvest crops in the last quarter of 2009-10, particularly certain vegetables; (b) additional release of rice and wheat from buffer stock and better distribution; (c) no further increase in minimum support prices; and (d) higher rabi production partly offsetting the impact of weak kharif. VII.17 The outlook for growth has upside prospects with several supportive developments underway. The outlook for inflation is characterised by developments that have upside risks. The emerging growth and inflation mix, thus, suggests that stronger recovery could make the inflation a more generalised process. Reigning in inflation and inflationary expectations while carefully nurturing the growth impulses will be the main challenge for the conduct of monetary policy during the remaining period of the year. 1 Introduced by the Reserve Bank from the quarter ended September 2007. The forecasts reflect the views of professional forecasters and not the Reserve Bank. |
||||||||||||||||||||||||||||||||||||||||

Share this page:


Install the RBI mobile application and get quick access to the latest news!
Scan the QR code to install our app


Page Last Updated on:


