 IST,
IST,
VII. Macroeconomic Outlook
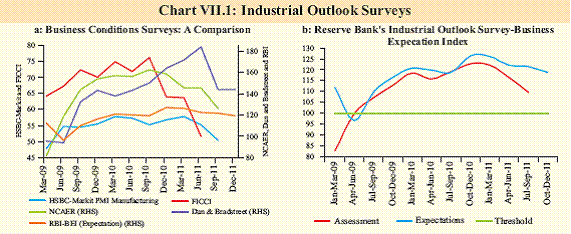
Inflation continues to be sticky while growth risks have increased. The business expectation surveys of various agencies, as well as the Reserve Bank’s Industrial Outlook Survey suggest a weakening of business climate. The professional forecasters’ survey show that forecasts for growth have been revised downwards while those for inflation have been marginally increased. Growth risks increase on global headwinds while sticky inflation adds to complexity VII.1 Growth risks have increased on global headwinds, while inflation continues to be sticky adding to the complexity for monetary policy. Should global downturn accentuate, monetary and fiscal policy space exists, though the current high inflation reduces the degrees of freedom somewhat. The IMF’s baseline projections suggest that global economy would continue to grow at a moderate pace ahead. Recovery is unlikely to peter out even in the case of advanced economies. Nevertheless, in a financial world several outcomes are possible as perceptions of economic agents can shift fast impacting their economic behaviour. It would, therefore, be necessary for all stakeholders - private or government - to quickly build upon the liquidity buffers and hedge against financial risks. VII.2 Even as the global growth cycle seems to be turning, persistence of inflation at high levels would continue to need to be factored in the policy. The baseline projection for WPI inflation for March 2012 was placed at 7.0 per cent at the time of the First Quarter Review of Monetary Policy on July 26, 2011 anticipating some moderation in the later part of the year. Forward-looking assessment suggests that inflation will play out broadly in line with the earlier anticipated path and the risks to the baseline projection are now balanced. VII.3 Generalised inflationary pressures were still in evidence till September 2011. Inflation in non-food manufactured products remained high. Food inflation has surprised on the upside in the recent period in spite of favourable monsoon and likelihood of record kharif output, partly reflecting the large increase in MSPs. VII.4 The benefits of the recent fall in global commodity prices have been largely offset by the rupee depreciation. The benefit from any further fall may also remain limited as a result of the incomplete passthrough of the earlier increase in global commodity prices, as was explained earlier in the RBI Annual Report 2010-11. Since then, suppressed inflation has been partly tackled through revisions in petroleum and electricity prices, but further upward revision cannot be ruled out. VII.5 On the other hand, with weakening economic activity levels, the economy may grow at a rate somewhat lower than what was anticipated earlier. Indicators suggest that growth moderation has continued into Q2 of 2011-12. Growth is also likely to stay weak in the second half of 2011-12, especially if the global downturn continues. As such, challenges from the policy perspective have become even more complex with persistent inflation and increased risks to growth. VII.6 The IMF’s baseline scenario is that the dip in global growth this time around would be far muted than during 2008-09. Yet, it is important for the policymakers to be prepared for tail risk events. In such an event, some room for countercyclical action may be generated with a further fall in commodity prices. Yet, it is important to note in this context that inflation may turn out to be stickier than before due to structural impediments. Further room for front-loaded action may be limited. Headline inflation has now stayed in 8-11 per cent range for the past 21 months. Non-food manufacturing inflation has been more than 7 per cent for the past eight months against a long-term average of 4.4 per cent. Monetary and fiscal policy space exists but inflation constraints important VII.7 Fiscal policy space may be constrained if inflation stays elevated. Currently, government spending is adversely impacting the objective of containment of aggregate demand. On current assessment, the Government is unlikely to meet its deficit targets for 2011-12. A slowdown is likely to impact revenues and tax cuts will be difficult. The fiscal position has macro-economic consequences through its impact on interest rates, exchange rates and price level and is also an important determinant of the costs of overseas borrowings. It is, therefore, important to create fiscal space within the framework of fiscal rules. VII.8 There are upside risks to inflation from still incomplete pass-through of global commodity prices, downward stickiness of food prices, recent revisions in minimum support prices and evidence of wage price spiral. In view of this, the inflation has proved to be stubborn and may subside only slowly in the rest of 2011-12. The challenge at this juncture is to contain inflationary pressures, while factoring in the lags in monetary transmission, which are long and variable and, therefore, difficult to assess. Leading indicators suggest growth may moderate slowly VII.9 Current assessment is that growth may moderate slowly and not fall to the levels seen during the post-Lehman crisis. As such, existing space for monetary management can tackle the growth-inflation challenge along with complimentary demand management and structural policies. Business expectations surveys indicate moderation VII.10 A comparative study of business expectations surveys, conducted by different agencies, indicates stiff moderation in business climate. Both global and domestic factors seem to have weakened the perception about the performance of the economy. The CII and FICCI business confidence indices have shown significant decline over the previous quarter and year too. The CII index stands lower than the index value recorded during the period October- March 2008-09, following the global financial crises. The top two concerns, according to CII Business Outlook Survey are high interest rates and high raw material costs. The latest survey of NCAER on business confidence recorded significant decline in index on both q-o-q and y-o-y basis (Table VII.1). Dun & Bradstreet Business Optimism Index is at the second lowest since September 2010 (Chart VII.1a). Persistent high inflation, weakening demand, lower availability of credit and prevailing global uncertainties appear to be affecting the business sentiments of the Indian companies. VII.11 The seasonally adjusted HSBC Markit Purchasing Managers’ Indices (PMI) for September 2011 indicate the economic activity may be slowing down. Manufacturing PMI registered the weakest expansion in the last twoand- a-half years. While the services PMI pointed towards a stagnation in activity.
Survey suggests Industrial Outlook has weakened VII.12 The 55th round of the Industrial Outlook Survey (/en/web/rbi/-/publications/quarterly-industrial-outlook-survey-july-september-2011-55th-round-1-lt-sup-gt-14026) of the Reserve Bank conducted during July- September 2011, showed further decline in Business Expectation Index (BEI). The index is a composite indicator based on assessment of several business related parameters for the assessment quarter (July-September 2011) as well as for the expectation quarter (October- December 2011). However, BEI still remained in growth terrain (i.e. above 100, which is the mark that separates contraction from expansion) (Chart VII.1b). The demand conditions of the Indian manufacturing sector continued to moderate as net responses on production, order books and exports declined for the assessment as well as expectation quarters. Most industry groups reported lower optimism on demand and financial conditions. VII.13 The outlook on availability of finance was also less optimistic while the respondents expected cost of finance to rise further. A sizeable proportion of respondents anticipated continued increase in raw material costs, which may affect profit margins adversely (Table VII.2). Downward Revision in growth forecast by other agencies VII.14 Various agencies have revised downwards their earlier growth forecasts for India for 2011-12, with some even projecting the growth to be below 8.0 per cent (Table VII.3).
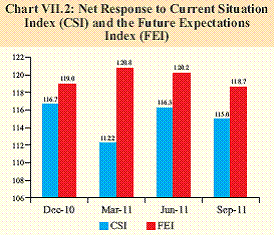
VII.15 Going forward, there are significant downside risks to growth during 2011-12. GDP data for Q1 2011-12 and various lead indicators are indicative of further moderation in growth. The buoyant export growth observed up to August 2011 may not hold out on account of the sluggish growth in the advanced economies and further deepening of global uncertainties mainly because of euro area crisis, downward revision of US’s credit rating by S&P and lowered debt ratings for several banks. Furthermore, domestic industry is exhibiting signs of slowdown on account of the lagged effects of past monetary policy actions. Risks to growth also emerge from the worsening global environment, volatility in international crude oil prices and high inflation. Survey of Professional Forecasters 1 suggest lower growth, higher inflation VII.16 In the 17th round of 'Survey of Professional Forecasters' (/en/web/rbi/-/publications/major-highlights-of-results-of-17th-round-q2-2011-12-of-survey-of-professional-forecasters-on-macroeconomic-indicators-14021), conducted by the Reserve Bank, growth forecasts for 2011-12 have been slightly revised downward as compare to previous survey (Table VII.4). At sectoral level growth forecasts are revised downward for 'agriculture and allied activities' and industry, whereas that for services has been revised upward marginally. Annual average inflation forecast for the year 2011-12 is revised marginally upward as compared to previous survey round, though it is expected to decline gradually over the quarters. The survey results are in consonance with the view that inflation may moderate slowly. Inflation Expectation Survey indicates higher perceived and expected inflation VII.17 The latest round of Inflation Expectation Survey of Households (/en/web/rbi/-/publications/inflation-expectations-survey-of-households-september-2011-round-25-*-14030) conducted in July- September 2011, exhibits marginal increase in both perceived and expected inflation. Households anticipate higher inflation in current and next one quarter. The survey was conducted by the Reserve Bank and covered 4000 household from seven different occupational classes. Consumer Confidence Survey indicates decline in index but remain positive VII.18 The 6th round Consumer Confidence Survey (/en/web/rbi/-/publications/consumer-confidence-survey-september-2011*-14028), conducted by the Reserve Bank in September 2011, indicates decline in positive perceptions of the household. Though the net response for one year outlook has declined as compared to the last three quarters yet optimism regarding improvement in future income remains. The overall ‘future expectation index’ is marginally down as inflation continues to have a pull down effect on the consumer confidence (Chart VII.2). Inflation challenges and risks to growth to set policy responses VII.19 While persistent high inflation is impacting growth, investment is slowing. This will have an adverse impact on potential growth. The investment cycle appears to be turning for the first time after 2003-04. The May issue of this report had stated that investment had entered into a soft patch. The soft patch has now extended beyond what was anticipated as in addition to the impact of monetary tightening, other factors have impacted business sentiments. First, with signs of global and domestic economy slowing down, firms are reluctant to expand capacities. Second, the impact of perceived governance issues have lingered, even though significant steps have been taken towards expediting road-project tendering and towards improving coal supplies for power projects. Third, business confidence has weakened due to wealth effects of the correction in equity prices. Fourth, along with the correction in the equity markets, the embedded valuations for planned investment have turned lower than the irrational pricing seen in the past. This has also contributed to new corporate fixed investment falling.
VII.20 The fall in new investment since the second half of 2010-11 has been significant and can impact the pipeline investment in coming years. Consumer demand is still robust, but some impact is likely ahead as a result of higher interest rates and changing business conditions. External demand is also expected to fall ahead if global slowdown persists. Even as growth moderates, inflation risks still prevail. Inflation remains a concern and will continue to occupy an important space in monetary policy setting. Monetary policy trajectory will need to be guided by the emerging growth-inflation dynamics, factoring in the transmission of past actions, that is still unfolding. 1 The forecast reflects the views of professional forecasters and not of the Reserve Bank. |
|||||||||||||||||||||||||||||||||||||||||||||||||||||||||||||||||||||||||||||||||||||||||||||||||||||||||||||||||||||||||||||||||||||||||||||||||||||||||||||||||||||||||||||||||||||||||||||||||||||||||||||||||||||||||||||||||||||||||||||||||||||||||||||||||||||||||||||||||||||||||||||||||||||||||||||||||||||||
Page Last Updated on:


