|
Today, the Reserve Bank released the results of 45th round of its quarterly Services and Infrastructure Outlook Survey (SIOS) conducted during Q1:2025-26. This forward-looking survey1 captures qualitative assessment and expectations of Indian companies engaged in the services and infrastructure sectors on a set of business parameters relating to demand conditions, price situation and other business conditions. In the latest round of the survey2 , 693 companies provided their assessment for Q1:2025-26 and expectations for Q2:2025-26 as well as outlook on key parameters for the subsequent two quarters.
Highlights:
A. Services Sector
Assessment for Q1:2025-26
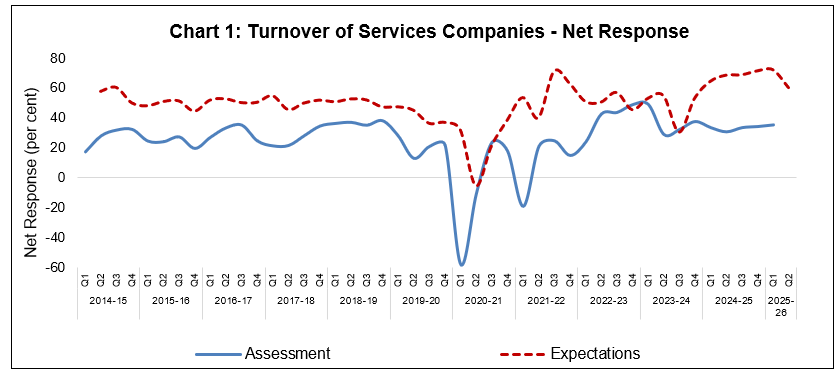
- Services sector enterprises assessed improvement in the overall business situation, employment conditions and their turnover during Q1:2025-26 (Chart 1 and Table A).
- Responding firms reported easing of pressures from input and finance costs, while pressures stemming from salary outgo increased.
- Services firms’ assessment on profit margin improved, supported by improvement in turnover and selling prices.
Expectations for Q2:2025-26
- Services firms maintained their positive outlook on demand conditions in Q2:2025-26, though their level of optimism recorded some moderation vis-à-vis the previous quarter (Chart 1 and Table A).
- Pressures from wage bill, input cost and finance cost are likely to ease moderately.
- Firms expressed lower optimism regarding selling prices and profit margins.
Expectations for Q3:2025-26 and Q4:2025-26
- Services sector firms remain optimistic on overall business situation, turnover and employment till Q4:2025-26 (Table C).
- Input cost pressures are likely to persist in H2:2025-26.
- Responding services firms reported that with their existing resources they could provide 11.2 per cent additional services during Q4:2024-25 (Table S14).
B. Infrastructure Sector
Assessment for Q1:2025-26
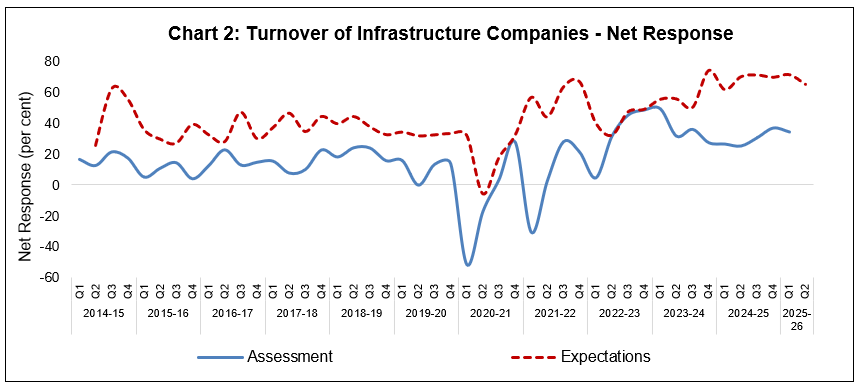
- Infrastructure companies remained positive on overall business situation, employment as well as their turnover during Q1:2025-26 (Chart 2 and Table B).
- Respondents assessed easing of cost pressures; while sentiments on selling price growth and profit margin moderated.
Expectations for Q2:2025-26
- Infrastructure firms remain highly optimistic on overall business situation and turnover (Chart 2 and Table B).
- Cost pressures are likely to remain high, leading to tempered expectations for increase in selling prices and profit margins.
Expectations for Q3:2025-26 and Q4:2025-26
- Infrastructure firms expect sequential improvement in turnover and overall business situation during H2:2025-26 (Table D).
- Input cost pressures are likely to persist in near term; with concomitant rise in selling prices.
Summary of Net Responses3 on Survey Parameters
|
Table A: Services Sector
|
|
(per cent)
|
|
Parameters
|
Assessment period
|
Expectations period
|
|
Q4:2024-25*
|
Q1:2025-26
|
Q1:2025-26*
|
Q2:2025-26
|
|
Overall Business Situation
|
34.9
|
35.5
|
69.6
|
58.7
|
|
Turnover
|
34.3
|
35.4
|
72.3
|
60.3
|
|
Full-time Employees
|
20.4
|
21.5
|
53.9
|
40.4
|
|
Part-time Employees
|
15.8
|
16.1
|
56.5
|
39.8
|
|
Availability of Finance
|
19.7
|
23.1
|
57.0
|
44.4
|
|
Cost of Finance
|
-26.8
|
-23.9
|
-59.5
|
-39.7
|
|
Salary & Wages
|
-25.5
|
-38.8
|
-61.5
|
-42.7
|
|
Cost of Inputs
|
-36.7
|
-35.9
|
-69.2
|
-53.2
|
|
Selling Price
|
14.8
|
15.4
|
55.8
|
37.2
|
|
Profit Margin
|
7.6
|
8.1
|
49.3
|
34.6
|
|
Inventories
|
18.6
|
14.3
|
54.1
|
39.0
|
|
Technical/Service Capacity
|
17.1
|
19.7
|
62.7
|
45.7
|
|
Physical Investment
|
14.8
|
17.5
|
57.6
|
42.3
|
*: Based on the previous round’s response.
|
Table B: Infrastructure Sector
|
|
(per cent)
|
|
Parameters
|
Assessment period
|
Expectations period
|
|
Q4:2024-25*
|
Q1:2025-26
|
Q1:2025-26*
|
Q2:2025-26
|
|
Overall Business Situation
|
37.9
|
32.2
|
68.9
|
66.7
|
|
Turnover
|
37.0
|
34.5
|
71.2
|
65.0
|
|
Full-time Employees
|
23.4
|
16.0
|
59.9
|
54.8
|
|
Part-time Employees
|
28.5
|
13.8
|
59.7
|
64.1
|
|
Availability of Finance
|
27.5
|
13.4
|
69.8
|
61.7
|
|
Cost of Finance
|
-29.6
|
-15.8
|
-62.8
|
-56.1
|
|
Salary & Wages
|
-33.3
|
-25.0
|
-66.0
|
-61.7
|
|
Cost of Inputs
|
-47.7
|
-32.7
|
-71.1
|
-71.6
|
|
Selling Price
|
25.6
|
13.3
|
62.1
|
60.4
|
|
Profit Margin
|
16.3
|
6.9
|
57.9
|
51.3
|
|
Inventories
|
26.9
|
16.8
|
70.6
|
58.2
|
|
Technical/Service Capacity
|
32.2
|
14.6
|
72.6
|
70.9
|
|
Physical Investment
|
31.7
|
20.2
|
73.8
|
77.8
|
*: Based on the previous round’s response.
Expectations of Select Parameters for extended period – Net response (in per cent)
| Table C: Services Sector |
|
Parameter
|
Round 44
|
Round 45
|
|
Q1:2025-26
|
Q2:2025-26
|
Q3:2025-26
|
Q4:2025-26
|
|
Overall Business Situation
|
69.6
|
58.7
|
61.7
|
61.0
|
|
Turnover
|
72.3
|
60.3
|
63.0
|
63.0
|
|
Full-time Employees
|
53.9
|
40.4
|
41.3
|
40.3
|
|
Part-time Employees
|
56.5
|
39.8
|
40.7
|
39.8
|
|
Cost of Inputs
|
-69.2
|
-53.2
|
-51.4
|
-49.5
|
|
Selling Price
|
55.8
|
37.2
|
35.1
|
36.3
|
|
Table D: Infrastructure Sector
|
|
Parameter
|
Round 44
|
Round 45
|
|
Q1:2025-26
|
Q2:2025-26
|
Q3:2025-26
|
Q4:2025-26
|
|
Overall Business Situation
|
68.9
|
66.7
|
70.9
|
71.6
|
|
Turnover
|
71.2
|
65.0
|
69.5
|
74.4
|
|
Full-time Employees
|
59.9
|
54.8
|
56.9
|
56.0
|
|
Part-time Employees
|
59.7
|
64.1
|
64.5
|
64.5
|
|
Cost of Inputs
|
-71.1
|
-71.6
|
-67.6
|
-67.6
|
|
Selling Price
|
62.1
|
60.4
|
60.0
|
61.0
|
Note: Please see the excel file for time series data
Service Sector
|
Table S1: Assessment and Expectation for Overall Business Situation
|
| (Percentage responses)@ |
|
Quarter
|
Assessment
|
Expectation
|
|
Better
|
No Change
|
Worse
|
Net response#
|
Better
|
No Change
|
Worse
|
Net response
|
|
Q1:24-25
|
43.0
|
48.1
|
8.9
|
34.1
|
68.5
|
28.4
|
3.1
|
65.3
|
|
Q2:24-25
|
41.9
|
46.4
|
11.7
|
30.2
|
71.5
|
26.5
|
2.0
|
69.4
|
|
Q3:24-25
|
42.8
|
48.3
|
8.9
|
33.9
|
70.1
|
27.8
|
2.1
|
68.0
|
|
Q4:24-25
|
42.5
|
49.9
|
7.6
|
34.9
|
71.4
|
26.4
|
2.2
|
69.2
|
|
Q1:25-26
|
45.8
|
44.0
|
10.2
|
35.5
|
71.7
|
26.2
|
2.1
|
69.6
|
|
Q2:25-26
|
|
|
|
|
60.9
|
36.9
|
2.2
|
58.7
|
|
‘Increase’ in Overall business situation is optimistic.
|
|
@: Due to rounding off percentage may not add up to 100.
|
|
#: Net Response (NR) is the difference of percentage of the respondents reporting optimism and that reporting pessimism. The range is -100 to 100. Any value greater than zero indicates expansion/ optimism and any value less than zero indicates contraction/ pessimism.
|
|
Table S2: Assessment and Expectation for Turnover
|
| (Percentage responses) |
|
Quarter
|
Assessment
|
Expectation
|
|
Increase
|
No Change
|
Decrease
|
Net response
|
Increase
|
No Change
|
Decrease
|
Net response
|
|
Q1:24-25
|
45.2
|
43.1
|
11.7
|
33.5
|
70.5
|
23.6
|
5.9
|
64.6
|
|
Q2:24-25
|
43.6
|
43.5
|
12.9
|
30.7
|
71.9
|
24.8
|
3.3
|
68.7
|
|
Q3:24-25
|
44.8
|
44.0
|
11.2
|
33.5
|
71.9
|
25.2
|
3.0
|
68.9
|
|
Q4:24-25
|
44.9
|
44.4
|
10.7
|
34.3
|
74.1
|
23.3
|
2.6
|
71.6
|
|
Q1:25-26
|
46.8
|
41.8
|
11.4
|
35.4
|
74.8
|
22.7
|
2.5
|
72.3
|
|
Q2:25-26
|
|
|
|
|
64.0
|
32.4
|
3.7
|
60.3
|
|
‘Increase’ in Turnover is optimistic. Footnotes @ and # given in Table S1 are applicable here.
|
|
Table S3: Assessment and Expectation for Full-time Employees
|
| (Percentage responses) |
|
Quarter
|
Assessment
|
Expectation
|
|
Increase
|
No Change
|
Decrease
|
Net response
|
Increase
|
No Change
|
Decrease
|
Net response
|
|
Q1:24-25
|
34.8
|
58.2
|
7.0
|
27.8
|
48.4
|
49.5
|
2.1
|
46.3
|
|
Q2:24-25
|
29.0
|
62.0
|
9.0
|
20.1
|
52.2
|
46.0
|
1.7
|
50.5
|
|
Q3:24-25
|
34.5
|
58.7
|
6.8
|
27.8
|
45.8
|
52.4
|
1.8
|
44.0
|
|
Q4:24-25
|
28.4
|
63.7
|
7.9
|
20.4
|
54.3
|
44.0
|
1.7
|
52.6
|
|
Q1:25-26
|
30.5
|
60.6
|
9.0
|
21.5
|
55.1
|
43.8
|
1.1
|
53.9
|
|
Q2:25-26
|
|
|
|
|
41.9
|
56.7
|
1.5
|
40.4
|
|
‘Increase’ in Full-time Employees is optimistic. Footnotes @ and # given in Table S1 are applicable here.
|
|
Table S4: Assessment and Expectation for Part-time Employees
|
| (Percentage responses) |
|
Quarter
|
Assessment
|
Expectation
|
|
Increase
|
No Change
|
Decrease
|
Net response
|
Increase
|
No Change
|
Decrease
|
Net response
|
|
Q1:24-25
|
28.9
|
65.0
|
6.1
|
22.7
|
50.8
|
46.7
|
2.5
|
48.3
|
|
Q2:24-25
|
22.2
|
69.6
|
8.3
|
13.9
|
55.4
|
42.1
|
2.5
|
52.9
|
|
Q3:24-25
|
29.7
|
64.4
|
5.9
|
23.8
|
54.1
|
43.8
|
2.1
|
52.1
|
|
Q4:24-25
|
22.5
|
70.7
|
6.8
|
15.8
|
59.0
|
38.9
|
2.2
|
56.8
|
|
Q1:25-26
|
23.4
|
69.3
|
7.3
|
16.1
|
58.0
|
40.6
|
1.5
|
56.5
|
|
Q2:25-26
|
|
|
|
|
41.9
|
56.1
|
2.1
|
39.8
|
|
‘Increase’ in Part-time Employees is optimistic. Footnotes @ and # given in Table S1 are applicable here.
|
|
Table S5: Assessment and Expectation for Availability of Finance
|
| (Percentage responses) |
|
Quarter
|
Assessment
|
Expectation
|
|
Improve
|
No Change
|
Worsen
|
Net response
|
Improve
|
No Change
|
Worsen
|
Net response
|
|
Q1:24-25
|
37.9
|
56.2
|
5.9
|
32.0
|
56.4
|
42.5
|
1.1
|
55.3
|
|
Q2:24-25
|
28.5
|
62.8
|
8.7
|
19.8
|
58.8
|
40.0
|
1.2
|
57.6
|
|
Q3:24-25
|
34.7
|
58.9
|
6.4
|
28.3
|
51.4
|
47.2
|
1.4
|
50.1
|
|
Q4:24-25
|
27.9
|
63.9
|
8.2
|
19.7
|
58.0
|
40.6
|
1.4
|
56.6
|
|
Q1:25-26
|
30.1
|
62.8
|
7.0
|
23.1
|
58.4
|
40.2
|
1.4
|
57.0
|
|
Q2:25-26
|
|
|
|
|
46.1
|
52.2
|
1.7
|
44.4
|
|
‘Improve’ in Availability of Finance is optimistic. Footnotes @ and # given in Table S1 are applicable here.
|
|
Table S6: Assessment and Expectation for Cost of Finance
|
| (Percentage responses) |
|
Quarter
|
Assessment
|
Expectation
|
|
Increase
|
No Change
|
Decrease
|
Net response
|
Increase
|
No Change
|
Decrease
|
Net response
|
|
Q1:24-25
|
40.0
|
55.1
|
4.9
|
-35.1
|
51.0
|
43.5
|
5.5
|
-45.5
|
|
Q2:24-25
|
36.6
|
59.0
|
4.3
|
-32.3
|
59.4
|
38.0
|
2.6
|
-56.9
|
|
Q3:24-25
|
38.9
|
57.7
|
3.4
|
-35.4
|
55.9
|
42.5
|
1.6
|
-54.3
|
|
Q4:24-25
|
33.7
|
59.3
|
6.9
|
-26.8
|
61.1
|
37.0
|
1.9
|
-59.2
|
|
Q1:25-26
|
32.3
|
59.4
|
8.3
|
-23.9
|
61.5
|
36.4
|
2.0
|
-59.5
|
|
Q2:25-26
|
|
|
|
|
44.1
|
51.4
|
4.4
|
-39.7
|
|
‘Decrease’ in Cost of Finance is optimistic. Footnotes @ and # given in Table S1 are applicable here.
|
|
Table S7: Assessment and Expectation for Salary/Wages
|
| (Percentage responses) |
|
Quarter
|
Assessment
|
Expectation
|
|
Increase
|
No Change
|
Decrease
|
Net response
|
Increase
|
No Change
|
Decrease
|
Net response
|
|
Q1:24-25
|
45.3
|
52.0
|
2.7
|
-42.6
|
46.7
|
53.3
|
0.0
|
-46.7
|
|
Q2:24-25
|
29.9
|
66.0
|
4.1
|
-25.8
|
54.5
|
44.9
|
0.7
|
-53.8
|
|
Q3:24-25
|
33.5
|
63.5
|
3.0
|
-30.4
|
45.0
|
54.5
|
0.5
|
-44.5
|
|
Q4:24-25
|
29.5
|
66.4
|
4.0
|
-25.5
|
55.7
|
43.7
|
0.6
|
-55.1
|
|
Q1:25-26
|
42.2
|
54.4
|
3.4
|
-38.8
|
61.9
|
37.7
|
0.4
|
-61.5
|
|
Q2:25-26
|
|
|
|
|
43.6
|
55.5
|
0.9
|
-42.7
|
|
‘Decrease’ in Salary/Wages is optimistic. Footnotes @ and # given in Table S1 are applicable here.
|
|
Table S8: Assessment and Expectation for Cost of Inputs
|
| (Percentage responses) |
|
Quarter
|
Assessment
|
Expectation
|
|
Increase
|
No Change
|
Decrease
|
Net response
|
Increase
|
No Change
|
Decrease
|
Net response
|
|
Q1:24-25
|
47.5
|
49.6
|
2.9
|
-44.7
|
57.1
|
42.5
|
0.4
|
-56.7
|
|
Q2:24-25
|
44.4
|
51.8
|
3.8
|
-40.6
|
66.5
|
32.9
|
0.6
|
-65.9
|
|
Q3:24-25
|
46.2
|
50.4
|
3.4
|
-42.7
|
65.6
|
33.1
|
1.3
|
-64.2
|
|
Q4:24-25
|
41.2
|
54.2
|
4.5
|
-36.7
|
69.4
|
30.1
|
0.5
|
-68.9
|
|
Q1:25-26
|
41.4
|
53.1
|
5.5
|
-35.9
|
70.1
|
29.0
|
0.9
|
-69.2
|
|
Q2:25-26
|
|
|
|
|
54.3
|
44.7
|
1.0
|
-53.2
|
|
‘Decrease’ in Cost of Inputs is optimistic. Footnotes @ and # given in Table S1 are applicable here.
|
|
Table S9: Assessment and Expectation for Selling Price)
|
| (Percentage responses) |
|
Quarter
|
Assessment
|
Expectation
|
|
Increase
|
No Change
|
Decrease
|
Net response
|
Increase
|
No Change
|
Decrease
|
Net response
|
|
Q1:24-25
|
26.9
|
67.9
|
5.2
|
21.7
|
52.4
|
46.0
|
1.6
|
50.8
|
|
Q2:24-25
|
20.5
|
71.1
|
8.4
|
12.1
|
55.5
|
43.2
|
1.4
|
54.1
|
|
Q3:24-25
|
29.0
|
64.1
|
6.9
|
22.2
|
50.4
|
47.3
|
2.3
|
48.0
|
|
Q4:24-25
|
21.2
|
72.4
|
6.4
|
14.8
|
57.9
|
39.8
|
2.3
|
55.6
|
|
Q1:25-26
|
22.9
|
69.6
|
7.5
|
15.4
|
57.4
|
41.1
|
1.6
|
55.8
|
|
Q2:25-26
|
|
|
|
|
39.4
|
58.4
|
2.2
|
37.2
|
|
‘Increase’ in Selling Price is optimistic. Footnotes @ and # given in Table S1 are applicable here.
|
|
Table S10: Assessment and Expectation for Profit Margin
|
| (Percentage responses) |
|
Quarter
|
Assessment
|
Expectation
|
|
Increase
|
No Change
|
Decrease
|
Net response
|
Increase
|
No Change
|
Decrease
|
Net response
|
|
Q1:24-25
|
26.5
|
57.5
|
16.0
|
10.5
|
50.6
|
45.1
|
4.2
|
46.4
|
|
Q2:24-25
|
21.0
|
62.1
|
16.8
|
4.2
|
49.6
|
46.3
|
4.2
|
45.4
|
|
Q3:24-25
|
28.4
|
58.2
|
13.4
|
15.0
|
42.3
|
53.7
|
3.9
|
38.4
|
|
Q4:24-25
|
21.2
|
65.1
|
13.6
|
7.6
|
52.6
|
43.7
|
3.7
|
48.9
|
|
Q1:25-26
|
24.4
|
59.3
|
16.3
|
8.1
|
53.0
|
43.3
|
3.7
|
49.3
|
|
Q2:25-26
|
|
|
|
|
39.2
|
56.1
|
4.6
|
34.6
|
|
‘Increase’ in Profit Margin is optimistic. Footnotes @ and # given in Table S1 are applicable here.
|
|
Table S11: Assessment and Expectation for Inventories
|
| (Percentage responses) |
|
Quarter
|
Assessment
|
Expectation
|
|
Increase
|
No Change
|
Decrease
|
Net response
|
Increase
|
No Change
|
Decrease
|
Net response
|
|
Q1:24-25
|
31.2
|
62.0
|
6.9
|
24.3
|
50.9
|
45.9
|
3.2
|
47.8
|
|
Q2:24-25
|
24.5
|
69.4
|
6.1
|
18.4
|
54.3
|
43.4
|
2.3
|
52.0
|
|
Q3:24-25
|
29.8
|
64.6
|
5.5
|
24.3
|
47.7
|
51.3
|
1.1
|
46.6
|
|
Q4:24-25
|
26.5
|
65.6
|
7.9
|
18.6
|
55.0
|
43.6
|
1.4
|
53.6
|
|
Q1:25-26
|
22.8
|
68.6
|
8.6
|
14.3
|
56.1
|
41.9
|
2.0
|
54.1
|
|
Q2:25-26
|
|
|
|
|
41.9
|
55.3
|
2.9
|
39.0
|
|
‘Increase’ in Inventories is optimistic. Footnotes @ and # given in Table S1 are applicable here.
|
|
Table S12: Assessment and Expectation for Technical/Service Capacity
|
| (Percentage responses) |
|
Quarter
|
Assessment
|
Expectation
|
|
Increase
|
No Change
|
Decrease
|
Net response
|
Increase
|
No Change
|
Decrease
|
Net response
|
|
Q1:24-25
|
29.4
|
67.4
|
3.2
|
26.2
|
54.7
|
45.3
|
0.0
|
54.7
|
|
Q2:24-25
|
23.0
|
72.5
|
4.5
|
18.5
|
57.2
|
42.5
|
0.2
|
57.0
|
|
Q3:24-25
|
32.4
|
64.2
|
3.4
|
29.0
|
58.6
|
41.1
|
0.3
|
58.3
|
|
Q4:24-25
|
22.0
|
73.2
|
4.8
|
17.1
|
64.3
|
35.0
|
0.7
|
63.6
|
|
Q1:25-26
|
23.3
|
73.0
|
3.7
|
19.7
|
62.7
|
37.3
|
0.0
|
62.7
|
|
Q2:25-26
|
|
|
|
|
46.0
|
53.7
|
0.3
|
45.7
|
|
‘Increase’ in Technical/Service Capacity is optimistic. Footnotes @ and # given in Table S1 are applicable here.
|
|
Table S13: Assessment and Expectation for Physical Investment
|
| (Percentage responses) |
|
Quarter
|
Assessment
|
Expectation
|
|
Increase
|
No Change
|
Decrease
|
Net response
|
Increase
|
No Change
|
Decrease
|
Net response
|
|
Q1:24-25
|
27.4
|
69.3
|
3.2
|
24.2
|
53.8
|
45.7
|
0.5
|
53.2
|
|
Q2:24-25
|
21.6
|
72.9
|
5.5
|
16.1
|
55.7
|
44.1
|
0.3
|
55.4
|
|
Q3:24-25
|
30.2
|
66.4
|
3.4
|
26.8
|
57.0
|
42.7
|
0.3
|
56.7
|
|
Q4:24-25
|
20.2
|
74.4
|
5.4
|
14.8
|
61.5
|
37.7
|
0.9
|
60.6
|
|
Q1:25-26
|
20.8
|
75.8
|
3.4
|
17.5
|
58.0
|
41.6
|
0.4
|
57.6
|
|
Q2:25-26
|
|
|
|
|
43.1
|
56.0
|
0.9
|
42.3
|
|
‘Increase’ in Physical Investment is optimistic. Footnotes @ and # given in Table S1 are applicable here.
|
| Table S14: Estimated Spare Capacity for the Services Sector |
|
Survey conducted during
|
Reference quarter
|
Response rate for the
question on Spare Capacity
(per cent)
|
Spare Capacity
(per cent)
|
|
Q4:2022-23
|
Q3:2022-23
|
63.0
|
13.8
|
|
Q1:2023-24
|
Q4:2022-23
|
79.8
|
13.6
|
|
Q2:2023-24
|
Q1:2023-24
|
84.3
|
12.3
|
|
Q3:2023-24
|
Q2:2023-24
|
74.0
|
11.8
|
|
Q4:2023-24
|
Q3:2023-24
|
74.8
|
11.7
|
|
Q1:2024-25
|
Q4:2023-24
|
78.8
|
11.3
|
|
Q2:2024-25
|
Q1:2024-25
|
71.5
|
11.2
|
|
Q3:2024-25
|
Q2:2024-25
|
79.9
|
10.6
|
|
Q4:2024-25
|
Q3:2024-25
|
83.7
|
10.9
|
|
Q1:2025-26
|
Q4:2024-25
|
65.7
|
11.2
|
Infrastructure Sector
| Table I1: Assessment and Expectation for Overall Business Situation |
| (Percentage responses)@ |
| Quarter |
Assessment |
Expectation |
| Better |
No Change |
Worse |
Net response# |
Better |
No Change |
Worse |
Net response |
| Q1:24-25 |
37.7 |
51.3 |
11 |
26.6 |
70.3 |
25.4 |
4.2 |
66.1 |
| Q2:24-25 |
38.4 |
44.9 |
16.7 |
21.7 |
76.5 |
21.6 |
2 |
74.5 |
| Q3:24-25 |
40.2 |
47.2 |
12.6 |
27.6 |
70.3 |
26.8 |
2.9 |
67.4 |
| Q4:24-25 |
44.4 |
49 |
6.5 |
37.9 |
70.9 |
25.2 |
3.9 |
66.9 |
| Q1:25-26 |
41.3 |
49.6 |
9.1 |
32.2 |
72.2 |
24.5 |
3.3 |
68.9 |
| Q2:25-26 |
|
|
|
|
69.2 |
28.2 |
2.6 |
66.7 |
‘Increase’ in Overall business situation is optimistic.
@: Due to rounding off percentage may not add up to 100.
#: Net Response (NR) is the difference of percentage of the respondents reporting optimism and that reporting pessimism. The range is -100 to 100. Any value greater than zero indicates expansion/ optimism and any value less than zero indicates contraction/ pessimism. |
| Table I2: Assessment and Expectation for Turnover |
| (Percentage responses) |
| Quarter |
Assessment |
Expectation |
| Increase |
No Change |
Decrease |
Net response |
Increase |
No Change |
Decrease |
Net response |
| Q1:24-25 |
37.7 |
51.3 |
11 |
26.6 |
68.4 |
24.8 |
6.8 |
61.5 |
| Q2:24-25 |
41.3 |
42.8 |
15.9 |
25.4 |
73.2 |
23.5 |
3.3 |
69.9 |
| Q3:24-25 |
44.1 |
42.5 |
13.4 |
30.7 |
73.2 |
24.6 |
2.2 |
71 |
| Q4:24-25 |
45.5 |
46.1 |
8.4 |
37 |
72.7 |
24.2 |
3.1 |
69.5 |
| Q1:25-26 |
46.2 |
42 |
11.8 |
34.5 |
75.2 |
20.9 |
3.9 |
71.2 |
| Q2:25-26 |
|
|
|
|
69.2 |
26.5 |
4.3 |
65 |
| ‘Increase’ in Turnover is optimistic. Footnotes @ and # given in Table I1 are applicable here. |
| Table I3: Assessment and Expectation for Full-time Employees |
| (Percentage responses) |
| Quarter |
Assessment |
Expectation |
| Increase |
No Change |
Decrease |
Net response |
Increase |
No Change |
Decrease |
Net response |
| Q1:24-25 |
31.2 |
59.1 |
9.7 |
21.4 |
47.5 |
51.7 |
0.8 |
46.6 |
| Q2:24-25 |
28.3 |
61.6 |
10.1 |
18.1 |
64.7 |
33.3 |
2 |
62.7 |
| Q3:24-25 |
30.7 |
60.6 |
8.7 |
22 |
41.5 |
56.3 |
2.2 |
39.3 |
| Q4:24-25 |
29.9 |
63.6 |
6.5 |
23.4 |
48.4 |
48.4 |
3.1 |
45.3 |
| Q1:25-26 |
22.7 |
70.6 |
6.7 |
16 |
61.2 |
37.5 |
1.3 |
59.9 |
| Q2:25-26 |
|
|
|
|
56.5 |
41.7 |
1.7 |
54.8 |
| ‘Increase’ in Full-time Employees is optimistic. Footnotes @ and # given in Table I1 are applicable here. |
| Table I4: Assessment and Expectation for Part-time Employees |
| (Percentage responses) |
| Quarter |
Assessment |
Expectation |
| Increase |
No Change |
Decrease |
Net response |
Increase |
No Change |
Decrease |
Net response |
| Q1:24-25 |
32.8 |
59.9 |
7.3 |
25.5 |
55.8 |
41.9 |
2.3 |
53.5 |
| Q2:24-25 |
21.5 |
66.7 |
11.8 |
9.7 |
63.7 |
33.3 |
3 |
60.7 |
| Q3:24-25 |
30.3 |
61.6 |
8.1 |
22.2 |
54.3 |
40.2 |
5.4 |
48.9 |
| Q4:24-25 |
31.5 |
65.4 |
3.1 |
28.5 |
62 |
34 |
4 |
58 |
| Q1:25-26 |
19.1 |
75.5 |
5.3 |
13.8 |
62.8 |
34.1 |
3.1 |
59.7 |
| Q2:25-26 |
|
|
|
|
66.3 |
31.5 |
2.2 |
64.1 |
| ‘Increase’ in Part-time Employees is optimistic. Footnotes @ and # given in Table I1 are applicable here. |
| Table I5: Assessment and Expectation for Availability of Finance |
| (Percentage responses) |
| Quarter |
Assessment |
Expectation |
| Improve |
No Change |
Worsen |
Net response |
Improve |
No Change |
Worsen |
Net response |
| Q1:24-25 |
35.1 |
59.1 |
5.8 |
29.2 |
58.6 |
40.5 |
0.9 |
57.8 |
| Q2:24-25 |
31.4 |
55.5 |
13.1 |
18.2 |
68 |
32 |
0 |
68 |
| Q3:24-25 |
34.1 |
57.9 |
7.9 |
26.2 |
55.1 |
44.1 |
0.7 |
54.4 |
| Q4:24-25 |
34 |
59.5 |
6.5 |
27.5 |
60.8 |
37.6 |
1.6 |
59.2 |
| Q1:25-26 |
22.7 |
68.1 |
9.2 |
13.4 |
71.8 |
26.2 |
2 |
69.8 |
| Q2:25-26 |
|
|
|
|
63.5 |
34.8 |
1.7 |
61.7 |
| ‘Improve’ in Availability of Finance is optimistic. Footnotes @ and # given in Table I1 are applicable here. |
| Table I6: Assessment and Expectation for Cost of Finance |
| (Percentage responses) |
| Quarter |
Assessment |
Expectation |
| Increase |
No Change |
Decrease |
Net response |
Increase |
No Change |
Decrease |
Net response |
| Q1:24-25 |
36.4 |
56.3 |
7.3 |
-29.1 |
60.4 |
38.7 |
0.9 |
-59.4 |
| Q2:24-25 |
38.3 |
50 |
11.7 |
-26.6 |
65.1 |
32.2 |
2.7 |
-62.4 |
| Q3:24-25 |
37.3 |
52.4 |
10.3 |
-27 |
63.5 |
33.3 |
3.2 |
-60.3 |
| Q4:24-25 |
40.1 |
49.3 |
10.5 |
-29.6 |
60.7 |
36.9 |
2.5 |
-58.2 |
| Q1:25-26 |
25 |
65.8 |
9.2 |
-15.8 |
68.2 |
26.4 |
5.4 |
-62.8 |
| Q2:25-26 |
|
|
|
|
60.5 |
35.1 |
4.4 |
-56.1 |
| ‘Decrease’ in Cost of Finance is optimistic. Footnotes @ and # given in Table I1 are applicable here. |
| Table I7: Assessment and Expectation for Salary/Wages |
| (Percentage responses) |
| Quarter |
Assessment |
Expectation |
| Increase |
No Change |
Decrease |
Net response |
Increase |
No
Change |
Decrease |
Net response |
| Q1:24-25 |
38.3 |
57.8 |
3.9 |
-34.4 |
55.2 |
44.8 |
0 |
-55.2 |
| Q2:24-25 |
31.9 |
63 |
5.1 |
-26.8 |
70.6 |
29.4 |
0 |
-70.6 |
| Q3:24-25 |
34.9 |
61.1 |
4 |
-31 |
43.1 |
56.9 |
0 |
-43.1 |
| Q4:24-25 |
35.9 |
61.4 |
2.6 |
-33.3 |
47.6 |
52.4 |
0 |
-47.6 |
| Q1:25-26 |
30 |
65 |
5 |
-25 |
66.7 |
32.7 |
0.7 |
-66 |
| Q2:25-26 |
|
|
|
|
63.5 |
34.8 |
1.7 |
-61.7 |
| ‘Decrease’ in Salary/Wages is optimistic. Footnotes @ and # given in Table I1 are applicable here. |
| Table I8: Assessment and Expectation for Cost of Inputs |
| (Percentage responses) |
| Quarter |
Assessment |
Expectation |
| Increase |
No Change |
Decrease |
Net response |
Increase |
No Change |
Decrease |
Net response |
| Q1:24-25 |
42.2 |
51.7 |
6.1 |
-36.1 |
63.4 |
36.6 |
0 |
-63.4 |
| Q2:24-25 |
49.2 |
42.3 |
8.5 |
-40.8 |
75.9 |
23.4 |
0.7 |
-75.2 |
| Q3:24-25 |
48 |
45.6 |
6.4 |
-41.6 |
70.8 |
29.2 |
0 |
-70.8 |
| Q4:24-25 |
52.3 |
43 |
4.6 |
-47.7 |
70.4 |
29.6 |
0 |
-70.4 |
| Q1:25-26 |
39.8 |
53.1 |
7.1 |
-32.7 |
74.3 |
22.4 |
3.3 |
-71.1 |
| Q2:25-26 |
|
|
|
|
74.3 |
22.9 |
2.8 |
-71.6 |
| ‘Decrease’ in Cost of Inputs is optimistic. Footnotes @ and # given in Table I1 are applicable here. |
| Table I9: Assessment and Expectation for Selling Price |
| (Percentage responses) |
| Quarter |
Assessment |
Expectation |
| Increase |
No Change |
Decrease |
Net response |
Increase |
No Change |
Decrease |
Net response |
| Q1:24-25 |
30.8 |
60 |
9.2 |
21.5 |
60.7 |
33.7 |
5.6 |
55.1 |
| Q2:24-25 |
24.5 |
61.8 |
13.6 |
10.9 |
69.8 |
27.1 |
3.1 |
66.7 |
| Q3:24-25 |
27 |
63.1 |
9.9 |
17.1 |
52.7 |
44.5 |
2.7 |
50 |
| Q4:24-25 |
30.1 |
65.4 |
4.5 |
25.6 |
56.4 |
43.6 |
0 |
56.4 |
| Q1:25-26 |
22.9 |
67.6 |
9.5 |
13.3 |
62.9 |
36.4 |
0.8 |
62.1 |
| Q2:25-26 |
|
|
|
|
63.4 |
33.7 |
3 |
60.4 |
| ‘Increase’ in Selling Price is optimistic. Footnotes @ and # given in Table I1 are applicable here. |
| Table I10: Assessment and Expectation for Profit Margin |
| (Percentage responses) |
| Quarter |
Assessment |
Expectation |
| Increase |
No Change |
Decrease |
Net response |
Increase |
No Change |
Decrease |
Net response |
| Q1:24-25 |
28.6 |
59.7 |
11.7 |
16.9 |
54.7 |
38.5 |
6.8 |
47.9 |
| Q2:24-25 |
26.8 |
52.2 |
21 |
5.8 |
65.1 |
31.6 |
3.3 |
61.8 |
| Q3:24-25 |
28 |
55.2 |
16.8 |
11.2 |
45.7 |
49.3 |
5.1 |
40.6 |
| Q4:24-25 |
27.5 |
61.4 |
11.1 |
16.3 |
55.2 |
40 |
4.8 |
50.4 |
| Q1:25-26 |
23.3 |
60.3 |
16.4 |
6.9 |
61.8 |
34.2 |
3.9 |
57.9 |
| Q2:25-26 |
|
|
|
|
55.7 |
40 |
4.3 |
51.3 |
| ‘Increase’ in Profit Margin is optimistic. Footnotes @ and # given in Table I1 are applicable here. |
| Table I11: Assessment and Expectation for Inventories |
| (Percentage responses) |
| Quarter |
Assessment |
Expectation |
| Increase |
No Change |
Decrease |
Net response |
Increase |
No Change |
Decrease |
Net response |
| Q1:24-25 |
34.8 |
59.4 |
5.8 |
29 |
58 |
39 |
3 |
55 |
| Q2:24-25 |
30.4 |
59.8 |
9.8 |
20.5 |
71.5 |
27 |
1.5 |
70.1 |
| Q3:24-25 |
35.6 |
56.8 |
7.6 |
28 |
59.1 |
38.2 |
2.7 |
56.4 |
| Q4:24-25 |
37.2 |
52.4 |
10.3 |
26.9 |
62.4 |
35.9 |
1.7 |
60.7 |
| Q1:25-26 |
24.8 |
67.3 |
8 |
16.8 |
74.1 |
22.4 |
3.5 |
70.6 |
| Q2:25-26 |
|
|
|
|
62.7 |
32.7 |
4.5 |
58.2 |
| ‘Increase’ in Inventories is optimistic. Footnotes @ and # given in Table I1 are applicable here. |
| Table I12: Assessment and Expectation for Technical/Service Capacity |
| (Percentage responses) |
| Quarter |
Assessment |
Expectation |
| Increase |
No Change |
Decrease |
Net response |
Increase |
No Change |
Decrease |
Net response |
| Q1:24-25 |
36.2 |
59.5 |
4.3 |
31.9 |
66.2 |
32.4 |
1.4 |
64.9 |
| Q2:24-25 |
30.9 |
57.4 |
11.8 |
19.1 |
79.1 |
20.9 |
0 |
79.1 |
| Q3:24-25 |
32.9 |
62 |
5.1 |
27.8 |
72.5 |
27.5 |
0 |
72.5 |
| Q4:24-25 |
34.8 |
62.6 |
2.6 |
32.2 |
68.8 |
30 |
1.3 |
67.5 |
| Q1:25-26 |
20.7 |
73.2 |
6.1 |
14.6 |
72.6 |
27.4 |
0 |
72.6 |
| Q2:25-26 |
|
|
|
|
72.2 |
26.6 |
1.3 |
70.9 |
| ‘Increase’ in Technical/Service Capacity is optimistic. Footnotes @ and # given in Table I1 are applicable here. |
| Table I13: Assessment and Expectation for Physical Investment |
| (Percentage responses) |
| Quarter |
Assessment |
Expectation |
| Increase |
No Change |
Decrease |
Net response |
Increase |
No Change |
Decrease |
Net response |
| Q1:24-25 |
33.1 |
61.2 |
5.8 |
27.3 |
64 |
36 |
0 |
64 |
| Q2:24-25 |
36.5 |
52.7 |
10.8 |
25.7 |
75.8 |
24.2 |
0 |
75.8 |
| Q3:24-25 |
32.6 |
61.6 |
5.8 |
26.7 |
75.3 |
24.7 |
0 |
75.3 |
| Q4:24-25 |
34.1 |
63.4 |
2.4 |
31.7 |
71.1 |
28.9 |
0 |
71.1 |
| Q1:25-26 |
25 |
70.2 |
4.8 |
20.2 |
73.8 |
26.2 |
0 |
73.8 |
| Q2:25-26 |
|
|
|
|
77.8 |
22.2 |
0 |
77.8 |
| ‘Increase’ in Physical Investment is optimistic. Footnotes @ and # given in Table I1 are applicable here. |
[1] The survey results reflect the respondents’ views, which are not necessarily shared by the Reserve Bank.
[2] Results of the previous survey round were released on the Bank’s website on April 09, 2025.
[3]Net Response (NR) is the difference between the percentage of respondents reporting optimism and those reporting pessimism. It ranges between -100 to 100. Positive value indicates expansion/optimism and negative value indicates contraction/pessimism. In other words, NR = (I – D); where, I is the percentage response of ‘Increase/optimism’, D is the percentage response of ‘Decrease/pessimism’ and E is the percentage response as ‘no change/ equal’ (i.e., I+D+E=100). For example, increase in turnover is optimism whereas decrease in cost of inputs is optimism.
|
 IST,
IST,