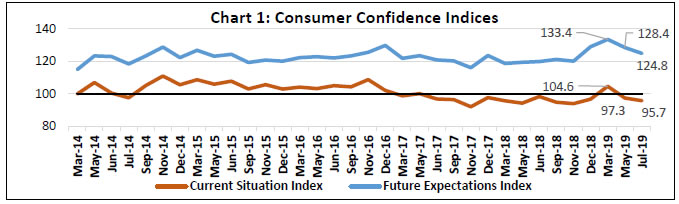
Today, the Reserve Bank released the results of the July 2019 round of its Consumer Confidence Survey (CCS)1. The survey was conducted in 13 major cities – Ahmedabad; Bengaluru; Bhopal; Chennai; Delhi; Guwahati; Hyderabad; Jaipur; Kolkata; Lucknow; Mumbai; Patna; and Thiruvananthapuram - and obtained 5,351 responses on households’ perceptions and expectations on the general economic situation, the employment scenario, the overall price situation and their own income and spending.
Highlights:
I. Consumer confidence declined in July as reflected in the current situation index (CSI)2; the future expectations index (FEI) fell by about 4 points (Chart 1).
II. Consumers’ perceptions on the general economic situation (Table 1) and the employment scenario (Table 2) softened, while their assessment of their own incomes (Table 5) turned out to be less optimistic than in May 2019.
III. Respondents perceived a rise in the price level and the majority expect prices to rise over the year ahead (Tables 3 and 4); this boosted sentiments on overall spending, but they were less optimistic about discretionary spending (Tables 6, 7 and 8).
Table 1: Perceptions and Expectations on the General Economic Situation
(Percentage responses)
Survey Round
Current Perception
One year ahead Expectation
Improved
Remained Same
Worsened
Net Response
Will Improve
Will Remain Same
Will Worsen
Net Response
Jun-18
36.4
21.9
41.8
-5.4
50.4
23.0
26.6
23.8
Sep-18
33.7
22.1
44.3
-10.6
53.2
16.7
30.2
23.0
Nov-18
33.2
21.6
45.2
-12.0
53.6
15.3
31.2
22.4
Dec-18
36.7
20.2
43.1
-6.4
59.9
15.8
24.3
35.6
Mar-19
46.2
21.3
32.5
13.7
66.4
15.8
17.8
48.6
May-19
38.8
23.6
37.7
1.1
61.4
17.7
20.9
40.5
Jul-19
37.4
24.2
38.4
-1.0
59.4
16.0
24.6
34.8
Table 2: Perceptions and Expectations on Employment
(Percentage responses)
Survey Round
Current Perception
One year ahead Expectation
Improved
Remained Same
Worsened
Net Response
Will Improve
Will Remain Same
Will Worsen
Net Response
Jun-18
34.7
26.4
38.9
-4.1
50.9
25.8
23.4
27.5
Sep-18
35.2
19.3
45.5
-10.3
54.1
17.0
29.0
25.1
Nov-18
33.9
18.9
47.2
-13.3
53.5
16.1
30.4
23.1
Dec-18
35.6
20.1
44.3
-8.7
60.3
17.1
22.7
37.6
Mar-19
41.1
21.7
37.2
3.9
65.3
15.9
18.9
46.4
May-19
33.7
22.1
44.2
-10.5
59.3
17.6
23.1
36.2
Jul-19
32.5
21.9
45.6
-13.1
56.7
17.5
25.8
30.9
Table 3: Perceptions and Expectations on Price Level
(Percentage responses)
Survey Round
Current Perception
One year ahead Expectation
Increased
Remained Same
Decreased
Net Response
Will Increase
Will Remain Same
Will Decrease
Net Response
Jun-18
89.1
7.9
3.0
-86.0
82.8
11.8
5.4
-77.4
Sep-18
88.3
8.5
3.2
-85.1
80.1
12.0
7.9
-72.2
Nov-18
88.3
7.8
3.8
-84.5
80.2
11.6
8.2
-72.0
Dec-18
84.3
10.9
4.8
-79.5
71.6
15.9
12.5
-59.1
Mar-19
77.8
16.4
5.8
-72.0
68.7
20.5
10.9
-57.8
May-19
81.6
14.1
4.3
-77.3
70.3
18.7
11.0
-59.3
Jul-19
81.7
15.0
3.3
-78.4
73.9
16.1
10.0
-63.9
Table 4: Perceptions and Expectations on Rate of Change in Price Level (Inflation)*
(Percentage responses)
Survey Round
Current Perception
One year ahead Expectation
Increased
Remained Same
Decreased
Net Response
Will Increase
Will Remain Same
Will Decrease
Net Response
Jun-18
81.8
10.5
7.7
-74.2
79.4
13.7
6.9
-72.5
Sep-18
80.8
13.2
6.1
-74.7
79.8
14.2
6.1
-73.7
Nov-18
80.0
13.9
6.1
-73.9
75.9
18.0
6.1
-69.8
Dec-18
77.9
15.2
6.9
-71.0
76.3
17.3
6.4
-69.9
Mar-19
72.5
20.0
7.6
-64.9
72.9
20.8
6.3
-66.6
May-19
74.4
20.8
4.8
-69.6
76.7
18.5
4.8
-71.9
Jul-19
72.5
22.3
5.2
-67.3
77.8
18.0
4.1
-73.7
*Applicable only for those respondents who felt price has increased/price will increase.
Table 5: Perceptions and Expectations on Income
(Percentage responses)
Survey Round
Current Perception
One year ahead Expectation
Increased
Remained Same
Decreased
Net Response
Will Increase
Will Remain Same
Will Decrease
Net Response
Jun-18
27.1
50.8
22.1
5.0
51.3
38.0
10.7
40.5
Sep-18
28.3
48.3
23.4
4.9
59.1
33.1
7.8
51.3
Nov-18
29.9
49.5
20.5
9.4
59.0
34.3
6.7
52.3
Dec-18
29.8
48.2
22.0
7.8
63.5
30.4
6.2
57.3
Mar-19
30.1
50.0
19.9
10.2
60.8
33.4
5.7
55.1
May-19
29.0
50.2
20.8
8.2
58.9
35.1
6.0
52.9
Jul-19
25.8
51.3
22.9
2.9
55.4
37.7
6.9
48.5
Table 6: Perceptions and Expectations on Spending
(Percentage responses)
Survey Round
Current Perception
One year ahead Expectation
Increased
Remained Same
Decreased
Net Response
Will Increase
Will Remain Same
Will Decrease
Net Response
Jun-18
83.8
14.1
2.0
81.8
86.5
11.3
2.2
84.4
Sep-18
78.4
18.2
3.5
74.9
81.2
15.7
3.1
78.1
Nov-18
73.0
23.9
3.1
69.9
77.6
19.0
3.4
74.2
Dec-18
73.8
22.7
3.5
70.3
77.3
18.7
4.0
73.3
Mar-19
70.1
26.8
3.1
67.0
77.5
19.9
2.6
74.9
May-19
68.6
28.0
3.4
65.2
74.7
22.5
2.9
71.8
Jul-19
71.7
25.0
3.4
68.3
76.8
20.1
3.2
73.6
Table 7: Perceptions and Expectations on Spending- Essential Items
(Percentage responses)
Survey Round
Current Perception
One year ahead Expectation
Increased
Remained Same
Decreased
Net Response
Will Increase
Will Remain Same
Will Decrease
Net Response
Jun-18
86.6
11.1
2.3
84.3
87.5
10.0
2.5
85.0
Sep-18
83.6
13.1
3.4
80.2
84.2
13.1
2.7
81.5
Nov-18
83.4
13.4
3.2
80.2
84.1
12.5
3.3
80.8
Dec-18
82.4
14.5
3.1
79.3
83.5
13.0
3.4
80.1
Mar-19
78.6
18.2
3.2
75.4
83.4
14.3
2.3
81.1
May-19
80.0
17.1
2.9
77.1
80.7
16.5
2.8
77.9
Jul-19
81.7
15.7
2.6
79.1
82.9
14.3
2.8
80.1
Table 8: Perceptions and Expectations on Spending- Non-Essential Items
(Percentage responses)
Survey Round
Current Perception
One year ahead Expectation
Increased
Remained Same
Decreased
Net Response
Will Increase
Will Remain Same
Will Decrease
Net Response
Jun-18
55.4
32.9
11.7
43.8
62.7
28.0
9.3
53.4
Sep-18
44.0
34.3
21.7
22.3
49.2
33.3
17.5
31.7
Nov-18
39.1
37.6
23.3
15.8
44.5
35.9
19.6
24.9
Dec-18
38.4
37.5
24.1
14.3
46.1
33.0
20.9
25.2
Mar-19
36.3
43.3
20.4
15.9
46.1
37.6
16.3
29.8
May-19
32.7
40.3
27.0
5.7
39.4
37.3
23.3
16.1
Jul-19
31.0
44.9
24.1
6.9
36.2
42.2
21.6
14.6
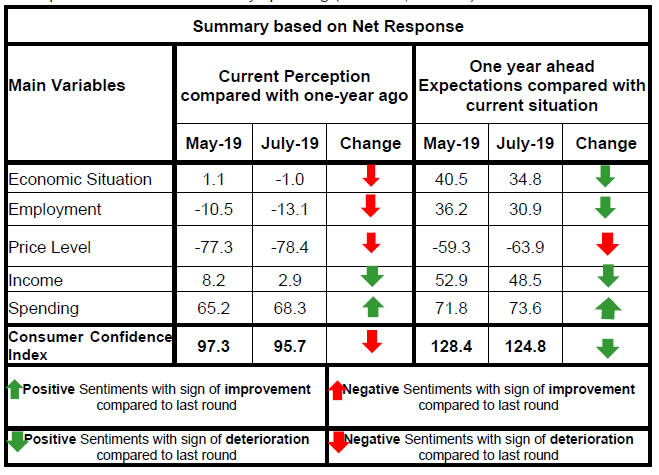
1 The survey results are based on the views of respondents.
2 CSI and FEI are compiled on the basis of net responses on the economic situation, income, spending, employment and the price level for the current period and a year ahead, respectively. CSI/FEI = 100 + Average of Net Responses of the above parameters.
RbiTtsCommonUtility
PLAYING
LISTEN
LOADING...
0:062:49
Related Assets
RBI-Install-RBI-Content-Global
RbiSocialMediaUtility
Share this page:
Install the RBI mobile application and get quick access to the latest news!
RbiWasItHelpfulUtility
Was this page helpful?Thanks!
Would like to give more details?
Thank you for your feedback!Thank you for your feedback!