Today, the Reserve Bank released the results of the November 2019 round of its Consumer Confidence Survey (CCS)1. The survey was conducted in 13 major cities viz., Ahmedabad; Bengaluru; Bhopal; Chennai; Delhi; Guwahati; Hyderabad; Jaipur; Kolkata; Lucknow; Mumbai; Patna; and Thiruvananthapuram. Perceptions and expectations on the general economic situation, the employment scenario, the overall price situation and own income and spending are obtained from 5,334 households across these cities.
Highlights:
I. Consumer confidence weakened further in November, with both the current situation index (CSI) and the future expectations index (FEI)2 declining (Chart 1).
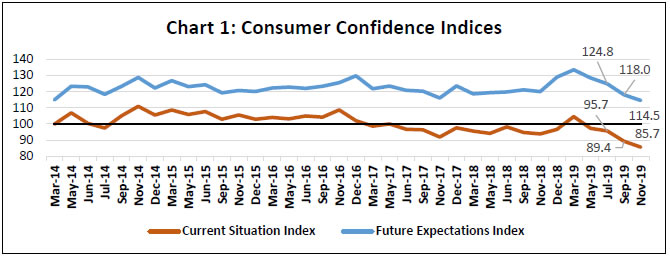
II. Consumers’ sentiments on the general economic situation and the employment scenario weakened, but their one year ahead expectations remained in the optimistic terrain for all parameters, except prices (Tables 1 and 2); expectations on income one year ahead improved marginally over the previous survey round (Table 5).
III. Most respondents perceived prices as having increased during the last one year, and they expect further rise in prices in the year ahead (Tables 3 and 4); households’ sentiments on overall spending remained resilient (Tables 6, 7 and 8).
Table 1: Perceptions and Expectations on the General Economic Situation
(Percentage responses)
Survey Round
Current Perception
One year ahead Expectation
Improved
Remained Same
Worsened
Net Response
Will Improve
Will Remain Same
Will Worsen
Net Response
Nov-18
33.2
21.6
45.2
-12.0
53.6
15.3
31.2
22.4
Dec-18
36.7
20.2
43.1
-6.4
59.9
15.8
24.3
35.6
Mar-19
46.2
21.3
32.5
13.7
66.4
15.8
17.8
48.6
May-19
38.8
23.6
37.7
1.1
61.4
17.7
20.9
40.5
Jul-19
37.4
24.2
38.4
-1.0
59.4
16.0
24.6
34.8
Sep-19
33.5
18.6
47.9
-14.4
53.2
15.0
31.8
21.4
Nov-19
30.0
18.4
51.6
-21.6
48.9
16.5
34.7
14.2
Table 2: Perceptions and Expectations on Employment
(Percentage responses)
Survey Round
Current Perception
One year ahead Expectation
Improved
Remained Same
Worsened
Net Response
Will Improve
Will Remain Same
Will Worsen
Net Response
Nov-18
33.9
18.9
47.2
-13.3
53.5
16.1
30.4
23.1
Dec-18
35.6
20.1
44.3
-8.7
60.3
17.1
22.7
37.6
Mar-19
41.1
21.7
37.2
3.9
65.3
15.9
18.9
46.4
May-19
33.7
22.1
44.2
-10.5
59.3
17.6
23.1
36.2
Jul-19
32.5
21.9
45.6
-13.1
56.7
17.5
25.8
30.9
Sep-19
28.0
19.5
52.5
-24.5
51.2
15.4
33.4
17.8
Nov-19
24.4
18.1
57.5
-33.1
46.3
17.7
36.0
10.3
Table 3: Perceptions and Expectations on Price Level
(Percentage responses)
Survey Round
Current Perception
One year ahead Expectation
Increased
Remained Same
Decreased
Net Response
Will Increase
Will Remain Same
Will Decrease
Net Response
Nov-18
88.3
7.8
3.8
-84.5
80.2
11.6
8.2
-72.0
Dec-18
84.3
10.9
4.8
-79.5
71.6
15.9
12.5
-59.1
Mar-19
77.8
16.4
5.8
-72.0
68.7
20.5
10.9
-57.8
May-19
81.6
14.1
4.3
-77.3
70.3
18.7
11.0
-59.3
Jul-19
81.7
15.0
3.3
-78.4
73.9
16.1
10.0
-63.9
Sep-19
86.1
10.6
3.3
-82.8
75.9
13.8
10.3
-65.6
Nov-19
86.8
10.2
2.9
-83.9
78.0
14.1
7.9
-70.1
Table 4: Perceptions and Expectations on Rate of Change in Price Level (Inflation)*
(Percentage responses)
Survey Round
Current Perception
One year ahead Expectation
Increased
Remained Same
Decreased
Net Response
Will Increase
Will Remain Same
Will Decrease
Net Response
Nov-18
80.0
13.9
6.1
-73.9
75.9
18.0
6.1
-69.8
Dec-18
77.9
15.2
6.9
-71.0
76.3
17.3
6.4
-69.9
Mar-19
72.5
20.0
7.6
-64.9
72.9
20.8
6.3
-66.6
May-19
74.4
20.8
4.8
-69.6
76.7
18.5
4.8
-71.9
Jul-19
72.5
22.3
5.2
-67.3
77.8
18.0
4.1
-73.7
Sep-19
74.2
19.5
6.3
-67.9
77.9
16.1
6.1
-71.8
Nov-19
77.2
17.4
5.5
-71.7
77.3
17.3
5.4
-71.9
*Applicable only for those respondents who felt price has increased/price will increase.
Table 5: Perceptions and Expectations on Income
(Percentage responses)
Survey Round
Current Perception
One year ahead Expectation
Increased
Remained Same
Decreased
Net Response
Will Increase
Will Remain Same
Will Decrease
Net Response
Nov-18
29.9
49.5
20.5
9.4
59.0
34.3
6.7
52.3
Dec-18
29.8
48.2
22.0
7.8
63.5
30.4
6.2
57.3
Mar-19
30.1
50.0
19.9
10.2
60.8
33.4
5.7
55.1
May-19
29.0
50.2
20.8
8.2
58.9
35.1
6.0
52.9
Jul-19
25.8
51.3
22.9
2.9
55.4
37.7
6.9
48.5
Sep-19
25.0
48.3
26.7
-1.7
53.0
37.4
9.6
43.4
Nov-19
24.1
49.2
26.7
-2.6
52.8
38.9
8.3
44.5
Table 6: Perceptions and Expectations on Spending
(Percentage responses)
Survey Round
Current Perception
One year ahead Expectation
Increased
Remained Same
Decreased
Net Response
Will Increase
Will Remain Same
Will Decrease
Net Response
Nov-18
73.0
23.9
3.1
69.9
77.6
19.0
3.4
74.2
Dec-18
73.8
22.7
3.5
70.3
77.3
18.7
4.0
73.3
Mar-19
70.1
26.8
3.1
67.0
77.5
19.9
2.6
74.9
May-19
68.6
28.0
3.4
65.2
74.7
22.5
2.9
71.8
Jul-19
71.7
25.0
3.4
68.3
76.8
20.1
3.2
73.6
Sep-19
74.1
22.0
3.8
70.3
77.0
19.0
4.0
73.0
Nov-19
73.2
23.4
3.4
69.8
77.4
19.0
3.6
73.8
Table 7: Perceptions and Expectations on Spending- Essential Items
(Percentage responses)
Survey Round
Current Perception
One year ahead Expectation
Increased
Remained Same
Decreased
Net Response
Will Increase
Will Remain Same
Will Decrease
Net Response
Nov-18
83.4
13.4
3.2
80.2
84.1
12.5
3.3
80.8
Dec-18
82.4
14.5
3.1
79.3
83.5
13.0
3.4
80.1
Mar-19
78.6
18.2
3.2
75.4
83.4
14.3
2.3
81.1
May-19
80.0
17.1
2.9
77.1
80.7
16.5
2.8
77.9
Jul-19
81.7
15.7
2.6
79.1
82.9
14.3
2.8
80.1
Sep-19
83.8
13.6
2.6
81.2
83.0
13.7
3.3
79.7
Nov-19
83.6
13.6
2.7
80.9
83.0
13.9
3.1
79.9
Table 8: Perceptions and Expectations on Spending- Non-Essential Items
(Percentage responses)
Survey Round
Current Perception
One year ahead Expectation
Increased
Remained Same
Decreased
Net Response
Will Increase
Will Remain Same
Will Decrease
Net Response
Nov-18
39.1
37.6
23.3
15.8
44.5
35.9
19.6
24.9
Dec-18
38.4
37.5
24.1
14.3
46.1
33.0
20.9
25.2
Mar-19
36.3
43.3
20.4
15.9
46.1
37.6
16.3
29.8
May-19
32.7
40.3
27.0
5.7
39.4
37.3
23.3
16.1
Jul-19
31.0
44.9
24.1
6.9
36.2
42.2
21.6
14.6
Sep-19
29.9
40.0
30.1
-0.2
34.7
39.2
26.0
8.7
Nov-19
27.5
42.4
30.1
-2.6
33.4
43.0
23.5
9.9
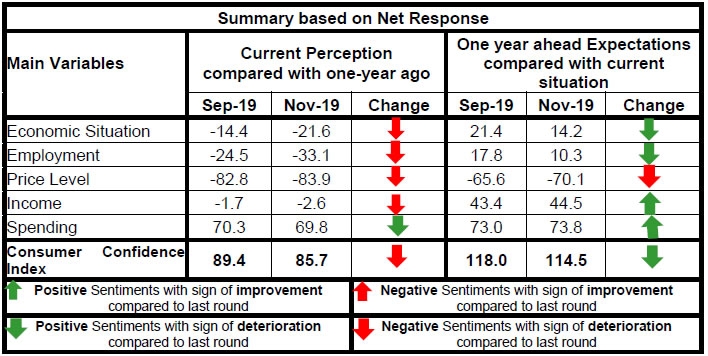
1 The survey results are based on the views of respondents.
2 CSI and FEI are compiled on the basis of net responses on the economic situation, income, spending, employment and the price level for the current period and a year ahead, respectively. CSI/FEI = 100 + Average of Net Responses of the above parameters.
RbiTtsCommonUtility
PLAYING
LISTEN
LOADING...
0:062:49
Related Assets
RBI-Install-RBI-Content-Global
RbiSocialMediaUtility
Share this page:
Install the RBI mobile application and get quick access to the latest news!
RbiWasItHelpfulUtility
Was this page helpful?Thanks!
Would like to give more details?
Thank you for your feedback!Thank you for your feedback!