|
Today, the Reserve Bank released the results of July 2024 round of its bi-monthly consumer confidence survey (CCS)[1]. The survey collects current perceptions (vis-à-vis a year ago) and one year ahead expectations of households on general economic situation, employment scenario, overall price situation, own income and spending across 19 major cities. The latest round of the survey was conducted during July 2-11, 2024, covering 6,062 respondents. Female respondents accounted for 54.4 per cent of this sample.
Highlights:
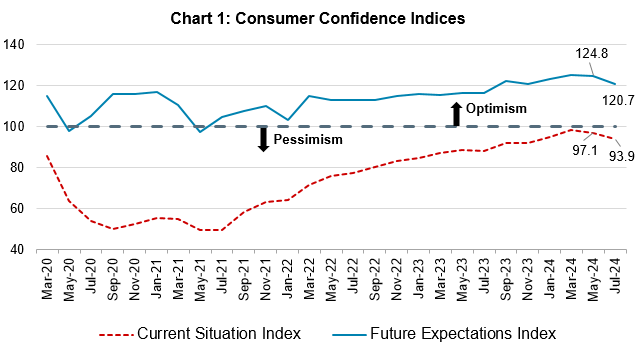
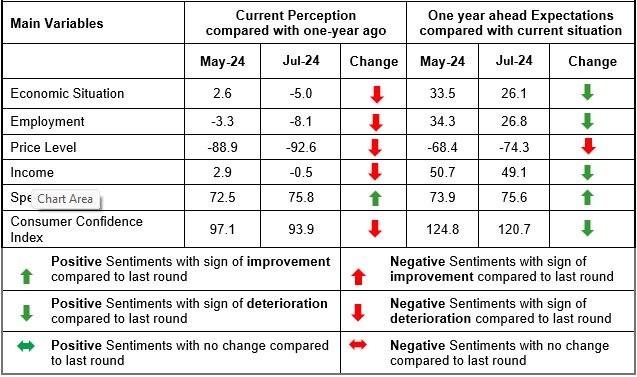
- Consumer confidence for current period declined for the second consecutive survey round after prolonged rising trend in the post-Covid period; their sentiments on major parameters, except spending, moderated and, as a result, the current situation index (CSI)[2] declined to 93.9 in July 2024 from 97.1 two months earlier (Chart 1; Tables 1, 2, 3, 5 and 6).
- Households’ optimism on economic conditions for the year ahead remained in positive terrain, though it came down from the previous survey round; lower optimism on general economic situation, employment and prices led to 4.1 point moderation in the future expectations index (FEI) to 120.7 in July 2024 (Chart 1; Tables 1, 2 and 3).
- Sentiments on current employment situation and own income deteriorated for the second consecutive survey round; the outlook for both these parameters also moderated within the zone of optimism (Tables 2 and 5).
Note: Please see the excel file for time series data[3]
|
Summary based on Net Responses[4]
|
 |
|
Table 1: Perceptions and Expectations on the General Economic Situation
|
|
(Percentage responses)
|
|
Survey Round
|
Current Perception
|
One year ahead Expectation
|
|
Increased
|
Remained Same
|
Decreased
|
Net Response
|
Will Increase
|
Will Remain Same
|
Will Decrease
|
Net Response
|
|
Jul-23
|
30.4
|
18.5
|
51.1
|
-20.7
|
51.1
|
15.1
|
33.8
|
17.2
|
|
Sep-23
|
36.1
|
19.9
|
44.0
|
-7.9
|
56.8
|
15.1
|
28.1
|
28.6
|
|
Nov-23
|
33.1
|
22.5
|
44.4
|
-11.3
|
54.3
|
17.2
|
28.5
|
25.7
|
|
Jan-24
|
37.5
|
22.3
|
40.2
|
-2.7
|
59.2
|
15.3
|
25.5
|
33.7
|
|
Mar-24
|
41.2
|
23.1
|
35.8
|
5.4
|
60.7
|
15.8
|
23.4
|
37.3
|
|
May-24
|
40.0
|
22.6
|
37.4
|
2.6
|
59.0
|
15.6
|
25.4
|
33.5
|
|
Jul-24
|
36.3
|
22.4
|
41.3
|
-5.0
|
55.0
|
16.0
|
29.0
|
26.1
|
|
Table 2: Perceptions and Expectations on Employment
|
|
(Percentage responses)
|
|
Survey Round
|
Current Perception
|
One year ahead Expectation
|
|
Increased
|
Remained Same
|
Decreased
|
Net Response
|
Will Increase
|
Will Remain Same
|
Will Decrease
|
Net Response
|
|
Jul-23
|
30.8
|
21.0
|
48.2
|
-17.5
|
51.4
|
18.3
|
30.3
|
21.1
|
|
Sep-23
|
34.0
|
21.8
|
44.2
|
-10.2
|
55.8
|
18.1
|
26.2
|
29.6
|
|
Nov-23
|
32.3
|
23.0
|
44.7
|
-12.4
|
53.6
|
19.7
|
26.8
|
26.9
|
|
Jan-24
|
35.3
|
23.4
|
41.3
|
-6.0
|
58.7
|
17.4
|
24.0
|
34.7
|
|
Mar-24
|
38.1
|
23.8
|
38.1
|
-0.0
|
60.0
|
17.4
|
22.6
|
37.4
|
|
May-24
|
36.8
|
23.0
|
40.2
|
-3.3
|
58.0
|
18.3
|
23.7
|
34.3
|
|
Jul-24
|
34.5
|
23.0
|
42.6
|
-8.1
|
54.2
|
18.4
|
27.4
|
26.8
|
|
Table 3: Perceptions and Expectations on Price Level
|
|
(Percentage responses)
|
|
Survey Round
|
Current Perception
|
One year ahead Expectation
|
|
Increased
|
Remained Same
|
Decreased
|
Net Response
|
Will Increase
|
Will Remain Same
|
Will Decrease
|
Net Response
|
|
Jul-23
|
92.7
|
6.0
|
1.3
|
-91.4
|
80.9
|
10.2
|
8.9
|
-72.0
|
|
Sep-23
|
91.8
|
6.4
|
1.8
|
-90.0
|
78.4
|
9.9
|
11.7
|
-66.8
|
|
Nov-23
|
91.3
|
7.3
|
1.4
|
-89.9
|
81.0
|
10.2
|
8.8
|
-72.3
|
|
Jan-24
|
90.8
|
7.2
|
2.0
|
-88.9
|
80.5
|
10.4
|
9.1
|
-71.4
|
|
Mar-24
|
89.2
|
9.3
|
1.4
|
-87.8
|
78.2
|
12.5
|
9.4
|
-68.8
|
|
May-24
|
90.5
|
7.8
|
1.6
|
-88.9
|
79.0
|
10.4
|
10.6
|
-68.4
|
|
Jul-24
|
93.3
|
6.0
|
0.7
|
-92.6
|
82.7
|
8.9
|
8.4
|
-74.3
|
|
Table 4: Perceptions and Expectations on Rate of Change in Price Level (Inflation)*
|
|
(Percentage responses)
|
|
Survey Round
|
Current Perception
|
One year ahead Expectation
|
|
Increased
|
Remained Same
|
Decreased
|
Net Response
|
Will Increase
|
Will Remain Same
|
Will Decrease
|
Net Response
|
|
Jul-23
|
84.5
|
11.8
|
3.7
|
-80.8
|
80.8
|
14.8
|
4.4
|
-76.4
|
|
Sep-23
|
82.5
|
13.4
|
4.2
|
-78.3
|
79.4
|
15.8
|
4.8
|
-74.6
|
|
Nov-23
|
81.8
|
13.6
|
4.6
|
-77.2
|
80.1
|
14.7
|
5.2
|
-75.0
|
|
Jan-24
|
79.5
|
15.7
|
4.8
|
-74.7
|
77.2
|
17.8
|
5.0
|
-72.2
|
|
Mar-24
|
77.0
|
17.6
|
5.4
|
-71.6
|
76.7
|
18.3
|
5.0
|
-71.7
|
|
May-24
|
77.8
|
15.1
|
7.1
|
-70.6
|
79.1
|
16.0
|
4.9
|
-74.3
|
|
Jul-24
|
80.6
|
13.4
|
6.1
|
-74.6
|
79.4
|
16.2
|
4.4
|
-75.0
|
|
*Applicable only for those respondents who felt price has increased/price will increase.
|
|
Table 5: Perceptions and Expectations on Income
|
|
(Percentage responses)
|
|
Survey Round
|
Current Perception
|
One year ahead Expectation
|
|
Increased
|
Remained Same
|
Decreased
|
Net Response
|
Will Increase
|
Will Remain Same
|
Will Decrease
|
Net Response
|
|
Jul-23
|
25.4
|
49.9
|
24.8
|
0.6
|
54.7
|
38.6
|
6.7
|
48.0
|
|
Sep-23
|
25.0
|
49.8
|
25.2
|
-0.3
|
55.7
|
37.8
|
6.5
|
49.2
|
|
Nov-23
|
27.2
|
50.1
|
22.7
|
4.5
|
57.9
|
36.0
|
6.1
|
51.8
|
|
Jan-24
|
26.4
|
51.5
|
22.1
|
4.2
|
56.3
|
36.9
|
6.8
|
49.4
|
|
Mar-24
|
27.7
|
50.6
|
21.7
|
6.0
|
56.7
|
37.2
|
6.1
|
50.5
|
|
May-24
|
25.3
|
52.3
|
22.4
|
2.9
|
56.9
|
36.9
|
6.2
|
50.7
|
|
Jul-24
|
24.4
|
50.8
|
24.9
|
-0.5
|
55.9
|
37.3
|
6.8
|
49.1
|
|
Table 6: Perceptions and Expectations on Spending
|
|
(Percentage responses)
|
|
Survey Round
|
Current Perception
|
One year ahead Expectation
|
|
Increased
|
Remained Same
|
Decreased
|
Net Response
|
Will Increase
|
Will Remain Same
|
Will Decrease
|
Net Response
|
|
Jul-23
|
74.5
|
20.5
|
5.0
|
69.6
|
73.8
|
21.3
|
4.8
|
69.0
|
|
Sep-23
|
74.6
|
20.2
|
5.2
|
69.4
|
75.2
|
20.3
|
4.6
|
70.6
|
|
Nov-23
|
74.8
|
20.6
|
4.6
|
70.1
|
75.0
|
21.0
|
4.1
|
70.9
|
|
Jan-24
|
73.2
|
22.3
|
4.5
|
68.6
|
74.2
|
20.9
|
5.0
|
69.2
|
|
Mar-24
|
73.1
|
23.1
|
3.8
|
69.2
|
73.9
|
21.7
|
4.3
|
69.6
|
|
May-24
|
76.2
|
20.1
|
3.8
|
72.5
|
77.9
|
18.1
|
4.0
|
73.9
|
|
Jul-24
|
78.9
|
18.0
|
3.1
|
75.8
|
79.5
|
16.5
|
3.9
|
75.6
|
|
Table 7: Perceptions and Expectations on Spending- Essential Items
|
|
(Percentage responses)
|
|
Survey Round
|
Current Perception
|
One year ahead Expectation
|
|
Increased
|
Remained Same
|
Decreased
|
Net Response
|
Will Increase
|
Will Remain Same
|
Will Decrease
|
Net Response
|
|
Jul-23
|
85.3
|
11.8
|
3.0
|
82.3
|
81.0
|
15.5
|
3.5
|
77.5
|
|
Sep-23
|
84.9
|
11.9
|
3.2
|
81.7
|
82.0
|
14.4
|
3.6
|
78.4
|
|
Nov-23
|
85.7
|
11.4
|
2.9
|
82.7
|
82.3
|
14.4
|
3.4
|
78.9
|
|
Jan-24
|
84.1
|
12.9
|
3.0
|
81.1
|
81.8
|
14.6
|
3.6
|
78.2
|
|
Mar-24
|
84.5
|
13.0
|
2.5
|
82.0
|
82.5
|
14.5
|
3.0
|
79.5
|
|
May-24
|
85.6
|
11.8
|
2.7
|
82.9
|
84.7
|
12.3
|
3.1
|
81.6
|
|
Jul-24
|
87.3
|
10.5
|
2.2
|
85.1
|
85.0
|
12.1
|
2.9
|
82.0
|
|
Table 8: Perceptions and Expectations on Spending- Non-Essential Items
|
|
(Percentage responses)
|
|
Survey Round
|
Current Perception
|
One year ahead Expectation
|
|
Increased
|
Remained Same
|
Decreased
|
Net Response
|
Will Increase
|
Will Remain Same
|
Will Decrease
|
Net Response
|
|
Jul-23
|
26.6
|
36.9
|
36.5
|
-10.0
|
34.8
|
37.6
|
27.6
|
7.3
|
|
Sep-23
|
23.4
|
38.5
|
38.2
|
-14.8
|
33.0
|
38.2
|
28.8
|
4.2
|
|
Nov-23
|
25.2
|
36.6
|
38.2
|
-13.0
|
34.1
|
36.8
|
29.0
|
5.1
|
|
Jan-24
|
27.2
|
36.2
|
36.6
|
-9.4
|
34.6
|
36.4
|
29.0
|
5.5
|
|
Mar-24
|
29.2
|
37.6
|
33.2
|
-4.1
|
35.7
|
37.6
|
26.7
|
9.0
|
|
May-24
|
30.5
|
35.4
|
34.1
|
-3.7
|
37.4
|
35.2
|
27.4
|
9.9
|
|
Jul-24
|
29.0
|
36.7
|
34.4
|
-5.4
|
37.4
|
35.6
|
27.0
|
10.3
|
*****
[1] The survey results reflect the respondents’ views, which are not necessarily shared by the Reserve Bank. Results of the previous survey round were released on the Bank’s website on June 07, 2024.
[2] CSI and FEI are compiled on the basis of net responses on the economic situation, income, spending, employment and the price level for the current period (as compared with one year ago) and a year ahead, respectively. CSI and FEI = 100 + Average of Net Responses of the above parameters.
[3] Unit-level data for previous rounds of the survey are available on the Bank’s ‘Database on Indian Economy’ (DBIE) portal (weblink: https://data.rbi.org.in) under the head ‘Unit-level Data’.
[4] ‘Net response’ is the difference between the percentage of respondents reporting optimism and those reporting pessimisms. It ranges between -100 and 100. Any value greater than zero indicates expansion/ optimism and values less than zero indicate contraction/ pessimism.
|
 IST,
IST,