Ramesh Golait* This paper attempts to analyse the issues in agricultural
credit in India. The analysis reveals that the credit delivery to the agriculture
sector continues to be inadequate. It appears that the banking system is still
hesitant on various grounds to purvey credit to small and marginal farmers. The
situation calls for concerted efforts to augment the flow of credit to agriculture,
alongside exploring new innovations in product design and methods of delivery,
through better use of technology and related processes. Facilitating credit through
processors, input dealers, NGOs, etc., that are vertically integrated
with the farmers, including through contract farming, for providing them critical
inputs or processing their produce, could increase the credit flow to agriculture
significantly. JEL Classification : F 361, 362, Q14
Keywords : Agriculture,
Credit, Rural
Introduction
Agriculture plays a crucial role in the development of the Indian economy.
It accounts for about 19 per cent of GDP and about two-thirds of the population
is dependent on the sector. The importance of farm credit as a critical input
to agriculture is reinforced by the unique role of Indian agriculture in the macroeconomic
framework and its role in poverty alleviation. Recognising the importance of agriculture
sector in India’s development, the Government and the Reserve Bank of India
(RBI) have played a vital role in creating a broad-based institutional framework
for catering to the increasing credit requirements of the sector. Agricultural
policies in India have been reviewed from time to time to maintain pace with the
changing requirements of the agriculture sector, which forms an important segment
of the priority sector lending of scheduled commercial banks (SCBs) and target
of 18 per cent of net bank credit has been stipulated for the sector. The Approach
Paper to the Eleventh Five Year Plan has set a target of 4 per cent for the agriculture
sector within the overall GDP growth target of 9 per cent. In this context, the
need for affordable, sufficient and timely supply of institutional credit to agriculture
has assumed critical importance. The evolution of institutional credit to agriculture
could be broadly classified into four distinct phases - 1904-1969 (predominance
of co-operatives and setting up of RBI), 1969-1975 [nationalisation of commercial
banks and setting up of Regional Rural Banks (RRBs)], 1975-1990(setting up of
NABARD) and from 1991 onwards (financial sector reforms).
The genesis
of institutional involvement in the sphere of agricultural credit could be traced
back to the enactment of the Cooperative Societies Act in 1904. The establishment
of the RBI in 1935 reinforced the process of institutional development for agricultural
credit. The RBI is perhaps the first central bank in the world to have taken interest
in the matters related to agriculture and agricultural credit, and it continues
to do so (Reddy, 2001).
The demand for agricultural credit arises due
to i) lack of simultaneity between the realisation of income and act of expenditure;
ii) lumpiness of investment in fixed capital formation; and iii) stochastic surges
in capital needs and saving that accompany technological innovations. Credit,
as one of the critical non-land inputs, has two-dimensions from the viewpoint
of its contribution to the augmentation of agricultural growth viz.,
availability of credit (the quantum) and the distribution of credit. In this paper,
the trends in agricultural credit are analysed in Section I; Section II covers
State-wise distribution of institutional credit; Section III deals with recent
policy initiatives; issues and concerns are dealt with in Section IV; Section
V draws implications for the future followed by the concluding observations in
Section VI. Section I Agricultural
Credit: Discernible Trends In India a multi-agency approach comprising
co-operative banks, scheduled commercial banks and RRBs has been followed for
purveying credit to agricultural sector. The policy of agricultural credit is
guided mainly by the considerations of ensuring adequate and timely availability
of credit at reasonable rates through the expansion of institutional framework,
its outreach and scale as also by way of directed lending. Over time, spectacular
progress has been achieved in terms of the scale and outreach of institutional
framework for agricultural credit. Some of the major discernible trends are as
follows:
Over time the public sector banks have made commendable
progress in terms of putting in place a wide banking network, particularly in
the aftermath of nationalisation of banks. The number of offices of public sector
banks increased rapidly from 8,262 in June 1969 to 68,355 by March 2005.
One of the major achievements in the post-independent India has been widening
the spread of institutional machinery for credit and decline in the role of non-institutional
sources, notwithstanding some reversal in the trend observed particularly in the
1990s.
The share of institutional credit, which was little over
7 per cent in 1951, increased manifold to over 66 per cent in 1991, reflecting
concomitantly a remarkable decline in the share of non-institutional credit from
around 93 per cent to about 31 per cent during the same period. However, the latest
NSSO Survey reveals that the share of non-institutional credit has taken a reverse
swing which is a cause of concern (Table 1).
Notwithstanding their
wide network, co-operative banks, particularly since the 1990s have lost their
dominant position to commercial banks. The share of co-operative banks (22 per
cent) during 2005-06 was less than half of what it was in 1992-93 (62 per cent),
while the share of commercial banks (33 to 68 per cent) including RRBs (5 to 10
per cent) almost doubled during the above period (Chart 1).
The
efforts to increase the flow of credit to agriculture seems to have yielded better
results in the recent period as the total institutional credit to agriculture
recorded a growth of around 21 per cent during 1995-96 to 2004-05 from little
over 12 per cent during 1986-87 to 1994-95. In terms of total credit to agriculture,
the commercial banks recorded a considerable
Table
1: Relative Share of Borrowing of Cultivator Households from
Different Sources | (Per
cent) | Sources
Credit | 1951 | 1961 | 1971 | 1981 | 1991 | 2002 |
1 | 2 | 3 | 4 | 5 | 6 | 7 |
Non-Institutional | 92.7 | 81.3 | 68.3 | 36.8 | 30.6 | 38.9 |
of which |
| |
| |
| |
Money Lenders | 69.7 | 49.2 | 36.1 | 16.1 | 17.5 | 26.8 |
Institutional | 7.3 | 18.7 | 31.7 | 63.2 | 66.3 | 61.1 |
of which |
| |
| |
| |
Cooperatives Societies / Banks | 3.3 | 2.6 | 22.0 | 29.8 | 23.6 | 30.2 |
Commercial Banks | 0.9 | 0.6 | 2.4 | 28.8 | 35.2 | 26.3 |
Unspecified | – | – | – | – | 3.1 | – |
Total | 100.0 | 100.0 | 100.0 | 100.0 | 100.0 | 100.0 |
Source : All
India Debt and Investment Survey and NSSO. | 
growth
(from around 13 per cent to about 21 per cent), while cooperative banks registered
a fall (over 14 per cent to over 10 per cent) during the above period (Table 2). 1.
However, the growth of direct finance to agriculture and allied activities witnessed
a decline in the 1990s1 (12 per cent) as compared to the 1980s (14 per cent) and
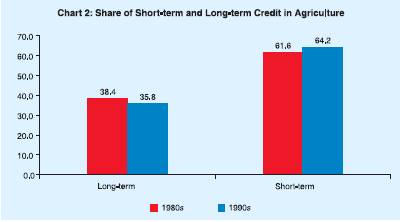
1970s (around 16 per cent). Furthermore, a comparative analysis of direct credit
to agriculture and allied activities during 1980s and since 1990s reveals the
fact that the average share of long-term credit in the total direct finance has
not only been much lower but has also decelerated (from over 38 per cent to around
36 per cent), which could have dampening effect on the agricultural investment
for future growth process (Chart 2). The disaggregated picture as per size-wise
distribution of credit reveals that the growth of direct finance to small and
marginal farmers witnessed a marked deceleration from about 24 per cent in the
1980s to little over 13 per cent during the 1990s.
2. Sectoral deployment
of gross bank credit reveals that the share of agriculture since the second half
of 1990s has ranged between 11-12 per cent. As at end March 2006, the share stood
at around 11.9 per cent (Table 3).
Table
2: Institutional Credit to Agriculture |
(Rs.
crore) | Year | Institutions |
Co-op
Banks | Share
(per cent) | RRBs | Share
(per cent) | Commercial
Banks | Share
(per cent) | Total | Per
cent
increase | 1 | 2 | 4 | 5 | 6 | 7 | 8 | 9 | 10 |
1985-86 | 3,874 | 55 | – | – | 3,131 | 45 | 7,005 | – |
1986-87 | 4,207 | 52 | – | – | 3,809 | 48 | 8,016 | 14 |
1987-88 | 4,420 | 52 | – | – | 4,009 | 48 | 8,429 | 5 |
1988-89 | 4,851 | 53 | – | – | 4,233 | 47 | 9,084 | 8 |
1989-90 | 5,082 | 52 | – | – | 4,719 | 48 | 9,801 | 8 |
1990-91 | 3,408 | 39 | – | – | 5,438 | 61 | 8,846 | -10 |
1991-92 | 5,800 | 52 | 596 | 5 | 4,806 | 43 | 11,202 | 27 |
1992-93 | 9,378 | 62 | 831 | 5 | 4,960 | 33 | 15,169 | 35 |
1993-94 | 10,117 | 61 | 977 | 6 | 5,400 | 33 | 16,494 | 9 |
1994-95 | 9,406 | 50 | 1,083 | 6 | 8,255 | 44 | 18,744 | 14 |
1995-96 | 10,479 | 48 | 1,381 | 6 | 10,172 | 46 | 22,032 | 18 |
1996-97 | 11,944 | 45 | 1,684 | 6 | 12,783 | 48 | 26,411 | 20 |
1997-98 | 14,085 | 44 | 2,040 | 6 | 15,831 | 50 | 31,956 | 21 |
1998-99 | 15,916 | 43 | 2,538 | 7 | 18,443 | 50 | 36,897 | 15 |
1999-00 | 18,363 | 40 | 3,172 | 7 | 24,733 | 53 | 46,268 | 25 |
2000-01 | 20,801 | 39 | 4,219 | 8 | 27,807 | 53 | 52,827 | 14 |
2001-02 | 23,604 | 38 | 4,854 | 8 | 33,587 | 54 | 62,045 | 17 |
2002-03 | 23,716 | 34 | 6,070 | 9 | 39,774 | 57 | 69,560 | 12 |
2003-04 | 26,959 | 31 | 7,581 | 9 | 52,441 | 60 | 86,981 | 25 |
2004-05 | 31,424 | 25 | 12,404 | 10 | 81,481 | 65 | 1,25,309 | 44 |
2005-06 | 39,404 | 22 | 15,223 | 8 | 1,25859 | 70 | 1,80,486 | 44 |
2006-07* | 33,174 | 22 | 15,170 | 10 | 1,00,999 | 68 | 1,49,349 | – |
* : up to December 2006.
Note : Commercial Banks and RRBs were clubbed together up to
1990-91.
Source : Economic Survey and NABARD various issues.
| 
Table
3: Sectoral Deployment of Gross Bank Credit | (Rupees
crore) | Sectors
1 | 1996-97 | 1997-98 | 1998-99 | 1999-00 | 2000-01 | 2001-02 | 2002-03 | 2003-04 | 2004-05 | 2005-06 |
2 | 3 | 4 | 5 | 6 | 7 | 8 | 9 | 10 | 11 |
Gross Bank Credit | 2,58,991 | 3,00,283 | 3,42,012 | 4,00,818 | 4,69,153 | 5,36,727 | 6,69,534 | 7,64,383 | 10,40,909 | 14,45,837 |
A. | Priority
Sector | 84,880 | 99,507 | 1,14,611 | 1,31,827 | 1,54,414 | 1,75,259 | 2,11,609 | 2,63,834 | 3,81,476 | 5,09,910 |
I. | Agriculture | 31,442 | 34,869 | 39,634 | 44,381 | 51,922 | 60,761 | 73,518 | 90,541 | 1,25,250 | 1,72,279 |
Share of
Agriculture in | Total | 12.14 | 11.61 | 11.59 | 11.07 | 11.07 | 11.32 | 10.98 | 11.84 | 12.03 | 11.92 |
II. | Small
Scale | |
| |
| |
| |
| |
| | Industries | 35,944 | 43,508 | 48,483 | 52,841 | 56,002 | 57,119 | 60,394 | 65,855 | 74,588 | 90,239 |
III.Other Priority |
| |
| |
| |
| |
| |
| Sector | 17,494 | 21,130 | 26,494 | 34,362 | 46,490 | 57,299 | 77,697 | 1,07,438 | 1,81,638 | 2,47,379 |
B. | Industry | 1,02,604 | 1,17,350 | 1,30,516 | 1,47,319 | 1,62,837 | 1,72,324 | 2,35,168 | 2,47,210 | 3,52,304 | 4,58,808 |
Share of Industry |
| |
| |
| |
| |
| | in
Total | 39.62 | 39.08 | 38.16 | 36.75 | 34.71 | 32.11 | 35.12 | 32.34 | 33.85 | 31.73 |
Source :
Report on Trend and Progress of Banking in India, Various issues. |
Section II State-wise
Distribution of Institutional Credit There are wide
variations in the availability of institutional credit per hectare of gross cropped
area in different States. It was as high as Rs.9,403 in Tamil Nadu, Rs.7,666 in
Kerala, Rs.5,352 in Punjab and Rs.4,604 in Andhra Pradesh, while it was as low
as Rs.311 in Assam, Rs.667 in Rajsthan and Rs.698 in Madhya Pradesh during 2001-02
(Table 4).
Table
4: Distribution of Flow of Institutional Agricultural Credit
in Different States of India | Region/States | 1990-91 | 2001-02 |
| Annual
Increase | Percentage | Rs./hectare
of GCA | Annual
Increase | Rs.
Crore | Per
cent | Rs.
Crore | Per
cent | (per
cent) | GCA(1998-99) | 1990-91
| 2001-02
| (per
cent) | 1 | 2 | 3 | 4 | 5 | 6 | 7 | 8 | 9 | 10 |
Northern | 1,314 | 12.9 | 8,236 | 19.9 | 43.9 | 20.25 | 377 | 2,132 | 38.9 |
Punjab | 642 | 6.3 | 4,304 | 10.4 | 47.5 | 4.22 | 856 | 5,352 | 43.8 |
Haryana | 285 | 2.8 | 1,821 | 4.4 | 44.9 | 3.22 | 482 | 2,964 | 42.9 |
Rajasthan | 326 | 3.2 | 1,490 | 3.6 | 29.7 | 11.70 | 168 | 667 | 24.7 |
Himachal Pradesh | 20 | 0.2 | 248 | 0.6 | 93.2 | 0.51 | 207 | 2,555 | 94.5 |
Jammu and Kashmir | 20 | 0.2 | 83 | 0.2 | 25.5 | 0.57 | 191 | 764 | 25.0 |
North-Eastern | 41 | 0.4 | 207 | 0.5 | 34.0 | 2.90 | 96 | 374 | 31.4 |
Assam | 20 | 0.2 | 124 | 0.3 | 42.4 | 2.09 | 54 | 311 | 39.9 |
Eastern | 846 | 8.3 | 3,062 | 7.4 | 21.8 | 14.71 | 463 | 1,092 | 22.8 |
Orissa | 306 | 3.0 | 414 | 1.0 | 3.0 | 4.53 | 319 | 479 | 4.2 |
West Bengal | 285 | 2.8 | 1,573 | 3.8 | 37.6 | 4.83 | 329 | 1,708 | 34.9 |
Bihar (includes Jharkhand) | 245 | 2.4 | 1,076 | 2.6 | 28.3 | 5.25 | 233 | 1,075 | 30.1 |
Central | 1,722 | 16.9 | 5,835 | 14.1 | 19.9 | 27.57 | 349 | 1,110 | 18.2 |
Madhya Pradesh (includes |
| |
| |
| |
| |
| Chhatisgarh) | 746 | 7.5 | 1,821 | 4.4 | 11.5 | 13.67 | 320 | 698 | 9.9 |
Utrtar Pradesh (includes |
| |
| |
| |
| |
| Uttranchal) | 958 | 9.4 | 4,056 | 9.8 | 27.0 | 13.90 | 376 | 1,529 | 25.6 |
Western | 1,386 | 13.6 | 5,959 | 14.4 | 27.5 | 7.06 | 430 | 1,831 | 27.4 |
Gujarat | 520 | 5.1 | 2,980 | 7.2 | 39.5 | 5.56 | 501 | 2,809 | 38.3 |
Maharashtra | 846 | 8.3 | 2,938 | 7.1 | 20.6 | 11.40 | 387 | 1,352 | 20.8 |
Southern | 4,880 | 47.9 | 18,127 | 43.8 | 22.6 | 17.51 | 1,410 | 5,426 | 23.8 |
Andhra Pradesh | 1,477 | 14.5 | 5,587 | 13.5 | 23.2 | 6.36 | 1,120 | 4,604 | 25.9 |
Karnataka | 642 | 6.3 | 4,041 | 9.7 | 43.8 | 6.13 | 546 | 3,432 | 44.1 |
Kerala | 835 | 8.2 | 2,276 | 5.5 | 14.4 | 1.56 | 2,766 | 7,666 | 14.8 |
Tamil Nadu | 1,895 | 18.6 | 6,166 | 14.9 | 18.8 | 3.44 | 2,857 | 9,403 | 19.1 |
All-India | 10,188 | 100.0 | 41,385 | 100.0 | 25.5 | 100.00 | 549 | 2,169 | 24.6 |
GCA refers to gross cropped
area.
Source :
Report of the Advisory Committee on Flow
of Credit to Agriculture and Related Activities from the Banking
System, RBI,
Mumbai, 2004. | The accessibility to institutional
credit is higher in the Southern region where the level of agricultural development
is also higher. Similar results were reported in the studies conducted earlier
during the 1980s (Rao, 1994). It is kind of vicious cycle operating in less developed
States. Less availability of credit influences adversely the adoption of modern
technology and private capital investments, which in turn lowers the productive
capacity of the agricultural sector and results in lower productivity and production,
and also pushes the farmers to borrow from non-institutional sources. Consequently,
the demand for agricultural credit for short and long-term purposes is dampened.
The extent of deployment of credit out of deposits in a given State could
be measured by Credit-Deposit Ratio (CDR). The proportion of districts having
CDR less than 40 is higher (66 per cent) in less developed States as compared
to the developed States (32 per cent) indicating growing migration and wide disparities
in the deployment of credit in major States (Table 5).
During Tenth Five
Year Plan, the total credit flow to agriculture and allied activities was projected
at Rs.7,36,570 crore. Accordingly, the ground level credit flow to agriculture
has grown to reach over Rs.2,60,540 crore (36 per cent of the projected level)
during the first three year period (2002-03 to 2004-05) of Tenth Plan, indicating
a wide gap in supply of credit, requiring a large increase in credit, particularly
in investment credit to achieve the desired growth level.
Table
5: Credit Deposit Ratio in Major States | (Rupees
crore) | Description | Number
of States | Number
of Districts | <40 | 40-50 | >50 |
1 | 2 | 3 | 4 | 5 | 6 |
States with per capita SDP | 9 | 196 | 129 | 26 | 41 |
less than national average |
| (100) | (66) | (13) | (21) |
States with per capita SDP | 11 | 187 | 60 | 33 | 94 |
more than national average |
| (100) | (32) | (18) | (50) |
Total | 20 | 383 | 189 | 59 | 134 |
|
| (100) | (50) | (15) | (35) |
Figures in the brackets represent
percentages. Credit is taken on utilization basis.
Source :
Report of the Expert Group on Investment Credit, RBI, 2005. |
Section III Recent Policy Initiatives The Finance Minister
in his Union Budget 1995-96 speech stated that, “Inadequacy of public
investment in agriculture is today a matter of general concern. This is an area
which is the responsibility of States. But many States have neglected investment
in infrastructure for agriculture. There are many rural infrastructure projects
which have been started but are lying incomplete for want of resources. They represent
a major loss of potential income and employment to rural population.”
Rural Infrastructure Development Fund (RIDF) was set up in NABARD2. Since
then, 11 tranches of allocations have been made towards the Fund. Commercial banks
make contributions towards the Fund on account of the shortfalls in their priority/agriculture
sector lending. The scope of RIDF has been widened to enable utilisation of loan
by Panchayati Raj Institutions (PRIs), Self-Help Groups (SHGs), Non-Government
Organisations (NGOs), etc., since 1999-2000.
The Fund has continued
with additional corpus being announced every year in the Union Budget. The RIDF
XI was announced in the Union Budget for 2005-06 with an allocation of Rs.8,000
crore making a total corpus of Rs.50,000 crore. RIDF XI accorded special
emphasis for setting up of Village Knowledge Centres by providing Rs.100 crore
out of the corpus of Rs.8,000 crore (Table 6).
Two innovations, viz.,
micro-finance and Kisan Credit Card Scheme (KCCS) have emerged as the major policy
developments in addressing the infirmities associated with the distributional
aspects of credit in the recent years. The KCCS has emerged as the most effective
mode of credit delivery to agriculture in terms of the timeliness, hassle-free
operations as also adequacy of credit with minimum of transaction costs and documentation.
Around 59.09 million KCCs were issued till end-March 2006. The cooperative
banks (51.5 per cent) had a major share followed by commercial banks (36.9 per
cent) and RRBs (11.6 per cent) (Table 7).
The micro credit programme,
which was formally heralded in 1992 with a modest pilot project of linking around
500 SHGs has made rapid strides in India exhibiting considerable democratic functioning
and group dynamism. The programme has now assumed the form of a micro finance
movement in many parts of the country.
There was a massive expansion
during 2004-05 with the banking system establishing credit linkage with 539 thousands
new SHGs, taking the cumulative number of such SHGs to 2.9 million at end-March
2007. Banks extended loans aggregating Rs.18,041 crore at end-March 2007 registering
a growth of 58.3 per cent over the previous year (Table 8).
Several Committees
were set up from time to time to look into the various issues relating to credit
delivery for agriculture, the recent one being Advisory Committee on Flow of Credit
to Agriculture and Related Activities from the Banking System (Chairman: Prof.
V.S. Vyas, June, 2004)3.
Table
6: RIDF: Tranche-wise Size of Corpus | (Rs.
crore) | RIDF
Tranche | Year | Corpus |
1 | 2 | 3 |
RIDF I | 1995-1996 | 2,000 |
RIDF II | 1996-1997 | 2,500 |
RIDF III | 1997-1998 | 2,500 |
RIDF IV | 1998-1999 | 3,000 |
RIDF V | 1999-2000 | 3,500 |
RIDF VI | 2000-2001 | 4,500 |
RIDF VII | 2001-2002 | 5,000 |
RIDF VIII | 2002-2003 | 5,500 |
RIDF IX | 2003-2004 | 5,500 |
RIDF X | 2004-2005 | 8,000 |
RIDF XI | 2005-2006 | 8,000 |
TOTAL | – | 50,000 |
Source : NABARD.
|
Table
7: Agency-wise and Year-wise KCC | (Numbers
in Millions) | Year | Co-operative | RRB’s | Commercial | Total |
| Banks |
| Banks |
| 1 | 2 | 3 | 4 | 5 |
1998-99 | 0.16 | 0.01 | 0.62 | 0.78 |
1999-2000 | 3.6 | 0.17 | 1.37 | 5.13 |
2000-01 | 5.61 | 0.65 | 2.39 | 8.65 |
2001-02 | 5.44 | 0.83 | 3.07 | 9.34 |
2002-03 | 4.58 | 0.96 | 2.7 | 8.24 |
2003-04 | 4.88 | 1.27 | 3.09 | 9.25 |
2004-05 | 3.56 | 1.73 | 4.4 | 9.68 |
2005-06 | 2.60 | 1.25 | 4.17 | 8.01 |
Total | 30.41 | 6.88 | 21.80 | 59.09 |
Share in Total |
| |
| | (per
cent) | 51.5 | 11.6 | 36.9 | 100.0 |
Source : Report
on Trend and Progress of Banking in India, RBI. |
Table
8: SHG-Bank Linkage Programme | Year
| Total
SHGs
Financed
by Banks Number in ‘000 | Bank
Loans
(Rs. crore) | Refinance
(Rs. crore) | During
the Year | Cumulative
| During
the Year | Cumulative
| During
the Year | Cumulative
| 1 | 2 | 3 | 4 | 5 | 6 | 7 |
1999-00 | 81.78 | 114.78 | 136 | 193 | 98 | 150 |
| (147.9) | (247.9) | (138.6) | (238.6) | (88.5) | (188.5) |
2000-01 | 149.05 | 263.83 | 288 | 481 | 251 | 401 |
| (82.3) | (129.9) | (111.8) | (149.2) | (156.1) | (167.3) |
2001-02 | 197.65 | 461.48 | 546 | 1,026 | 396 | 797 |
| (32.6) | (74.9) | (89.6) | (113.3) | (57.8) | (98.8) |
2002-03 | 255.88 | 717.36 | 1,022 | 2,049 | 622 | 1,419 |
| (29.5) | (55.4) | (87.2) | (99.7) | (57.1) | (78.0) |
2003-04 | 361.73 | 1079.09 | 1,856 | 3,904 | 705 | 2,125 |
| (41.4) | (50.4) | (81.6) | (90.5) | (13.3) | (49.7) |
2004-05 | 539.39 | 1,618.48 | 2,994 | 6,899 | 968 | 3,092 |
| (49.1) | (50.0) | (61.4) | (76.7) | (37.3) | (45.5) |
2005-06 | 620 | 2,239 | 4,449 | 11,398 | 1,068 | 4,160 |
| (15.0) | (38.3) | (50.3) | (65.2) | (10.3) | (34.5) |
2006-07 | 686 | 2,924 | 6,643 | 18,041 | 1,299 | 5,459 |
| (11.0) | (30.6) | (47.6) | (58.3) | (21.6) | (31.2) |
Notes :
1. Figures in parentheses indicate percentage variations over the previous year.
2. Data for 2006-07 are provisional.
Source :
Report
on Trend and Progress of Banking in India, various issues. | The
Government has since approved rehabilitation package for the identified districts
in the States of Andhra Pradesh, Karnataka, Kerala, and Maharashtra. Altogether,
the rehabilitation package for the four States involves a total amount of Rs.16,978
crore consisting of Rs.10,579 crore as subsidy/grants and Rs.6,399 crore as loan.
In order to give further fillip to micro-finance movement, the RBI has enabled
Non-Governmental Organisations (NGOs) engaged in micro-finance activities to access
external commercial borrowings (ECBs) up to US $ 5 million during a financial
year for permitted end-use, under automatic route, as an additional channel of
resource mobilisation. Besides, as a follow-up of the Union Budget proposals,
modalities for allowing banks to adopt the agency model4 for providing credit
support to rural and farm sectors and appointment of micro-finance institutions
(MFIs) as banking correspondents are also worked out.
The Government of India
announced a host of measures in June 2004 to double the flow of agricultural credit
during the period 2004-05 to 2006-07 by all the financial institutions. Towards
this end, it was proposed to increase the agricultural credit by 30 per cent to
about Rs.1.05 lakh crore in 2004-05. While the target set for 2004-05 was achieved,
the Union Budget for 2005-06 proposed to increase the credit flow to agriculture
by another 30 per cent by all the institutions concerned.
The Reserve Bank
has undertaken several policy initiatives in pursuance of the objective set in
the Union Budget 2004-05 to achieve a doubling of flow of credit to agriculture.
On the issue of farmers’ suicide in the country, the Government has realised
that indebtedness is one of the major reasons for suicide by farmers in the country.
To prevent and save the farmers from the clutches of private money lenders, several
measures were taken. Banks were advised in particular :
i) To increase
the agricultural credit flow at the rate of 30 per cent per year.
ii)
To restructure the outstanding debt of the farmers under the following heads in
accordance with the guidelines issued by RBI/ NABARD: - Farmers
in distress – Rescheduling/restructuring of the outstanding
loan of the farmers as on March 31, 2004 in the districts declared as calamity
– affected by the State Government. Rescheduled loan shall be repayable
over a period of five years, at current interest rates, including an initial moratorium
of two years.
- Farmers in arrears - Loans in
default of farmers who have become ineligible for fresh credit as their earlier
debts have been categorised as sub-standard or doubtful shall be rescheduled as
per the guidelines so that such farmers become eligible for fresh credit.
iii) To grant a one-time settlement (OTS) including partial waiver of interest
or loan to the small and marginal farmers who have been declared as defaulters
and have become ineligible for fresh credit. Banks have also been advised to review
cases where credit has been denied on the sole ground that a loan account was
settled through compromise or write offs.
iv) In some parts of the country,
farmers face acute distress because of the heavy burden of debt from non-institutional
lenders (e.g., moneylenders). Banks have been permitted to advance loans
to such farmers to provide them relief from indebtedness.
v) All the
Public Sector banks have been advised to reduce their lending rate for agriculture
to a single digit rate of not more than 9 per cent per annum on crop loans upto
a ceiling of Rs.50,000. This rate will benefit most of the crop loan account holders
and will cover almost all the small and marginal farmers.
vi) To waive
margin/security requirements for agricultural loans up to Rs.50,000 and agri-business
and agri-clinics up to Rs.5 lakhs. With a view to further increasing the flow
of credit to agriculture, several measures were announced by RBI in its Annual
Policy Statement 2005-06. These include i) setting up of an Expert Group to formulate
strategy for increasing investment in agriculture, ii) conducting a survey with
the help of an outside agency to make an assessment of customer satisfaction on
credit delivery in rural areas by banks, iii) to increase the limit on loans to
farmers through the produce marketing scheme from Rs.5 lakh to Rs.10 lakh under
priority sector lending.
Special Rehabilitation Package for
the Districts Severely Affected by Farmers’ Suicide
The incidents of suicide by farmers have been mainly reported from the States
of Andhra Pradesh, Karnataka, Maharashtra, and Kerala. Such incidents have also
been reported from the States of Orissa, Gujarat, and Punjab. To mitigate the
distress of farmers, the Government of India decided to launch a special rehabilitation
package in 31 Districts in the States of Maharashtra, Andhra Pradesh, Karnataka,
and Kerala. The 31 Districts5 were identified based on the severity and magnitude
of the incidence of farmers’ suicide, as reported by the State Governments.
The intent is to initially solve the problem and correct the situation in those
areas reporting high number of suicides so that an effective dent on the problem
is made and the incidence of farmers’ suicide which is of national concern
could be curbed.
The package aims at establishing a sustainable and viable
farming and livelihood support system through debt relief to farmers, improved
supply of institutional credit, crop-centric approach to agriculture, assured
irrigation facilities, watershed management, better extension and farming support
services, improved marketing facilities and subsidiary income opportunities through
horticulture, livestock, dairying, fisheries. For alleviating the hardships caused
to debt stressed families of farmers in the affected districts, ex-gratia assistance
from Prime Minister’s National Relief Fund (PMNRF) was also proposed. Section
IV Issues and ConcernsDespite the significant strides achieved in terms
of spread, network and outreach of rural financial institutions, the quantum of
flow of financial resources to agriculture continues to be inadequate. One of
the major impediments constraining the adoption of new technological practices,
land improvements and building up of irrigation and marketing infrastructure has
been the inadequacy of farm investment capital. Farmers seem to borrow more short-term
credit in order to meet input needs to maintain continuity in agricultural operations
without much worrying about long-term capital formation in the face of agricultural
bountiness. It might be the case from supply side that short-term credit bears
low credit risk, lower supervision and monitoring costs, and a better asset liability
management. The flow of investment credit to agriculture is constrained
by host of factors such as high transaction costs, structural deficiencies in
the rural credit delivery system, issues relating to credit worthiness, lack of
collaterals in view of low asset base of farmers, low volume of loans with associated
higher risks, high man power requirements, etc.
The large proportion
of population in the lower strata, which is having major share in the land holdings
receives much less credit than its requirements. The growing disparities between
marginal, small and large farmers continues to be a cause for concern. This observed
phenomenon may be attributed, inter alia, to the “risk aversion”
tendency of the bankers towards small and marginal farmers as against the large
farmers, who are better placed in offering collaterals.
Notwithstanding
the rapid spread of micro-finance programme, the distribution of SHGs is skewed
across the States. More than 50 per cent of the total SHG credit linkages in the
country are concentrated in the Southern States. In the States, which have a larger
share of the poor, the coverage is comparatively low.
The tragic incidents
of farmers’ suicides in some of the States have been a matter of serious
concern. A study6 was conducted in some regions of Andhra Pradesh to go into the
causes of such tragedies and to suggest short and long term measures to prevent
such unfortunate incidents. The study has identified crop losses, consecutive
failure of monsoon, recurrent droughts, mounting debts, mono-cropping, land tenancy,
as some of the main causes which led many distressed farmers to commit suicide.
Of the total number of suicide cases reported, 76 per cent of the victims were
dependent on rain-fed agriculture and 78 per cent were small and marginal farmers.
An important finding of the study was that 76 to 82 per cent of the victim households
had borrowed from non-institutional sources and the interest rates charged on
such debts ranged from 24 to 36 per cent. The study has recommended several measures
to tackle the situation. These include improvement irrigation coverage; crop diversification;
promotion of animal husbandry as an alternate source of income; better accessibility
to institutional credit and overall improvement of the marketing infrastructure. Section
V
Implications for the Future Indian
agriculture still suffers from: i) poor productivity, ii) falling water levels,
iii) expensive credit, iv) a distorted market, v) many intermediaries who increase
cost but do not add much value, vi) laws that stifle private investment, vii)
controlled prices, viii) poor infrastructure, and ix) inappropriate research.
Thus the supply leading approach with mere emphasis on credit in isolation from
the above factors will not help agriculture to attain the desired growth levels.
Furthermore, agriculture being a State subject, States are required to play a
more pro-active role in agriculture development by putting in place adequate infrastructure
through means such as RIDF.
As noted above, the share of marginal and
small farmers in the total credit (both disbursed and outstanding) has been shrinking.
The need to augment the credit flow to the lower strata of the farming community,
which has more share in the total operational land holdings becomes all the more
important.
This underscores the scope for supplementing the land inputs
of marginal and small farmers with the non-land inputs such as credit with a view
to enhancing the productivity and thereby the production performance of Indian
agriculture. In this context, the need for linking credit supply to input use
assumes importance. There is also a need for exploring new innovations in product
design and methods of delivery, through better use of technology and related processes.
It needs to be seen whether credit going to farmers especially small and marginal
is in sufficient quantity and if so whether it will have any meaningful effect
in the absence of other supportive measures for ensuring their economic viability.
In this context, creation of production and employment opportunities in the rural
sector through public investment assumes critical importance. The SHG-Bank Linkage
model is an outstanding example of an innovation leveraging on community-based
structures and existing banking institutions. In future,
concerted efforts have to be made for enhancing the flow of credit to critical
infrastructure areas such as irrigation, marketing and storage, etc.,
and also to areas such as watershed/ wasteland development, wind energy, allied
activities such as poultry, horticulture, dairying, etc.
With
regard to KCCS, there is a need to upscale its outreach to cover all the eligible
farmers by creating greater awareness and giving greater publicity to the scheme.
Updation of land records and sensitisation of bank staff through training programmes
will further add to the spread of the scheme. The exercise of preparing special
agricultural credit plans with higher component of direct finance with a special
thrust on small and marginal farmers should also receive high priority.
The
success of KCC scheme depends on less stipulated norms. High value agriculture
needs higher working capital and also entails higher risks. Facilitating credit
through processors, input dealers, NGOs, that are vertically integrated with the
farmers, including through contract farming, for providing them critical inputs
or processing their produce, could increase the credit flow to agriculture significantly. Section
VI Concluding Observations The co-operative credit structure needs
revamping to improve the efficiency of the credit delivery system in rural areas.
In case of co-operatives, the Vaidyanathan Committee concluded that having regard
to its outreach and potential, recapitalisation could be undertaken so that the
credit channels for agricultural credit which are presently choked could be declogged.
The Committee has, however, made it clear that recapitalisation should only be
considered if it is preceded by legal and institutional reforms by State Governments
aimed at making co-operatives democratic and vibrant institutions running as per
sound business practices, governance standards and regulated at the upper tiers
by the RBI. In this connection, it may be suggested that the State Governments’
performance in bringing about the reforms in co-operative banks should form one
of the yardsticks for sanctioning assistance/grants by the Central Government. The
competition and search for higher returns has made commercial banks to explore
profitable avenues and activities for lending such as financing of contract farming,
extending credit to the value chain, financing traders and other intermediaries,
which needs to be encouraged. While the institutional systems and products such
as futures markets, and weather insurance have great potential to minimise the
risk of lending, the process of their development needs to be carried forward.
Merging and revamping of RRBs that are predominantly located in tribal/backward
regions is seen as a potentially significant institutional arrangement for financing
the hitherto unreached population. Such an exercise is currently on and the State
Governments and Sponsor Banks have to come together and cooperate in this area.
The experience of micro finance proved that the “poor are bankable”
and they can and do save in a variety of ways and the creative harnessing of such
savings is a key success factor. The SHG-Bank linkage programme is built upon
the existing banking infrastructure, it has obviated the need for the creation
of a new institutional set-up or introduction of a separate legal and regulatory
framework. Policy making bodies have an important role in creating the enabling
environment and putting appropriate policies and interventions in position, which
enable rapid up scaling of efforts consistent with prudential practices.
There is also a need to explore the possibility how SHGs can be induced to graduate
into matured levels of enterprise. The SHG Bank-Linkage programme also needs to
introspect whether it is sufficient for SHGs to only meet the financial needs
of their members, or whether there is a further obligation on their part to meet
the non-financial requirements necessary for setting up business and enterprises.
In the process, ensuring the quality of SHGs warrants priority attention. State
Governments have to make critical assessment of the manpower and skill sets available
with them for forming, and nurturing groups and handholding and maintaining them
over time. There is a need to study the best practices in the area and evolve
a policy by learning from them. Since, the access of small and marginal farmers
to credit has been constrained by their inability to offer the collaterals, micro
finance, which works on social collaterals, can go a long way in catering to their
requirements. Hence, there is need to promote micro finance more vigorously on
a widespread basis.
To conclude, an assesment of agriculture credit situation
brings out the fact that the credit delivery to the agriculture sector continues
to be inadequate. It appears that the banking system is still hesitant on various
grounds to purvey credit to small and marginal farmers. The situation calls for
concerted efforts to augment the flow of credit to agriculture, alongside exploring
new innovations in product design and methods of delivery, through better use
of technology and related processes.
Notes
1. 1990s referred wherever covers the period from 1990-91 to 2001-02,
the latest year for which the data are available.
2. RIDF
was setup under the initiative of the Government of India in 1995-96 with an initial
corpus of Rs.2,000 crore to provide loans to State Governments for financing rural
infrastructure projects. 3. 32 recommendations (out of 99 recommendations
made by the Committee) have been accepted and implemented by the Reserve Bank.
The major recommendations are i) A comprehensive review of mandatory lending to
agriculture by commercial banks to enlarge direct lending programmes for greater
integration of investment credit and production credit. ii) A road map for public
sector and private sector banks to reach a level of direct lending at 13.5 per
cent of net bank credit-within the overall limit of 18.0 per cent of total agricultural
lending -within a period of four years with an interim target of 12 per cent in
two years. Special Agricultural Credit Plan (SACP) to be restricted to direct
lending and extended to private sector banks. iii) The share of small and marginal
farmers in agricultural credit to be raised to 40 per cent of disbursements under
the Special Agricultural Credit Plan (SACP) by the end of the Tenth Plan period.
iv) Expanding the outreach of banks in rural areas by enlarging retail lending
to agriculture, externalising retailing through corporate dealer networks, organisational
innovations, offering hedging mechanisms to the farmers, providing legal backing
to tenancy to facilitate access to credit, capacity building of borrowers, greater
use of information technology, procedural simplifications and modifications in
the service area approach. v) Reductions in cost of agricultural credit through
enhancing the cost effectiveness of agricultural loans, especially in terms of
cost of raising funds, transaction cost and risk cost. vii) Impediments to the
flow of credit to disadvantaged borrowers to be mitigated through reduction in
cost of borrowing, revolving credit packages, procedural simplifications, involvement
of Panchayati Raj institutions and extension of micro finance.
4. In agecny model, banks adopt the infrastructure of civil society organisation,
rural kiosks and village knowledge centres to provide credit support to rual and
farm sector
5. Maharashtra (6): Akola, Wardha, Amaravati,
Buldhana, Washim, and Yawatmal. Karnataka (6): Belgaum, Hasan, Chitradurga, Chikmagalur,
Kodagu, and Shimoga. Kerala (3) : Wayanad, Palakkad, and Kasargod. Andhra Pradesh
(16 ) : Prakasam, Guntur, Nellore, Kadapa, Chittoor, Ananthapur, Kurnool, Adilabad,
Karimnagar, Khammam, Mahabubnagar, Medak, Nalgonda, Nizamabad, Ranga Reddy, and
Warangal.
6. As per the information available in a speech
delivered by the Union Minister of Agriculture at the National Development Council,
New Delhi on June 27, 2005.
Selected References
1. Government of India, Economic Survey,
various issues.
2. ____________ (2004) Task Force on Revival of Cooperative
Credit Institutions (Chairman: A.Vaidyanathan). 3. ____________
Press Releases.
4. Mohan, Rakesh (2004) “Agricultural
Credit in India: Status, Issues and Future Agenda” RBI Bulletin,
November.
5. NABARD “Annual Report”
various issues.
6. Pawar, Sharad (2005) Speech at
the Meeting of the National Development Council, New Delhi on June 27,
7. Reddy, Y.V. (2001) “Indian Agriculture and Reform:
Concern, Issues and Agenda” RBI Bulletin, March.
8.
Reserve Bank of India “Annual Report”, various issues
9. ________________‘‘Handbook of Statistics on the Indian Economy”,
2004-05.
10. ________________”Report on Trend and Progress of Banking
in India”, various issues.
11. _______________(2004) Report
of the Advisory Committee on Flow of Credit to Agriculture and Related Activities
from the Banking System
(Chairman: Prof. Vyas)
12. ______________
(2005) Report of the Expert Group on Investment Credit (Chairman: Y.S.P.
Thorat).
* The author is Assistant Adviser in the Department
of Economic Analysis and Policy of the Bank. He is grateful to Shri K.U.B Rao,
Adviser for constant encouragement. The responsibility for the views expressed
in the paper rests with the author only and the usual disclaimer applie. |
 IST,
IST,


